
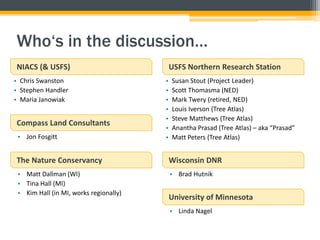
Download as PDF, PPTX
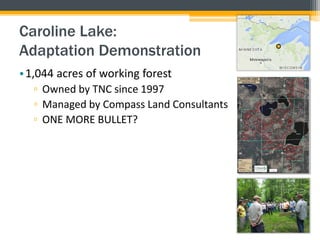
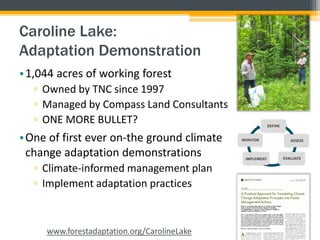
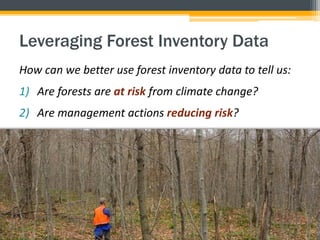
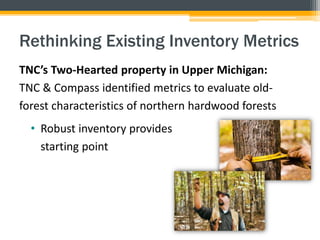
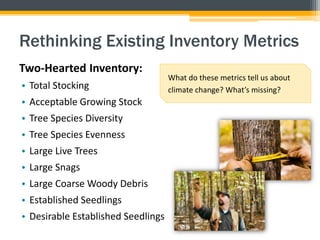

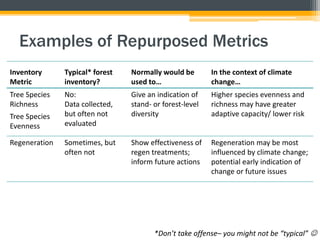
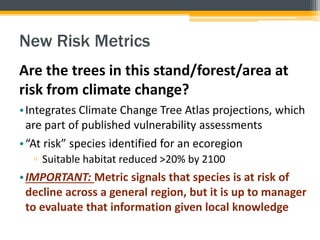
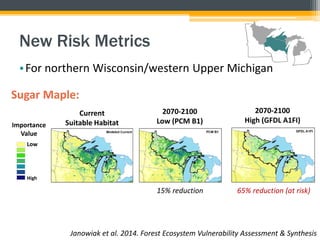
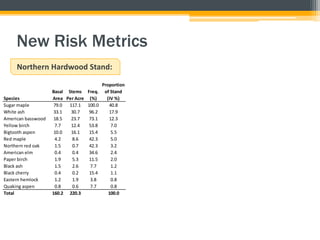
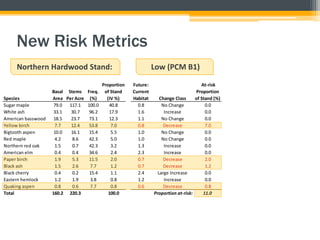
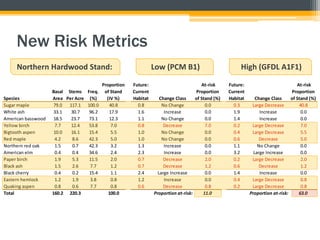
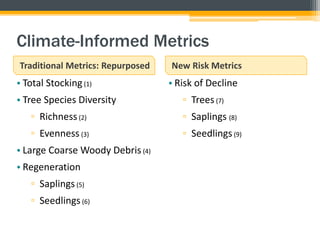
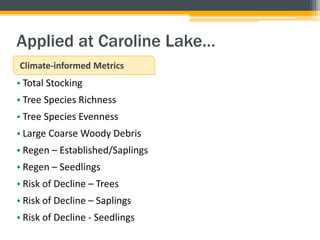
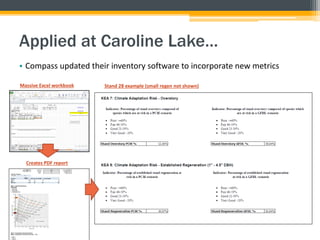
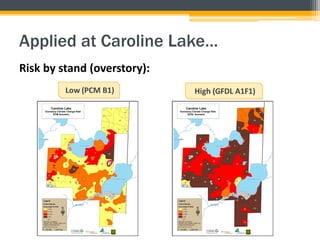
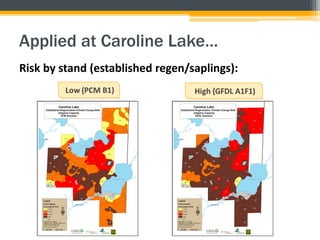


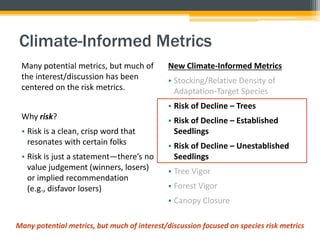
This document discusses using forest inventory data to assess climate change risks and inform forest management. It proposes repurposing existing inventory metrics and developing new metrics focused on species risk of decline based on climate projections. An example inventory from a northern hardwood forest in Wisconsin/Michigan is provided applying both traditional and new climate-informed metrics to quantify current species composition and projected risk of decline under different climate scenarios. Implementing these climate-informed metrics in an inventory of The Nature Conservancy's Caroline Lake property is discussed as an example of applying this approach on the ground to evaluate risk and guide adaptation actions.


![Polymer [ बहुलक ] Chemistry Notes PDF - Irfanullah Mehar - JJ Sir Chemistry.pdf](https://cdn.slidesharecdn.com/ss_thumbnails/polymerchemistrynotespdf-irfanullahmehar-jjsirchemistry-260210172118-3f9b37f7-thumbnail.jpg?width=640&height=640&fit=bounds)


