Download as PDF, PPTX
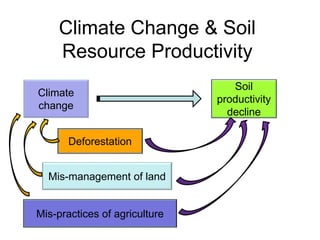
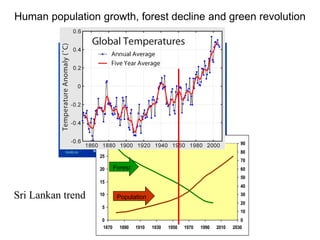
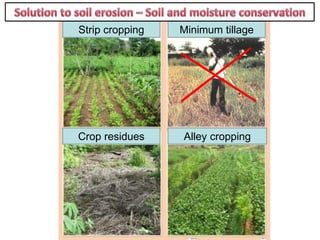
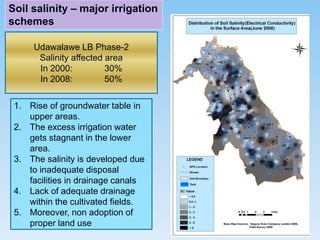
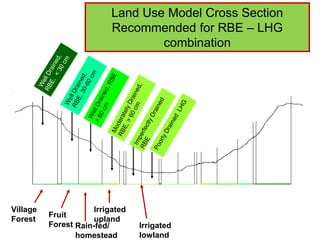
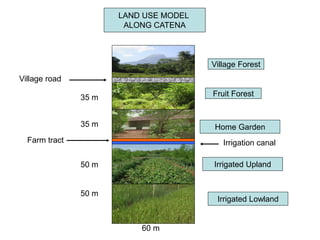
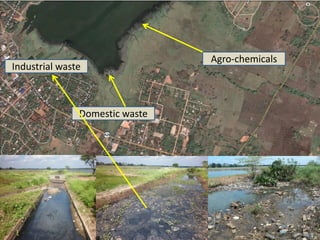

The presentation discusses the impact of climate change on soil productivity, highlighting the challenges posed by deforestation, agricultural mismanagement, and human population growth. It addresses the consequences of high-input agricultural practices, including soil erosion and chemical pollutants, as well as the need for conservation methods. Recommendations for sustainable land use and water management strategies are presented to mitigate these issues.


