Download to read offline


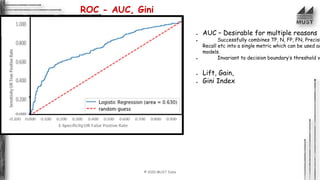


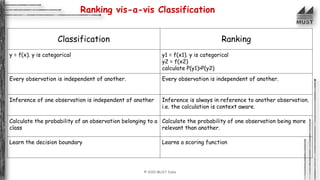


The document outlines the concepts of classification and ranking in machine learning, emphasizing predictive analytics and the distinction between supervised learning, regression, and classification tasks. It details various algorithms, metrics for evaluation such as confusion matrix and ROC-AUC, and discusses the complexities and decision boundaries of different classification models. Additionally, it introduces ranking approaches and algorithms, illustrating their applications in real-world scenarios like information retrieval and decision-making.