Download to read offline


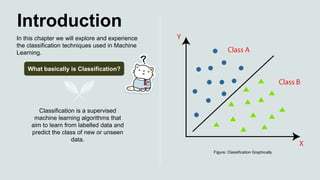


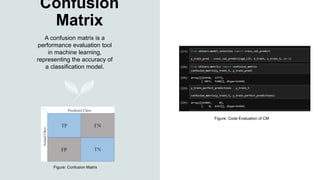
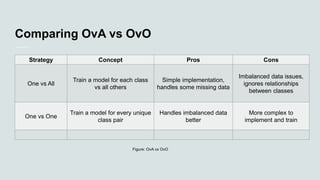


Chapter 3 discusses classification in machine learning, focusing on techniques for predicting classes from labeled data using the MNIST dataset of handwritten digits. Key topics include the confusion matrix for model evaluation, precision, recall, and F1 score as performance metrics, and a comparison between one-vs-all and one-vs-one strategies for classification. The chapter emphasizes the importance of understanding these concepts for effective machine learning model implementation.