Civil Beat Poll June 2013 — Toplines Schatz and Hanabusa
•Download as DOC, PDF•
0 likes•1,493 views

This document summarizes the results of a Civil Beat Poll of 869 registered voters in Hawaii conducted in June 2013. It shows the results of questions regarding opinions on various Hawaii politicians, past voting behavior, demographics, and other topics. For example, 36% said they would vote for Brian Schatz in the Democratic Senate primary compared to 33% for Colleen Hanabusa. It also breaks down results by gender, age, ethnicity, political views, and other categories.

Recommended
More Related Content
What's hot
What's hot (18)
Viewers also liked
Similar to Civil Beat Poll June 2013 — Toplines Schatz and Hanabusa
Similar to Civil Beat Poll June 2013 — Toplines Schatz and Hanabusa (20)
More from Honolulu Civil Beat
More from Honolulu Civil Beat (20)
Recently uploaded
Recently uploaded (20)
Civil Beat Poll June 2013 — Toplines Schatz and Hanabusa
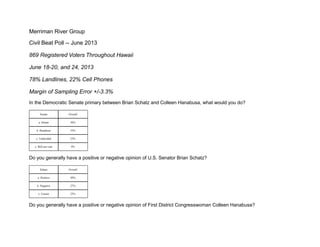
- 1. Merriman River Group Civil Beat Poll -- June 2013 869 Registered Voters Throughout Hawaii June 18-20, and 24, 2013 78% Landlines, 22% Cell Phones Margin of Sampling Error +/-3.3% In the Democratic Senate primary between Brian Schatz and Colleen Hanabusa, what would you do? Senate Overall a. Schatz 36% b. Hanabusa 33% c. Undecided 23% z. Will not vote 9% Do you generally have a positive or negative opinion of U.S. Senator Brian Schatz? Schatz Overall a. Positive 49% b. Negative 27% z. Unsure 25% Do you generally have a positive or negative opinion of First District Congresswoman Colleen Hanabusa?
- 2. Hanabusa Overall a. Positive 48% b. Negative 41% z. Unsure 11% Do you generally have a positive or negative opinion of Senator Mazie Hirono? Hirono Overall a. Positive 54% b. Negative 33% z. Unsure 13% Do you generally have a positive or negative opinion of Second District Congresswoman Tulsi Gabbard? Gabbard Overall a. Positive 67% b. Negative 16% z. Unsure 17% What did you do in Hawaii’s contest for Senate between Mazie Hirono and Linda Lingle? SenElect Overall a. Hirono 57% b. Lingle 32% z. DNV/Unsure 11% This past August, there was a Democratic Senate primary between Mazie Hirono and Ed Case. If you voted in that contest, what did you do?
- 3. SenPrimary Overall a. Hirono 44% b. Case 31% z. DNV/Unsure 25% In the presidential election this past November, did you vote for Barack Obama, Mitt Romney, or neither candidate? PresElect Overall a. Obama 70% b. Romney 20% z. DNV/Unsure 10% Gender: Gender Overall a. Male 44% b. Female 56% Age_Under_Over: Age_Under_Over Overall a. Under 50 50% b. 50 and over 50% Age_Full:
- 4. Age_Full Overall a. 18-29 9% b. 30-39 14% c. 40-49 27% d. 50-64 19% e. 65+ 31% What best describes your ancestry or ethnicity? Ethnicity Overall a. Caucasian 36% b. Japanese 28% c. Filipino 5% d. Hawaiian 12% e. Chinese 2% f. Hispanic/Latino 2% g. Other/Mixed 14% How would you describe your views on most political issues? Politics Overall a. Liberal/progressive 27% b. Moderate 36% c. Conservative 19% z. Unsure 18%
- 5. Which political party do you generally vote for? Party Overall a. Democrat 55% b. Republican 12% c. Independent 27% z. Unsure 6% What kind of telephones do you have? A cell phone? A regular land-line home phone? Or both? PhoneType Overall a. Both 81% b. Cell 6% c. Landline 13% What best describes your education level? Education Overall a. No degree 2% b. HS graduate 14% c. Some/Assoc/Voc 35% d. College Graduate 25% e. Grad Degree 23% Have you, or a member of your immediate family such as a spouse, sibling, parent, or child, served in the U.S. Military?
- 6. Military Overall a. Yes 59% b. No 41% Are you, or a member of your immediate family a member of a labor union? Union Overall a. Yes 39% b. No 61% Do you have any children or grandchildren under the age of 18? Children Overall a. Yes 54% b. No 40% z. Refused 6% What is your family’s current yearly household income? Income Overall a. 50k or less 33% b. 50-100k 36% z. 100k+ 30%
- 7. Military Overall a. Yes 59% b. No 41% Are you, or a member of your immediate family a member of a labor union? Union Overall a. Yes 39% b. No 61% Do you have any children or grandchildren under the age of 18? Children Overall a. Yes 54% b. No 40% z. Refused 6% What is your family’s current yearly household income? Income Overall a. 50k or less 33% b. 50-100k 36% z. 100k+ 30%