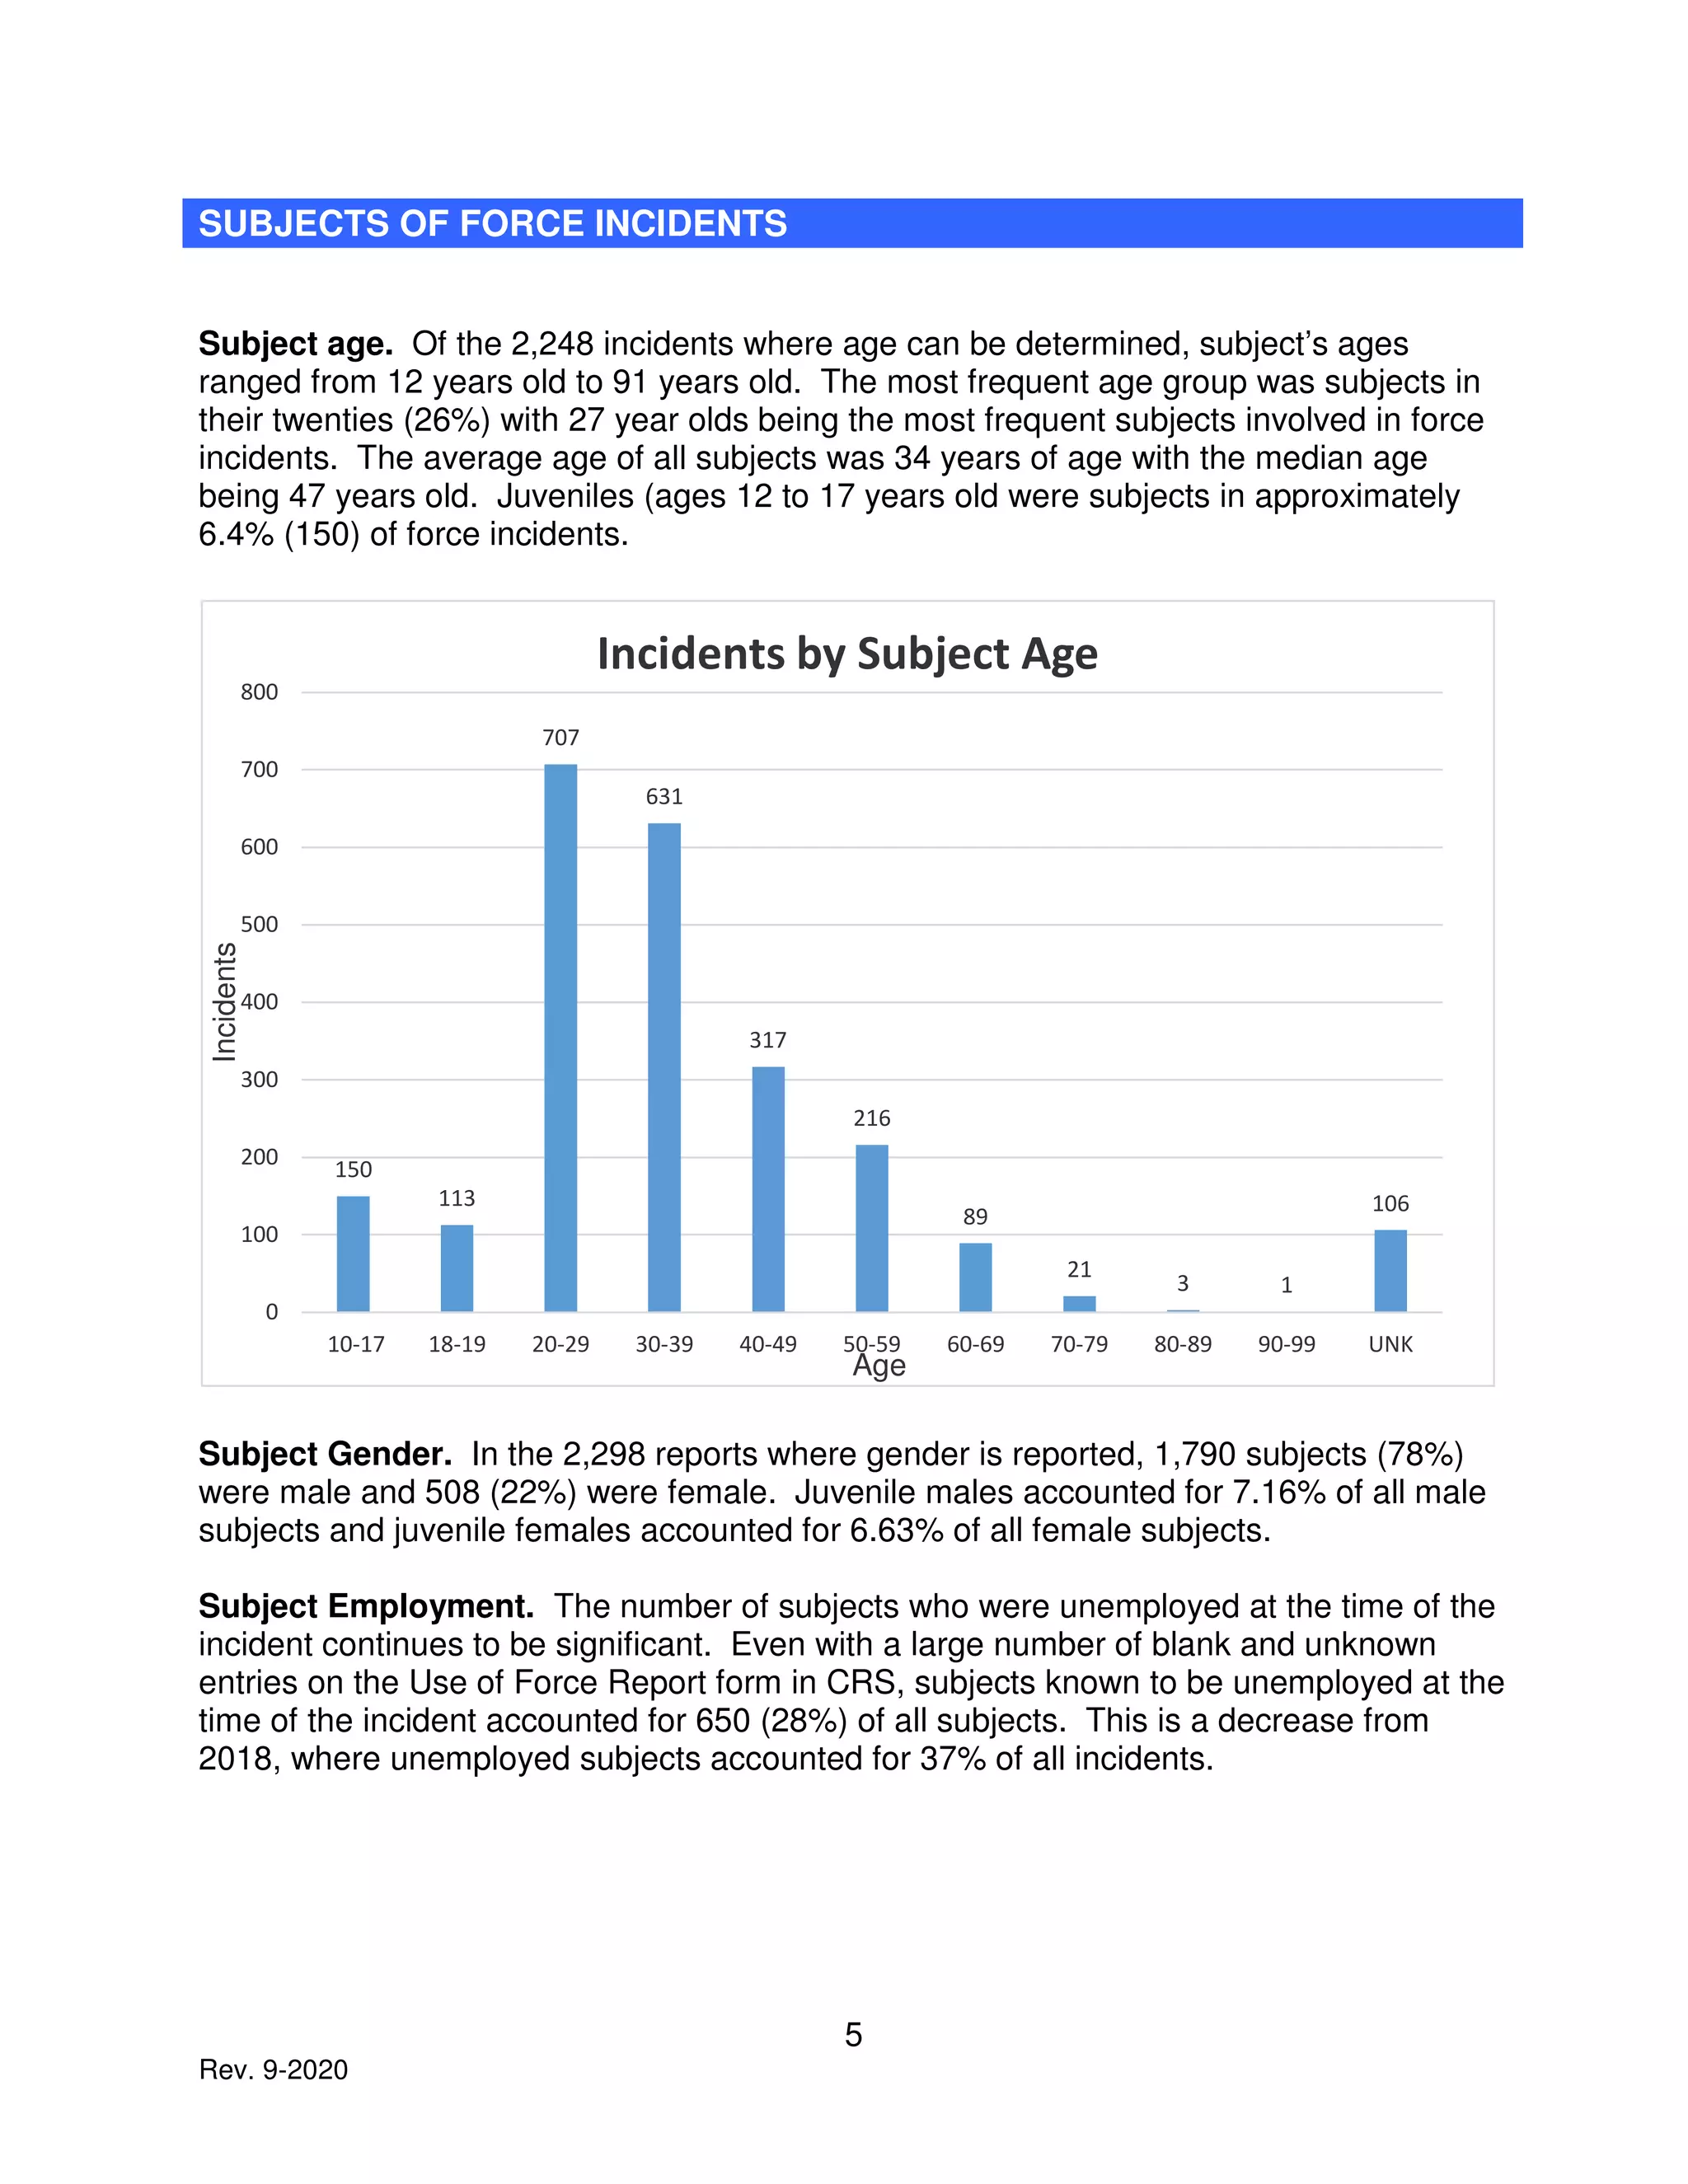
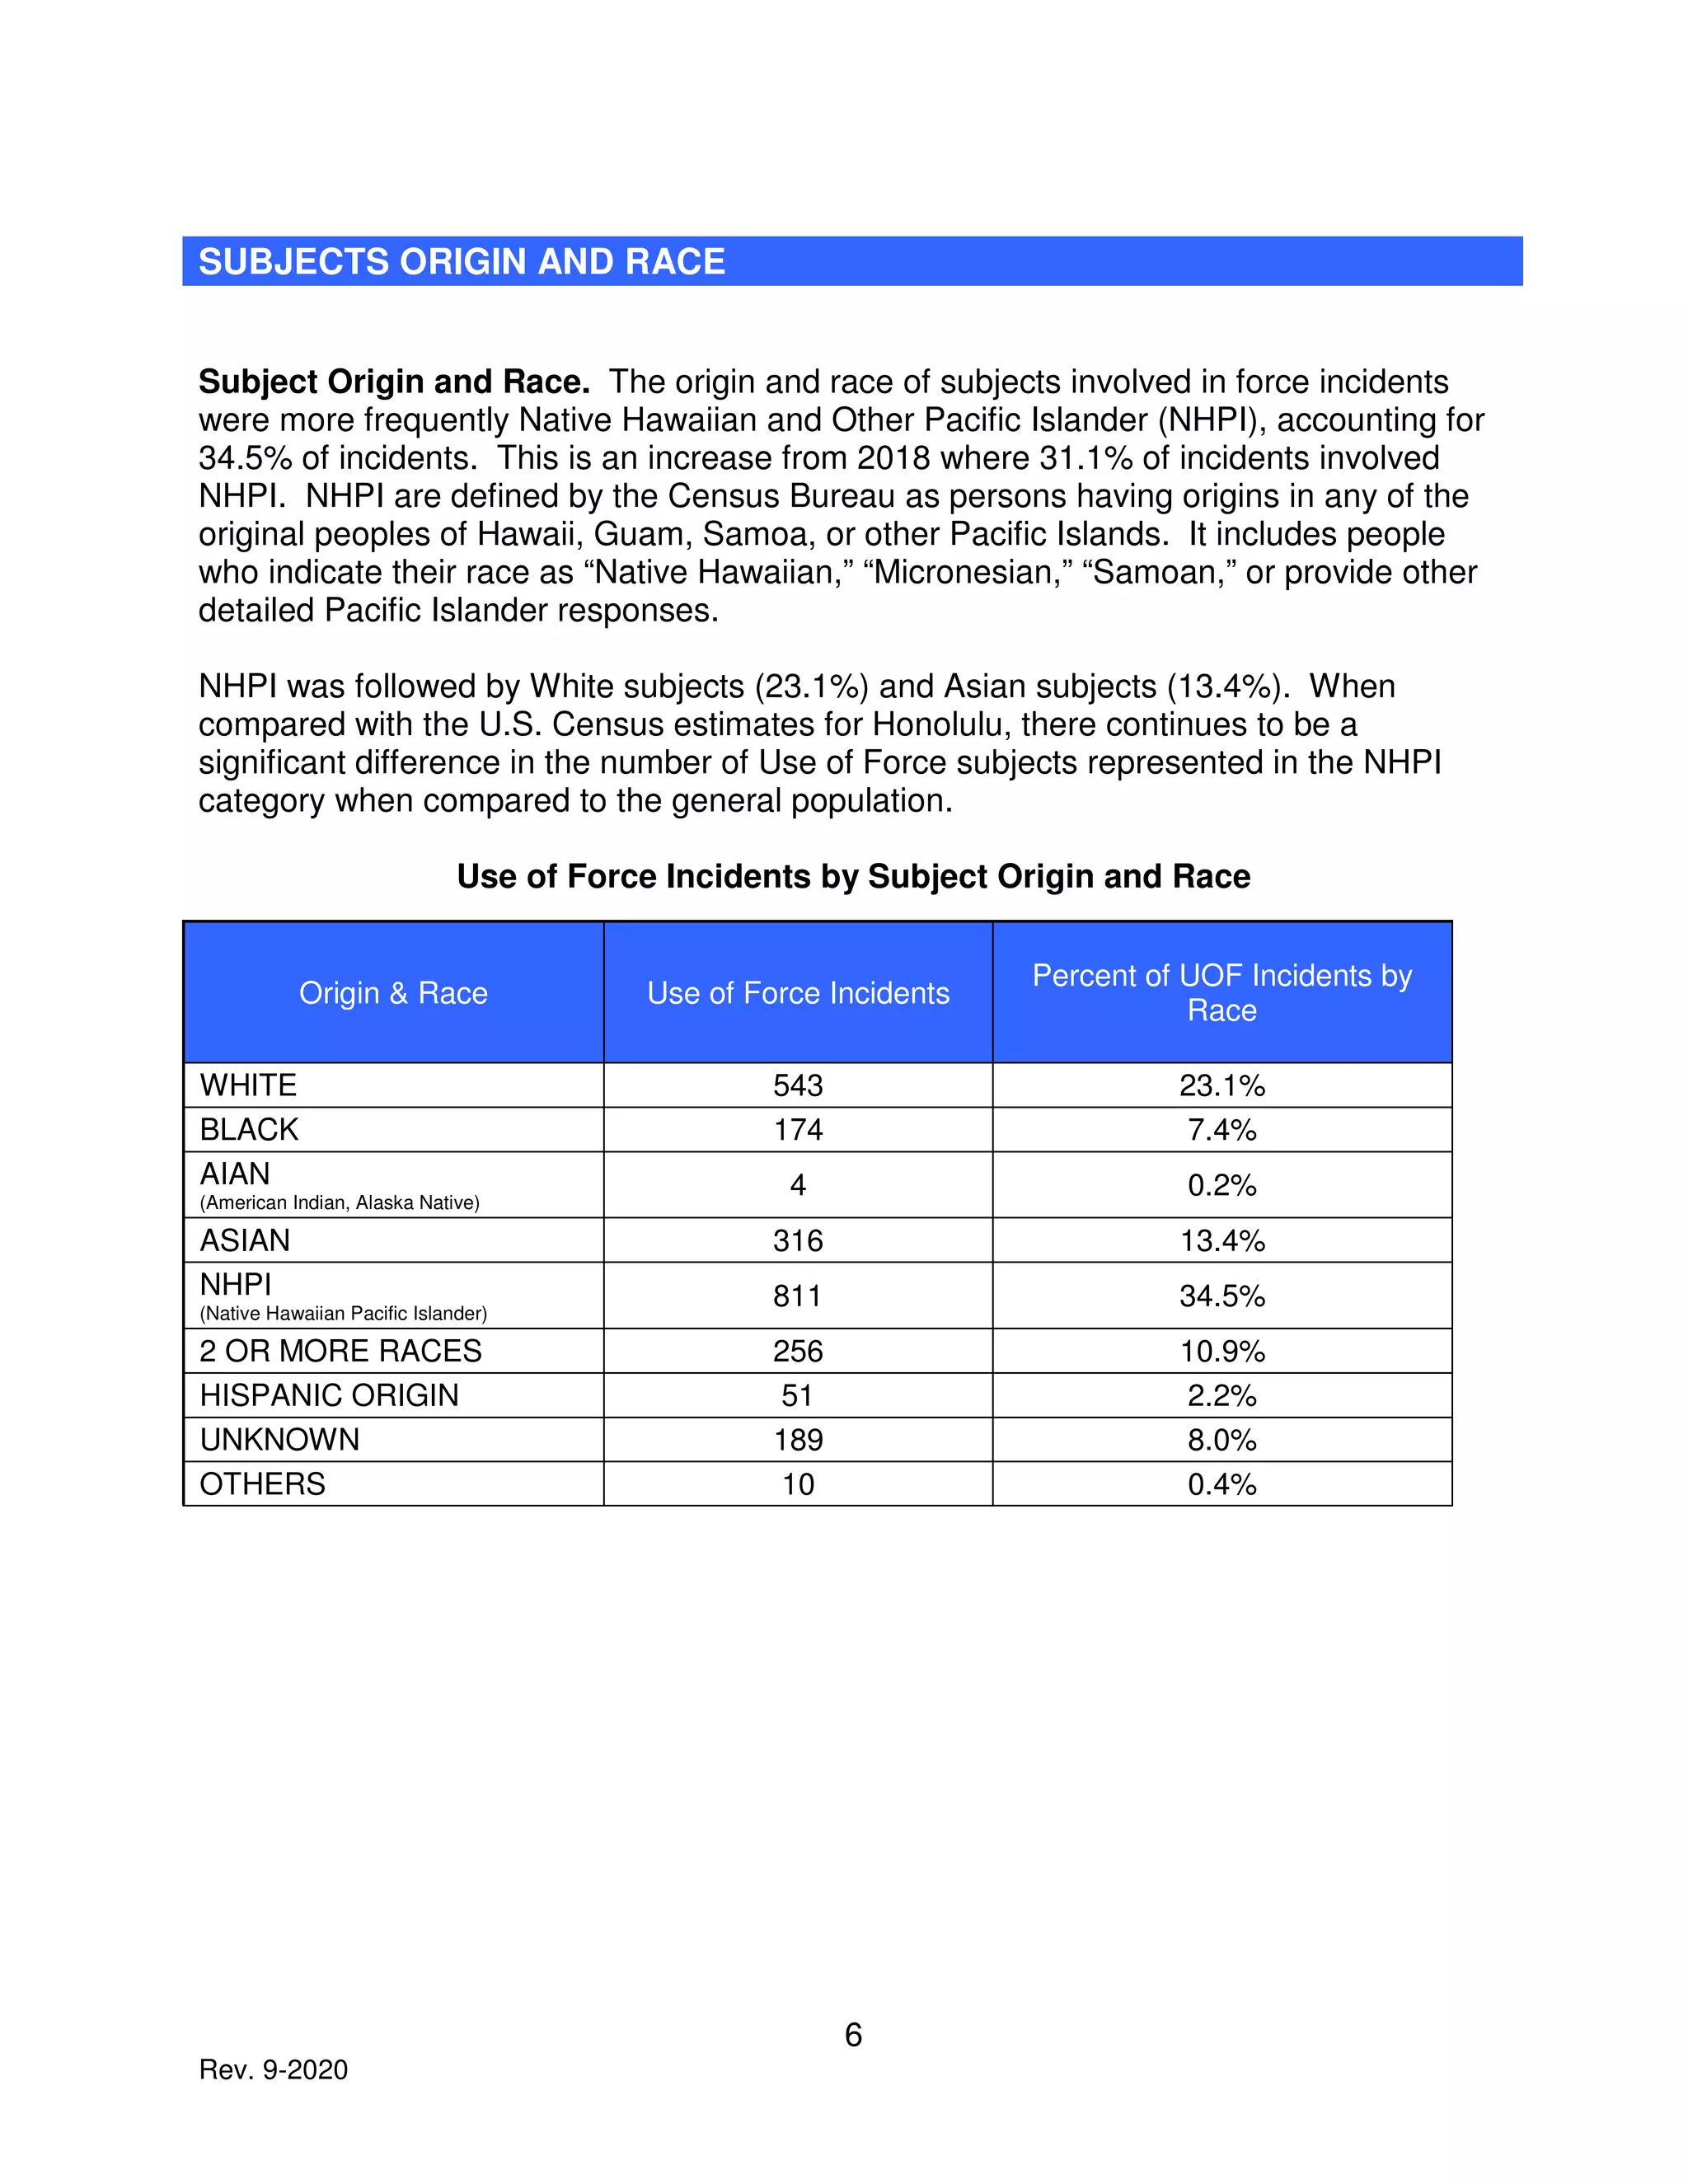
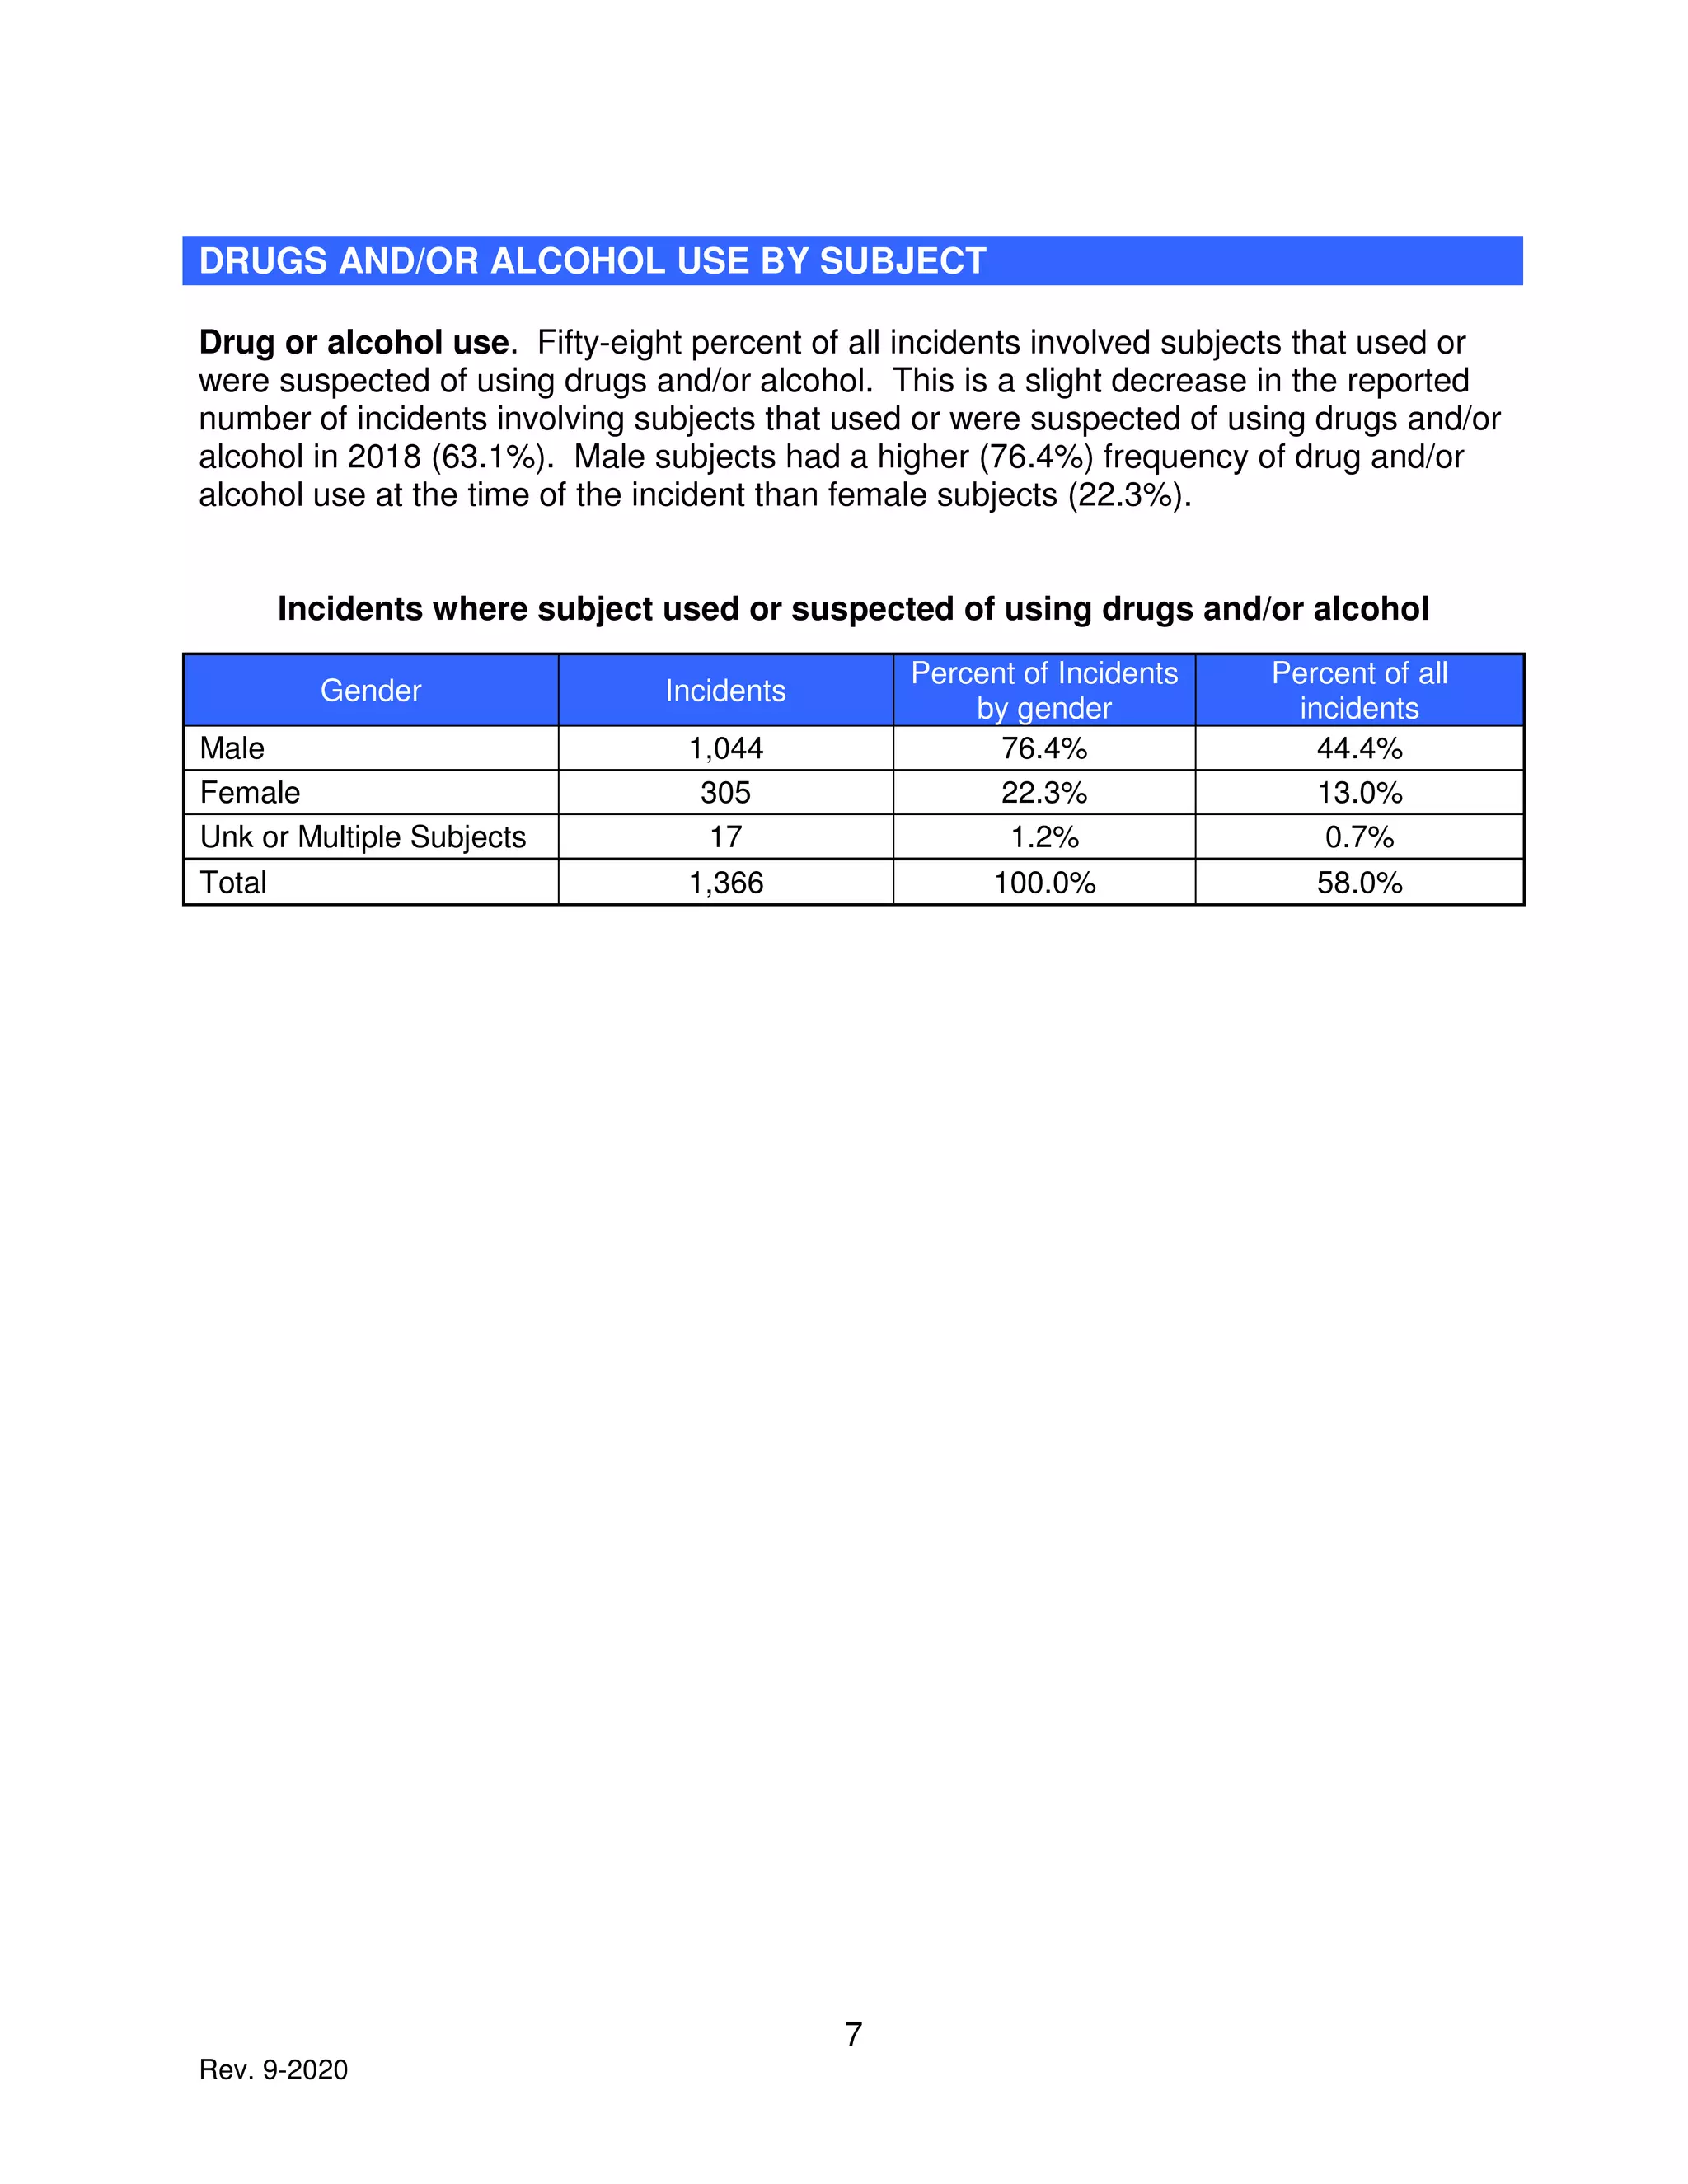
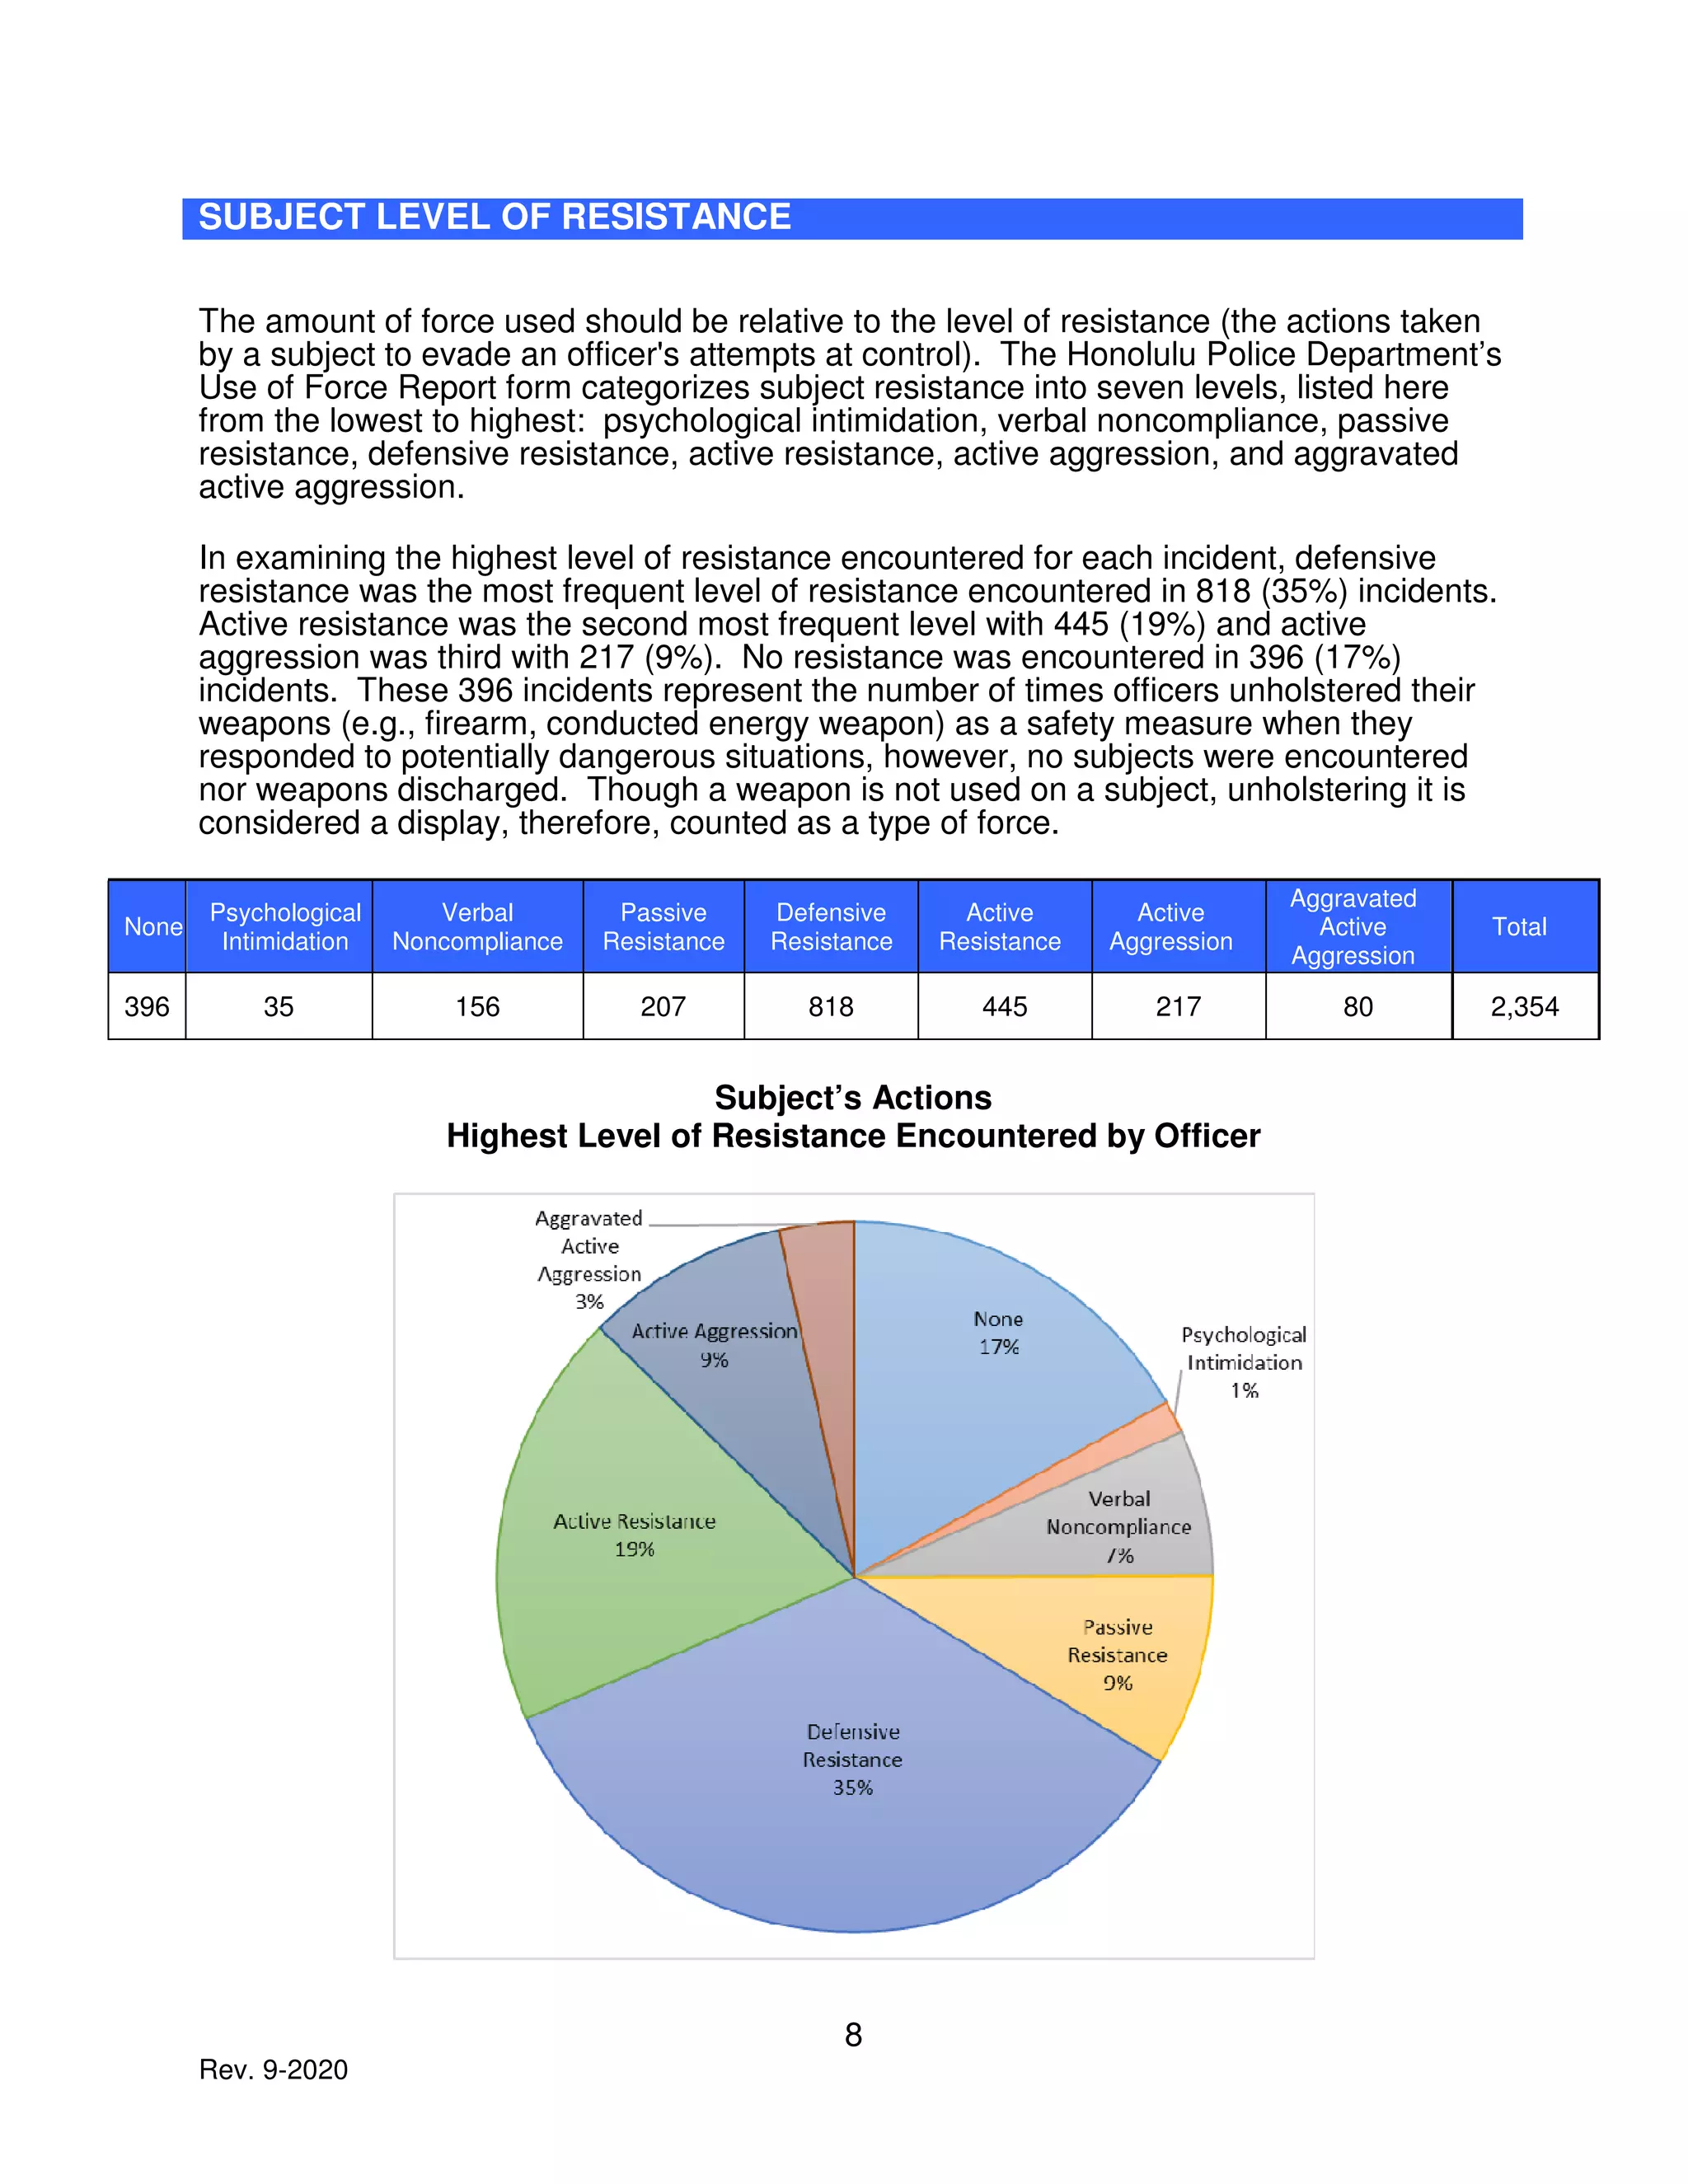
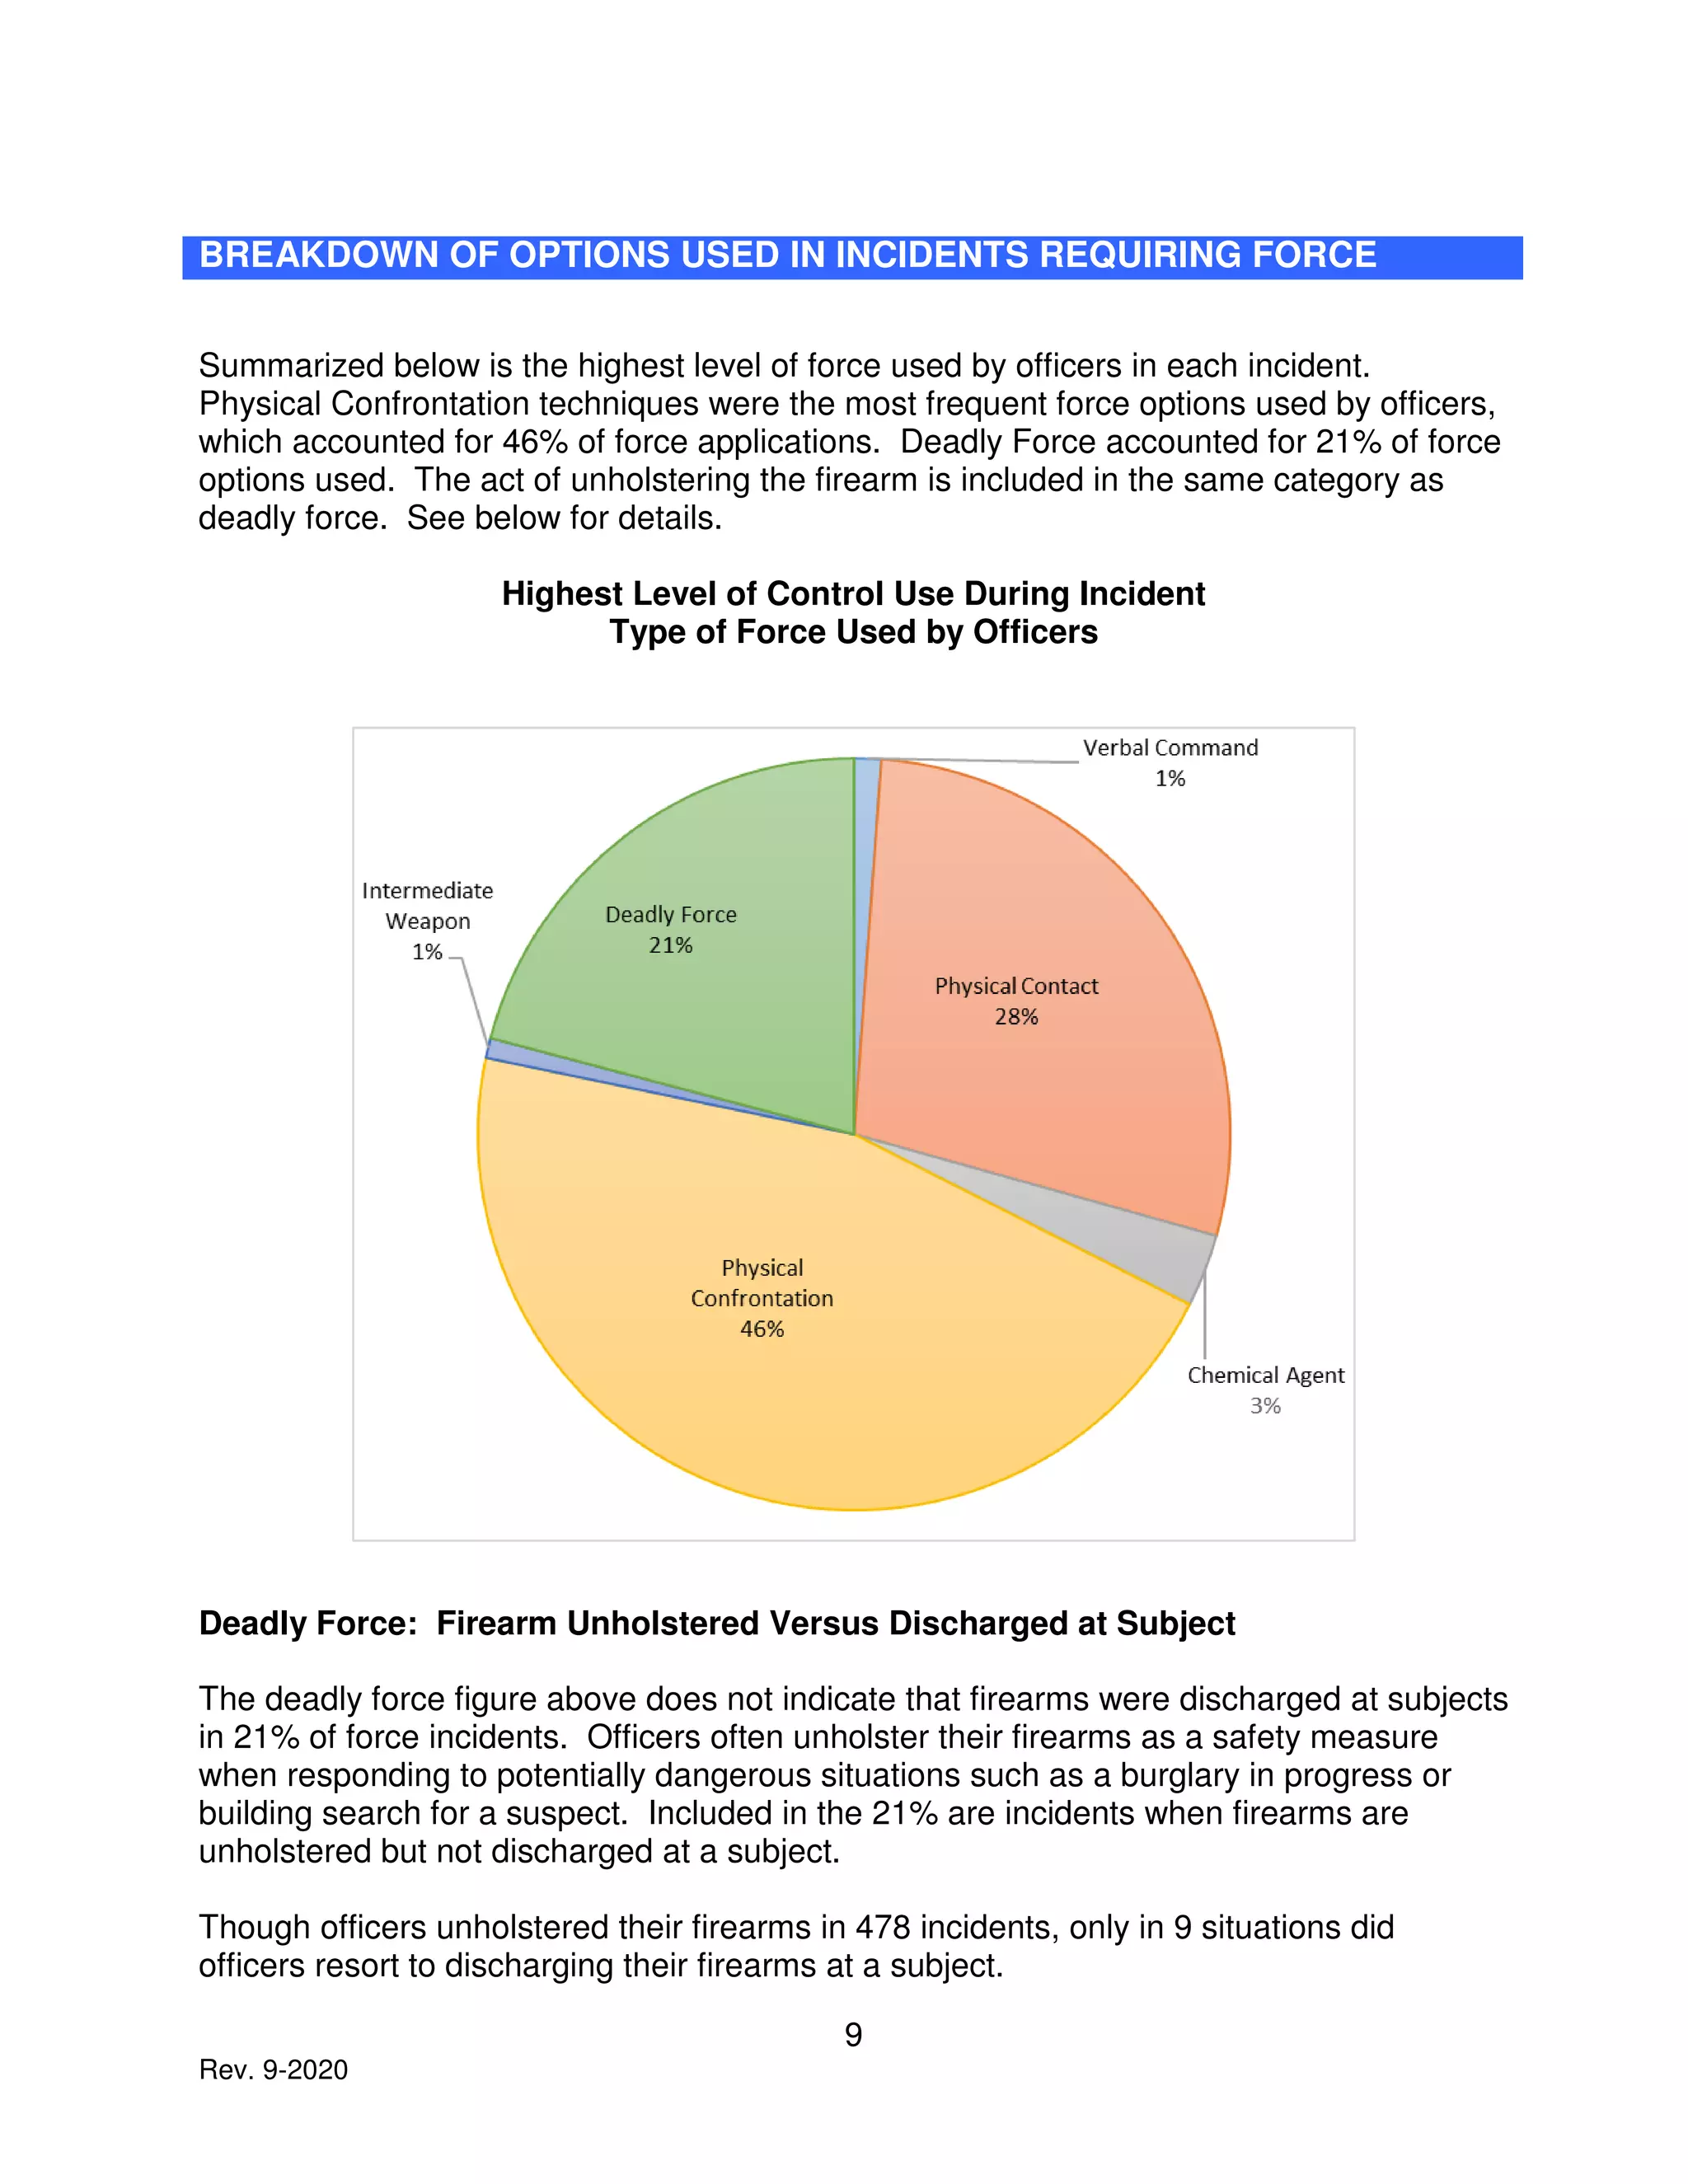
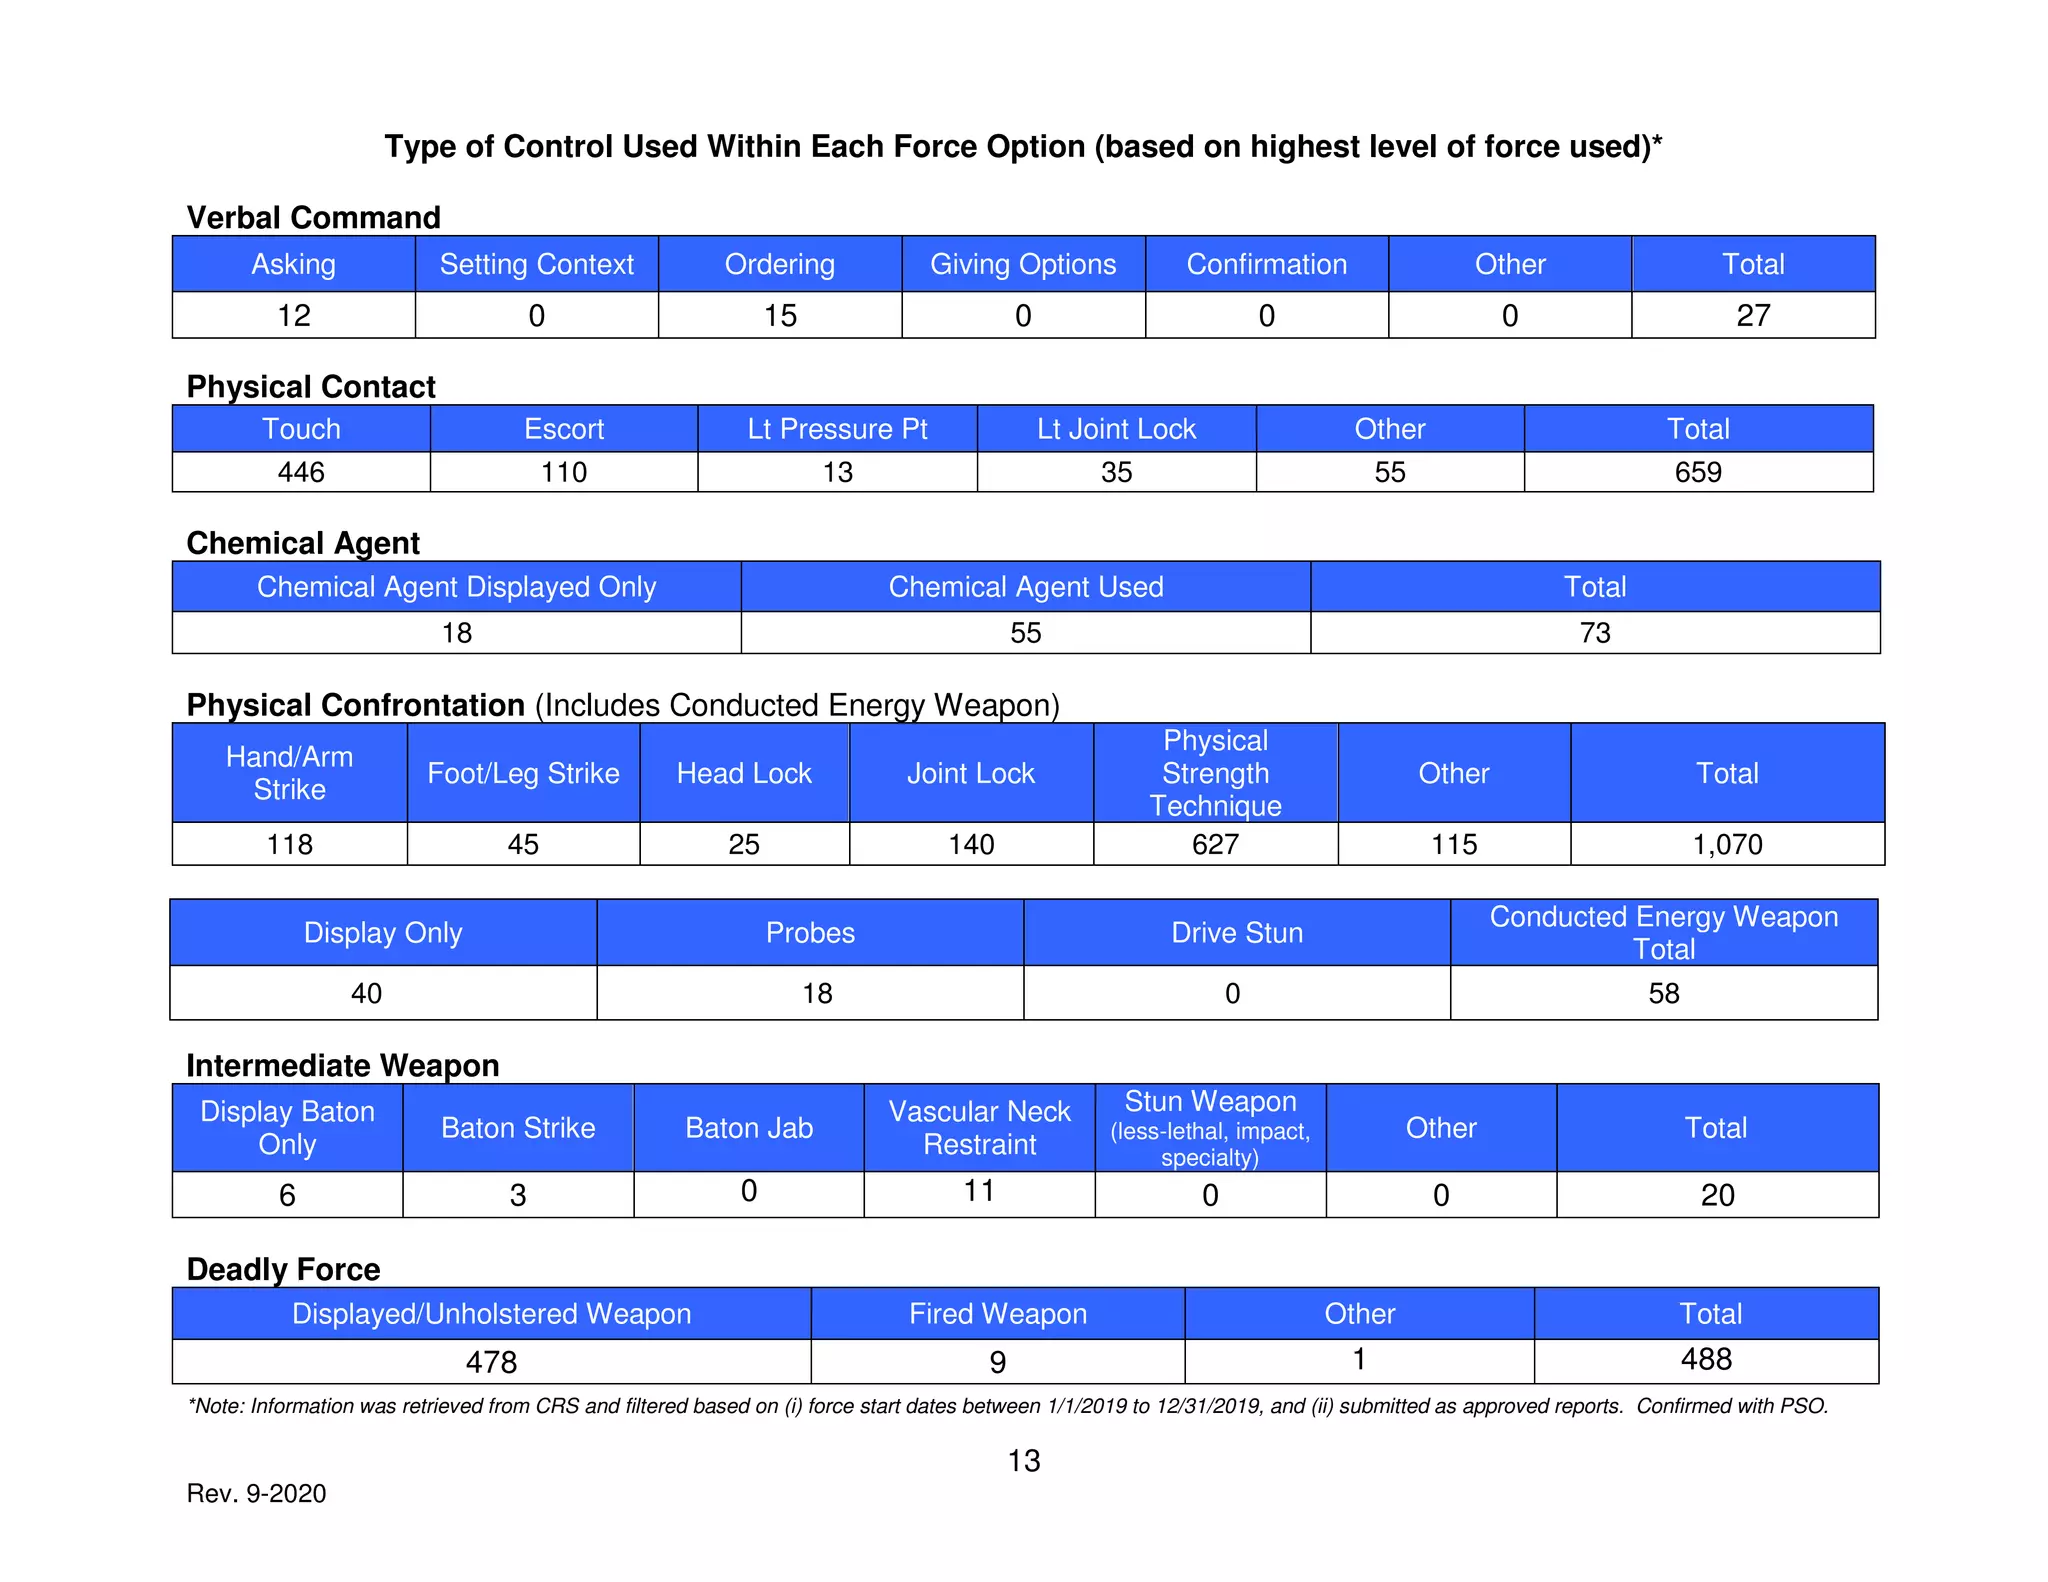
SlideShare a Scribd company logo
1 of 18
Download to read offline
1
Rev. 9-2020
EXECUTIVE SUMMARY: USE OF FORCE REPORT
This report provides a summary of force incidents by Honolulu Police Department (HPD)
officers for 2019. Use of force information officers entered into the department’s Case
Reporting System (CRS) is the data source for this report. The key findings are
summarized below:
• During the year, 2,354 Use of Force incidents were reported and submitted by
officers. This is an increase from 2018 when there were 2,070 incidents reported
and submitted by officers.
• Only a small percentage of police interactions with the public involved the use of
force. The department averaged 4.14 force incidents per 1,000 calls for service.
This is an increase from 2018 when the department averaged 3.67 force incidents
per 1,000 calls for service.
• The most common types of incidents that required officers to use force were
Simple Assault 13.4% (316), Mental Health, also known as MH-1 13.2% (312),
and Miscellaneous Public 6.7% (158) cases. This is similar to the 2018 findings.
• During the year, most of the force incidents occurred on Mondays and Saturdays.
The time of the day when most incidents occurred was between 2400 hours and
0059 hours.
• In 2019, the average age of subjects was 34 years old. The average was the
same for 2018. Males accounted for 78% of subjects involved in force incidents.
Juvenile subjects ranged in age from 12 to 17 years old and were involved in 6.4%
of incidents. Unemployed subjects accounted for 28% of all subjects. At 34.5%,
the greatest number of subjects in force incidents were Native Hawaiian Pacific
Islanders. Subjects suspected of drug and/or alcohol use at the time of the
incident accounted for 58% of all force incidents. This is a decrease from 2018,
where 63.1% of all force incidents involved subjects where drug and/or alcohol use
was suspected.
• In 2019, Physical Confrontation techniques were the most frequent force option
used by officers and accounted for 53% of force applications, as compared to 51%
in 2018.
• There were five subject deaths involving firearms discharged by officers.
• There were no subject injuries in 74% of the incidents, as compared to 73% in
2018.
• In 2019, there were no officer injuries in 95% of the incidents, as compared to 94%
in the previous year.
2
Rev. 9-2020
GENERAL INFORMATION
The Honolulu Police Department’s jurisdiction is the City and County of Honolulu (island
of Oahu). The land area is approximately 600 square miles with an estimated resident
population of 980,080. The department geographically divides the island into eight police
districts.
At the end of 2019, the actual personnel strength of the department was 2,292 of which
1,825 were police officers.
Calls for Service. In 2019, the department recorded 568,157 calls for service that
resulted in a case report. Calls for service are incidents that require the presence of
officers and/or come to the attention of officers via the communications center (9-1-1
calls) or are field-initiated.
The following provides a general summary of use of force incidents by district.
3
Rev. 9-2020
USE OF FORCE INCIDENTS
Data collection. When any use of force beyond routine handcuffing is used, a use of
force report is completed and submitted by the officer who used force, whether injuries
occurred or not. Data for this report is based on 2,354 incidents where force was used in
2019 that was documented in the CRS.
There were occurrences where multiple reports resulting from the same incident were
submitted by each of the officers involved. These reports are counted as a single force
incident.
Incidents by District. District 1 reported the highest number of use of force incidents
(690) during this period. Furthermore, District 1 had the highest number of calls for
service in 2019 with 150,896. A summary of force incidents per 1,000 calls for service is
provided below.
Use of Force Incidents by District
Resident Population
2019*
Calls for
Service**
Use of Force
Incidents
District 1 82,900 150,896 690
District 2 116,900 35,568 173
District 3 166,800 64,810 174
District 4 136,000 49,381 159
District 5 140,900 79,861 321
District 6 26,200 42,886 308
District 7 158,600 67,313 276
District 8 154,700 77,442 253
Total 983,000 568,157 2,354
*Resident population estimates based on 2018 U.S. Census Honolulu County QuickFacts; (2019 data not available,
as of March 6, 2020).
**Source: Computer Aided Dispatch System. Incident types not included as they are generated by officers and/or
dispatchers: 000 (Follow up), 200W (WARN FAM OFF/NEG), 210 (DUI), 297 (WARRANT ARREST), 446
(EXTRADITION VIOLATION), 464 (INITIAL TRO), 535 (TRAFF ARREST/CIT), 653 (TRANSFER), 999 (OFCR IN
TROUBLE), C6 (INVESTIGATION), OT, OUT (OUT OF SERVICE), SA (SPECIAL ASSIGNMENT), SV (STALLED
VEHICLE), TS (TRAFFIC STOP), TZ (TOW ZONE)
4
Rev. 9-2020
TYPES OF INCIDENTS
Types of incidents. The following is a summary of the type of incidents where force was
used. Simple Assault cases accounted for the largest number of force incidents with
13.4% (316). Mental Health cases accounted for the second largest number of incidents
at 13.3% (312). Miscellaneous Public cases were the third largest figure, accounting for
6.7% (158) of all force incidents.
Incidents by hour of day. The following is a summary of use of force incidents by hour
of day and by day of week. The number of incidents was highest between 2400 and
0059 hours, accounting for 6.9% of force incidents. Incidents occurring on Mondays
(347) and Saturdays (351) accounted for almost 29.7% of all use of force incidents.
0
20
40
60
80
100
120
140
160
180
0600
to
0659
0700
to
0759
0800
to
0859
0900
to
0959
1000
to
1059
1100
to
1159
1200
to
1259
1300
to
1359
1400
to
1459
1500
to
1559
1600
to
1659
1700
to
1759
1800
to
1859
1900
to
1959
2000
to
2059
2100
to
2159
2200
to
2259
2300
to
2359
2400
to
0059
0100
to
0159
0200
to
0259
0300
to
0359
0400
to
0459
0500
to
0559
51
63
68
95
72
86 85
73
84
132
110
134
120
115 117
95
134 131
162
138
107
79
59
44
Hours of Day
NumberofIncidents
Use of Force Incidents by Hour of Day
Use of Force Incidents by Day of Week
Sun Mon Tue Wed Thu Fri Sat
Incidents 312 347 342 331 342 329 351
Percentage 13.3% 14.7% 14.5% 14.1% 14.5% 14.0% 14.9%
5
Rev. 9-2020
SUBJECTS OF FORCE INCIDENTS
Subject age. Of the 2,248 incidents where age can be determined, subject’s ages
ranged from 12 years old to 91 years old. The most frequent age group was subjects in
their twenties (26%) with 27 year olds being the most frequent subjects involved in force
incidents. The average age of all subjects was 34 years of age with the median age
being 47 years old. Juveniles (ages 12 to 17 years old were subjects in approximately
6.4% (150) of force incidents.
150
113
707
631
317
216
89
21
3 1
106
0
100
200
300
400
500
600
700
800
10-17 18-19 20-29 30-39 40-49 50-59 60-69 70-79 80-89 90-99 UNK
Incidents
Age
Incidents by Subject Age
Subject Gender. In the 2,298 reports where gender is reported, 1,790 subjects (78%)
were male and 508 (22%) were female. Juvenile males accounted for 7.16% of all male
subjects and juvenile females accounted for 6.63% of all female subjects.
Subject Employment. The number of subjects who were unemployed at the time of the
incident continues to be significant. Even with a large number of blank and unknown
entries on the Use of Force Report form in CRS, subjects known to be unemployed at the
time of the incident accounted for 650 (28%) of all subjects. This is a decrease from
2018, where unemployed subjects accounted for 37% of all incidents.
6
Rev. 9-2020
SUBJECTS ORIGIN AND RACE
Subject Origin and Race. The origin and race of subjects involved in force incidents
were more frequently Native Hawaiian and Other Pacific Islander (NHPI), accounting for
34.5% of incidents. This is an increase from 2018 where 31.1% of incidents involved
NHPI. NHPI are defined by the Census Bureau as persons having origins in any of the
original peoples of Hawaii, Guam, Samoa, or other Pacific Islands. It includes people
who indicate their race as “Native Hawaiian,” “Micronesian,” “Samoan,” or provide other
detailed Pacific Islander responses.
NHPI was followed by White subjects (23.1%) and Asian subjects (13.4%). When
compared with the U.S. Census estimates for Honolulu, there continues to be a
significant difference in the number of Use of Force subjects represented in the NHPI
category when compared to the general population.
Use of Force Incidents by Subject Origin and Race
Origin & Race Use of Force Incidents
Percent of UOF Incidents by
Race
WHITE 543 23.1%
BLACK 174 7.4%
AIAN
(American Indian, Alaska Native)
4 0.2%
ASIAN 316 13.4%
NHPI
(Native Hawaiian Pacific Islander)
811 34.5%
2 OR MORE RACES 256 10.9%
HISPANIC ORIGIN 51 2.2%
UNKNOWN 189 8.0%
OTHERS 10 0.4%
7
Rev. 9-2020
DRUGS AND/OR ALCOHOL USE BY SUBJECT
Drug or alcohol use. Fifty-eight percent of all incidents involved subjects that used or
were suspected of using drugs and/or alcohol. This is a slight decrease in the reported
number of incidents involving subjects that used or were suspected of using drugs and/or
alcohol in 2018 (63.1%). Male subjects had a higher (76.4%) frequency of drug and/or
alcohol use at the time of the incident than female subjects (22.3%).
Incidents where subject used or suspected of using drugs and/or alcohol
Gender Incidents
Percent of Incidents
by gender
Percent of all
incidents
Male 1,044 76.4% 44.4%
Female 305 22.3% 13.0%
Unk or Multiple Subjects 17 1.2% 0.7%
Total 1,366 100.0% 58.0%
8
Rev. 9-2020
SUBJECT LEVEL OF RESISTANCE
The amount of force used should be relative to the level of resistance (the actions taken
by a subject to evade an officer's attempts at control). The Honolulu Police Department’s
Use of Force Report form categorizes subject resistance into seven levels, listed here
from the lowest to highest: psychological intimidation, verbal noncompliance, passive
resistance, defensive resistance, active resistance, active aggression, and aggravated
active aggression.
In examining the highest level of resistance encountered for each incident, defensive
resistance was the most frequent level of resistance encountered in 818 (35%) incidents.
Active resistance was the second most frequent level with 445 (19%) and active
aggression was third with 217 (9%). No resistance was encountered in 396 (17%)
incidents. These 396 incidents represent the number of times officers unholstered their
weapons (e.g., firearm, conducted energy weapon) as a safety measure when they
responded to potentially dangerous situations, however, no subjects were encountered
nor weapons discharged. Though a weapon is not used on a subject, unholstering it is
considered a display, therefore, counted as a type of force.
None
Psychological
Intimidation
Verbal
Noncompliance
Passive
Resistance
Defensive
Resistance
Active
Resistance
Active
Aggression
Aggravated
Active
Aggression
Total
396 35 156 207 818 445 217 80 2,354
Subject’s Actions
Highest Level of Resistance Encountered by Officer
9
Rev. 9-2020
BREAKDOWN OF OPTIONS USED IN INCIDENTS REQUIRING FORCE
Summarized below is the highest level of force used by officers in each incident.
Physical Confrontation techniques were the most frequent force options used by officers,
which accounted for 46% of force applications. Deadly Force accounted for 21% of force
options used. The act of unholstering the firearm is included in the same category as
deadly force. See below for details.
Highest Level of Control Use During Incident
Type of Force Used by Officers
Deadly Force: Firearm Unholstered Versus Discharged at Subject
The deadly force figure above does not indicate that firearms were discharged at subjects
in 21% of force incidents. Officers often unholster their firearms as a safety measure
when responding to potentially dangerous situations such as a burglary in progress or
building search for a suspect. Included in the 21% are incidents when firearms are
unholstered but not discharged at a subject.
Though officers unholstered their firearms in 478 incidents, only in 9 situations did
officers resort to discharging their firearms at a subject.
10
Rev. 9-2020
Officer Response to Subject’s Actions
Officer Response
SubjectResistance
Verbal
Command
Physical
Contact
Chemical
Agent
Physical
Confrontation
Intermediate
Weapon
Deadly
Force
Total
Psychological
Intimidation
2 10 1 5 1 16 35
Verbal
Noncompliance
3 52 10 44 2 44 155
Passive
Resistance
3 127 3 59 1 13 206
Defensive
Resistance
2 314 18 454 3 27 818
Active
Resistance
2 96 16 307 6 17 444
Active
Aggression
2 31 20 153 4 7 217
Aggravated
Active
Aggression
1 3 1 29 3 43 80
Total 15 633 69 1,051 20 167 1,955
Duration of Resistance. Most of the resistance interactions lasted less than 30 seconds
(935) or 40%. Of the total, 69% of all incidents lasted a minute or less.
Duration of Resistance
< 30 Sec
30 Sec to 1
Min
1-2 Min 2-4 Min > 4 Min N/A
935 693 341 201 134 50
40% 29% 14% 9% 6% 2%
11
Rev. 9-2020
Officer Response in Relation to Subject Age and Gender. In 2019, Physical
Confrontation was most effective in incidents involving juveniles, the same was reported
for 2018. Consistent with 2018, the application of force options were applied consistently
over all age groups with Physical Confrontation techniques (45%) being the most
commonly used option. In 2018, it accounted for 44% of all force incidents.
Physical Confrontation technique was used more often with male (36%) than female
(10%) subjects. The Deadly Force option, which includes unholstering of a firearm, was
used in a higher percentage of incidents where male subjects (17%) were involved
versus female subjects (3%).
Subject injuries. In 2019, 74% of subjects in use of force incidents had no observable
injury and reported none when asked. Subjects who had no observable injury but
complained of injury accounted for 6% of subjects. There were 471 (21%) subjects who
sustained bodily injury, eleven subjects who sustained substantial bodily injury, and
seven subjects who sustained serious bodily injury. As reported by officer(s) at the time
of the incident, eight subjects died during incidents where force was used in response to
a call for service.
Officer injuries. In 2019, 95% of incidents occurred without an officer reporting injury.
Officers sustained bodily injuries in 108 (5%) incidents. Of the total use of force
incidents, one (less than 1%) resulted in substantial bodily injury. There were 17 (1%)
officers who complained of injuries without having visible signs of the injuries.
12
Rev. 9-2020
Use of Batons. In 2019, there were nine incidents reported in the Case Reporting
System (CRS) where a baton was used. Six incidents involved the display of the baton.
There were three baton strikes and no jabs. In 2018, there were eight incidents where
the baton was used. Five incidents involving displaying the baton, three incidents
involving baton strikes, and no jabs.
Use of Vascular Neck Restraint. There were eleven incidents where the vascular neck
restraint (VNR) was used as compared to nine incidents in 2018.
Use of Chemical Agents. There were 73 reports on the use of chemical agents. Of
those reported, all were oleoresin capsicum (OC) spray incidents. Of those incidents, 18
incidents were display only and 55 officers reported discharging the spray. In 2018, there
were 93 reports on the use of chemical agents, all OC spray incidents. Of those
incidents, 20 incidents were display only and 73 officers reported discharging the spray.
Conducted Electrical Weapon Use. In 2019, there were 58 incidents in which the
conducted electrical weapon (CEW) was used. Of those incidents, 40 were display and
18 were probe deployments. In comparison for 2018, the CRS reported 53 incidents
where the CEW was used. Of those, 42 were display only incidents, 11 probe
deployments, and no drive stuns.
Use of Firearms. Use or display of firearms, including handguns, shotguns, and rifles
were reported in 488 force incidents in 2019. Of the total number of cases involving
firearms, nine incidents involved a discharge of the weapon(s). In 2018, there were 407
incidents, including 11 incidents where firearms were discharged.
Tables on the following pages summarize some of the observations in this section.
13
Rev. 9-2020
Type of Control Used Within Each Force Option (based on highest level of force used)*
Verbal Command
Asking Setting Context Ordering Giving Options Confirmation Other Total
12 0 15 0 0 0 27
Physical Contact
Touch Escort Lt Pressure Pt Lt Joint Lock Other Total
446 110 13 35 55 659
Chemical Agent
Chemical Agent Displayed Only Chemical Agent Used Total
18 55 73
Physical Confrontation (Includes Conducted Energy Weapon)
Hand/Arm
Strike
Foot/Leg Strike Head Lock Joint Lock
Physical
Strength
Technique
Other Total
118 45 25 140 627 115 1,070
Display Only Probes Drive Stun
Conducted Energy Weapon
Total
40 18 0 58
Intermediate Weapon
Display Baton
Only
Baton Strike Baton Jab
Vascular Neck
Restraint
Stun Weapon
(less-lethal, impact,
specialty)
Other Total
6 3 0 11 0 0 20
Deadly Force
Displayed/Unholstered Weapon Fired Weapon Other Total
478 9 1 488
*Note: Information was retrieved from CRS and filtered based on (i) force start dates between 1/1/2019 to 12/31/2019, and (ii) submitted as approved reports. Confirmed with PSO.
14
Rev. 9-2020
Type of Force Used by Subject Age
<18 18-29 30-39 40-49 50-59 60+
Not
Specified Total
None 1 0 3 2 3 0 8 17
Verbal Command 1 11 8 5 1 1 0 27
Physical Contact 40 236 179 94 52 39 19 659
Chemical Agent 4 25 18 7 6 3 10 73
Physical Confrontation 79 375 299 134 108 41 34 1,070
Intermediate Weapon 1 8 6 3 0 2 0 20
Deadly Force 25 165 116 72 46 29 35 488
Total 151 820 629 317 216 115 106 2,354
Type of Force Used by Subject Gender
Subject
Gender
None
Verbal
Command
Physical
Contact
Chemical
Agent
Physical
Confrontation
Intermediate
Weapon
Deadly
Force
Total
Male
10
(1%)
21
(1%)
451
(20%)
55
(4%)
838
(36%)
17
(1%)
398
(17%)
1,790
Female
1
(1%)
6
(1%)
202
(9%)
11
(1%)
218
(10%)
3
(1%)
67
(3%)
508
Not
Specified
6
(1%)
0
(0%)
6
(1%)
7
(1%)
14
(1%)
0
(0%)
23
(1%)
56
Total
17
(0.7%)
27
(1.1%)
659
(28.0%)
73
(3.1%)
1,070
(45.5%)
20
(0.8%)
488
(20.7%)
2,354
15
Rev. 9-2020
Subject Injuries by Type of Force Used
Type of Force None
Complaint
of Injury
Bodily
Injury
Substantial
Bodily
Injury
Serious
Bodily
Injury
Death Total
None 16 1 0 0 0 0 17
Verbal Command 25 0 2 0 0 0 27
Physical Contact 516 39 100 1 0 3 661
Chemical Agent 41 7 25 0 0 0 73
Physical Confrontation 662 79 317 8 4 0 1,070
Intermediate Weapon 10 4 6 0 0 0 20
Deadly Force 447 10 21 2 3 5 488
Total 1,717 140 471 11 7 8 2,354
% of Force Used 73.0% 5.9% 20.0% 0.5% 0.3% 0.3%
*Note: Information was retrieved from CRS and filtered based on (i) force start dates between 1/1/2019 to
12/31/2019, and (ii) submitted as approved reports.
Officer Injuries by Type of Force Used
Type of Force None
Complaint
of Injury
Bodily
Injury
Substantial
Bodily
Injury
Serious
Bodily
Injury
Death Total
None 16 0 1 0 0 0 17
Verbal
Command
27 0 0 0 0 0 27
Physical
Contact
639 9 10 0 1 0 659
Chemical Agent 71 0 2 0 0 0 73
Physical
Confrontation
976 8 85 1 0 0 1,070
Intermediate
Weapon
18 0 2 0 0 0 20
Deadly Force 480 0 8 0 0 0 488
Total 2,227 17 108 1 1 0 2,354
% of Force
Used
94.6% 0.7% 4.5% 0.1% 0.1% 0%
*Note: Information was retrieved from CRS and filtered based on (i) force start dates between 1/1/2019 to
12/31/2019, and (ii) submitted as approved reports.
16
Rev. 9-2020
RECOMMNDATIONS
The following recommendations are based on the call for police reform facing law
enforcement agencies across the nation. Although Hawaii has a more diversified
demographic make-up in regards to ethnicities, there still may be a need to track officers’
use of force to identify issues of implicit or explicit bias. Also, a review of the Justice in
Policing Act draft identifies disproportionate minority contact as one of the key issues in
developing their proposed reporting mandates. The purpose of these recommendations
are two-fold: to identify employees who may be bias in their application of use of force
and to anticipate reporting mandates to maintain federal funding requirements.
Toward these ends, the department will explore the feasibility of implementing the
following:
• Ensure that the source material data contain specific fields that can capture and
provide a breakdown of the number of incidents by the race, age, and gender of
the officers involved in relation to the subject on whom force is used.
• Ensure that the source material data contain data to capture incidents when
canines are deployed as a force response. This will also be included in the update
of the policy on Use of Force.
• Implementation of IAPro Blue Team upon completion of the new Report
Management System (RMS). The Blue Team feature will be able to extract and
compile Use of Force data and compose an early intervention dashboard to be
used in conjunction with the Employee Early Recognition System policy.
• Integration of officer race information into IAPro from a human resources
database. This will give the system the ability to provide racial comparisons
between officers and subjects. The information may identify patterns or trends in
an officer’s use of force. This process will be crucial to supporting the ability to
provide officers’ demographics in upcoming reports.
17
Rev. 9-2020
The following recommendation is being made to help improve reporting accuracies and
streamline data collecting practices. It has been determined that reporting discrepancies
between statistics obtained from the Professional Standards Office (PSO) and the RMS
(via the Case Report System) were due to each division maintaining their own separate
databases.
• Implementation of IAPro Blue Team upon completion of the RMS. The data
collection (documenting) of use of force into the database will be at the user-level.
Regardless of purpose, the extracting of data will be from the original source. The
PSO and ITD will need to work with IAPro in the development of the reporting
format to ensure all data they need for their specific purpose is captured, including
statistics for mandated reporting.
The following recommendations are to include data on other force options not previously
documented and to further define the types of Deadly Force used. The statistics
contained in the Annual Use of Force Report severely misrepresents Deadly Force
reporting as it includes unholstering of a firearm even when a subject is not encountered
(i.e.: state of readiness, building searches, etc.).
• Delineate circumstances where a firearm was used into specific categories (i.e.:
discharge of a firearm, brandish of a firearm, other technique, etc.). The Deadly
Force categories would be represented in the Annual Use of Force Report in a
table or pie chart.
• Revise the Use of Force report form and data collection to distinguish incidents
that do not involve the presence of a subject or the weapon being used to compel
a subject. As an example, an officer performing a building search, but no subject
is encountered.
• The PSO investigates all reports of officer involved shootings, therefore, the
accuracy of firearm discharges in the Annual Use of Force Report shall be
reconciled with the PSO prior to publishing. This would ensure that the reporting of
statistics include all officer-involved shootings.
• Capturing data and reporting on the use of the Vascular Neck Restraint (VNR) as
a deadly force option. An update to department’s policy on Use of Force will reflect
this reporting change.
• Documenting and reporting the deployment of a canine as a force option.
18
Rev. 9-2020
The following recommendations are intended to improve accuracy and quality of data that
is documented on the Use of Force form.
• Officers and supervisors should receive more training on how to fill out the Use of
Force form as well as why properly completing the form is important (e.g.,
improving training, policy, and responsiveness to areas of corrections).
• Measures or procedures to improve the accountability of supervisors and/or others
who are directly responsible for reviewing and ensuring Use of Force forms are
properly and thoroughly completed.

More Related Content

Similar to HPD Use of Force Report Summary

Draft Policy on Injury Violence and Disability Nepal
Draft Policy on Injury Violence and Disability NepalDraft Policy on Injury Violence and Disability Nepal
Draft Policy on Injury Violence and Disability NepalPranab Dahal
 
HTAU security incident & casualties report Nov2015 finalb
HTAU security incident & casualties report Nov2015 finalbHTAU security incident & casualties report Nov2015 finalb
HTAU security incident & casualties report Nov2015 finalbRandy Salm
 
ALBAY EMERGENCY RESPONSE AND REPORT TOOL (ALERRT)
ALBAY EMERGENCY RESPONSE AND REPORT TOOL (ALERRT)ALBAY EMERGENCY RESPONSE AND REPORT TOOL (ALERRT)
ALBAY EMERGENCY RESPONSE AND REPORT TOOL (ALERRT)csandit
 
FOSDA ViolentIncidentsMonitoring_qtr1-1.pdf
FOSDA ViolentIncidentsMonitoring_qtr1-1.pdfFOSDA ViolentIncidentsMonitoring_qtr1-1.pdf
FOSDA ViolentIncidentsMonitoring_qtr1-1.pdfJeorgeWilsonKingson1
 
P7_P8_P9_M4_M5_D3
P7_P8_P9_M4_M5_D3P7_P8_P9_M4_M5_D3
P7_P8_P9_M4_M5_D3bambers11
 
Victims of Crime Act Victim Compensation Formula Grant Program
Victims of Crime Act Victim Compensation Formula Grant ProgramVictims of Crime Act Victim Compensation Formula Grant Program
Victims of Crime Act Victim Compensation Formula Grant Programsachinsoni117
 
Victims of Crime Act Victim Compensation Formula Grant Program
Victims of Crime Act Victim Compensation Formula Grant ProgramVictims of Crime Act Victim Compensation Formula Grant Program
Victims of Crime Act Victim Compensation Formula Grant Programsachinsoni117
 
Policy Brief on Print Media Analysis of GBV Cases
Policy Brief on Print Media Analysis of GBV Cases  Policy Brief on Print Media Analysis of GBV Cases
Policy Brief on Print Media Analysis of GBV Cases YouthHubAfrica
 
Print Media Analysis of GBV cases in Nigeria (April - September 2021)
Print Media Analysis of GBV cases in Nigeria (April - September 2021)Print Media Analysis of GBV cases in Nigeria (April - September 2021)
Print Media Analysis of GBV cases in Nigeria (April - September 2021)YouthHubAfrica
 
FBI report compared to crimes in Sweden
FBI report compared to crimes in SwedenFBI report compared to crimes in Sweden
FBI report compared to crimes in SwedenADVICEDERNBACK
 
Internship Report Sami
Internship Report SamiInternship Report Sami
Internship Report SamiSami Hasni
 
Road Accident Analysis and Prevention in Nigeria: Experimental and Numerical ...
Road Accident Analysis and Prevention in Nigeria: Experimental and Numerical ...Road Accident Analysis and Prevention in Nigeria: Experimental and Numerical ...
Road Accident Analysis and Prevention in Nigeria: Experimental and Numerical ...IJASRD Journal
 
A Mobile Based Application for Journey Safety
A Mobile Based Application for Journey SafetyA Mobile Based Application for Journey Safety
A Mobile Based Application for Journey SafetyIOSRjournaljce
 
Capstone power point notes
Capstone power point notesCapstone power point notes
Capstone power point notesHarold Sowards
 
Knowledge, Attitude and Practice of Unintentional Injuries Among Old People i...
Knowledge, Attitude and Practice of Unintentional Injuries Among Old People i...Knowledge, Attitude and Practice of Unintentional Injuries Among Old People i...
Knowledge, Attitude and Practice of Unintentional Injuries Among Old People i...Scientific Review SR
 

Similar to HPD Use of Force Report Summary (20)

Draft Policy on Injury Violence and Disability Nepal
Draft Policy on Injury Violence and Disability NepalDraft Policy on Injury Violence and Disability Nepal
Draft Policy on Injury Violence and Disability Nepal
 
Victims of Crime Survey, 2018
Victims of Crime Survey, 2018Victims of Crime Survey, 2018
Victims of Crime Survey, 2018
 
HTAU security incident & casualties report Nov2015 finalb
HTAU security incident & casualties report Nov2015 finalbHTAU security incident & casualties report Nov2015 finalb
HTAU security incident & casualties report Nov2015 finalb
 
ALBAY EMERGENCY RESPONSE AND REPORT TOOL (ALERRT)
ALBAY EMERGENCY RESPONSE AND REPORT TOOL (ALERRT)ALBAY EMERGENCY RESPONSE AND REPORT TOOL (ALERRT)
ALBAY EMERGENCY RESPONSE AND REPORT TOOL (ALERRT)
 
FOSDA ViolentIncidentsMonitoring_qtr1-1.pdf
FOSDA ViolentIncidentsMonitoring_qtr1-1.pdfFOSDA ViolentIncidentsMonitoring_qtr1-1.pdf
FOSDA ViolentIncidentsMonitoring_qtr1-1.pdf
 
GSS
GSSGSS
GSS
 
Hssh0910
Hssh0910Hssh0910
Hssh0910
 
811449
811449811449
811449
 
P7_P8_P9_M4_M5_D3
P7_P8_P9_M4_M5_D3P7_P8_P9_M4_M5_D3
P7_P8_P9_M4_M5_D3
 
Victims of Crime Act Victim Compensation Formula Grant Program
Victims of Crime Act Victim Compensation Formula Grant ProgramVictims of Crime Act Victim Compensation Formula Grant Program
Victims of Crime Act Victim Compensation Formula Grant Program
 
Victims of Crime Act Victim Compensation Formula Grant Program
Victims of Crime Act Victim Compensation Formula Grant ProgramVictims of Crime Act Victim Compensation Formula Grant Program
Victims of Crime Act Victim Compensation Formula Grant Program
 
Policy Brief on Print Media Analysis of GBV Cases
Policy Brief on Print Media Analysis of GBV Cases  Policy Brief on Print Media Analysis of GBV Cases
Policy Brief on Print Media Analysis of GBV Cases
 
Print Media Analysis of GBV cases in Nigeria (April - September 2021)
Print Media Analysis of GBV cases in Nigeria (April - September 2021)Print Media Analysis of GBV cases in Nigeria (April - September 2021)
Print Media Analysis of GBV cases in Nigeria (April - September 2021)
 
FBI report compared to crimes in Sweden
FBI report compared to crimes in SwedenFBI report compared to crimes in Sweden
FBI report compared to crimes in Sweden
 
Internship Report Sami
Internship Report SamiInternship Report Sami
Internship Report Sami
 
Road Accident Analysis and Prevention in Nigeria: Experimental and Numerical ...
Road Accident Analysis and Prevention in Nigeria: Experimental and Numerical ...Road Accident Analysis and Prevention in Nigeria: Experimental and Numerical ...
Road Accident Analysis and Prevention in Nigeria: Experimental and Numerical ...
 
Business Activities and Security Situation in Kogi State: An Evaluation
Business Activities and Security Situation in Kogi State: An EvaluationBusiness Activities and Security Situation in Kogi State: An Evaluation
Business Activities and Security Situation in Kogi State: An Evaluation
 
A Mobile Based Application for Journey Safety
A Mobile Based Application for Journey SafetyA Mobile Based Application for Journey Safety
A Mobile Based Application for Journey Safety
 
Capstone power point notes
Capstone power point notesCapstone power point notes
Capstone power point notes
 
Knowledge, Attitude and Practice of Unintentional Injuries Among Old People i...
Knowledge, Attitude and Practice of Unintentional Injuries Among Old People i...Knowledge, Attitude and Practice of Unintentional Injuries Among Old People i...
Knowledge, Attitude and Practice of Unintentional Injuries Among Old People i...
 

More from Honolulu Civil Beat

Gov. David Ige response to U.S. Rep. Anna Eshoo
Gov. David Ige response to U.S. Rep. Anna EshooGov. David Ige response to U.S. Rep. Anna Eshoo
Gov. David Ige response to U.S. Rep. Anna EshooHonolulu Civil Beat
 
Audit of the Department of the Honolulu Prosecuting Attorney’s Policies, Proc...
Audit of the Department of the Honolulu Prosecuting Attorney’s Policies, Proc...Audit of the Department of the Honolulu Prosecuting Attorney’s Policies, Proc...
Audit of the Department of the Honolulu Prosecuting Attorney’s Policies, Proc...Honolulu Civil Beat
 
Audit of the Honolulu Police Department’s Policies, Procedures, and Controls
Audit of the Honolulu Police Department’s Policies, Procedures, and ControlsAudit of the Honolulu Police Department’s Policies, Procedures, and Controls
Audit of the Honolulu Police Department’s Policies, Procedures, and ControlsHonolulu Civil Beat
 
Office of Health Equity Goals Draft 10
Office of Health Equity Goals Draft 10Office of Health Equity Goals Draft 10
Office of Health Equity Goals Draft 10Honolulu Civil Beat
 
ACLU Letter to HPD regarding racial profiling
ACLU Letter to HPD regarding racial profilingACLU Letter to HPD regarding racial profiling
ACLU Letter to HPD regarding racial profilingHonolulu Civil Beat
 
ACLU Letter to HPD regarding racial profiling
ACLU Letter to HPD regarding racial profilingACLU Letter to HPD regarding racial profiling
ACLU Letter to HPD regarding racial profilingHonolulu Civil Beat
 
Guam Governor's Letter to Pence
Guam Governor's Letter to Pence Guam Governor's Letter to Pence
Guam Governor's Letter to Pence Honolulu Civil Beat
 
List Of Pro Bono Legal Service Providers
List Of Pro Bono Legal Service ProvidersList Of Pro Bono Legal Service Providers
List Of Pro Bono Legal Service ProvidersHonolulu Civil Beat
 
Arbitration Hearing Transcript December 2018
Arbitration Hearing Transcript December 2018Arbitration Hearing Transcript December 2018
Arbitration Hearing Transcript December 2018Honolulu Civil Beat
 

More from Honolulu Civil Beat (20)

Gov. David Ige response to U.S. Rep. Anna Eshoo
Gov. David Ige response to U.S. Rep. Anna EshooGov. David Ige response to U.S. Rep. Anna Eshoo
Gov. David Ige response to U.S. Rep. Anna Eshoo
 
Audit of the Department of the Honolulu Prosecuting Attorney’s Policies, Proc...
Audit of the Department of the Honolulu Prosecuting Attorney’s Policies, Proc...Audit of the Department of the Honolulu Prosecuting Attorney’s Policies, Proc...
Audit of the Department of the Honolulu Prosecuting Attorney’s Policies, Proc...
 
Audit of the Honolulu Police Department’s Policies, Procedures, and Controls
Audit of the Honolulu Police Department’s Policies, Procedures, and ControlsAudit of the Honolulu Police Department’s Policies, Procedures, and Controls
Audit of the Honolulu Police Department’s Policies, Procedures, and Controls
 
Office of Health Equity Goals Draft 10
Office of Health Equity Goals Draft 10Office of Health Equity Goals Draft 10
Office of Health Equity Goals Draft 10
 
NHPI COVID-19 Statement
NHPI COVID-19 StatementNHPI COVID-19 Statement
NHPI COVID-19 Statement
 
DLIR Response Language Access
DLIR Response Language AccessDLIR Response Language Access
DLIR Response Language Access
 
Language Access Letter To DLIR
Language Access Letter To DLIRLanguage Access Letter To DLIR
Language Access Letter To DLIR
 
ACLU Letter to HPD regarding racial profiling
ACLU Letter to HPD regarding racial profilingACLU Letter to HPD regarding racial profiling
ACLU Letter to HPD regarding racial profiling
 
ACLU Letter to HPD regarding racial profiling
ACLU Letter to HPD regarding racial profilingACLU Letter to HPD regarding racial profiling
ACLU Letter to HPD regarding racial profiling
 
Jane Doe v. Rehab Hospital
Jane Doe v. Rehab HospitalJane Doe v. Rehab Hospital
Jane Doe v. Rehab Hospital
 
Coronavirus HPHA
Coronavirus HPHA Coronavirus HPHA
Coronavirus HPHA
 
OHA Data Request
OHA Data RequestOHA Data Request
OHA Data Request
 
Letter from Palau to Guam
Letter from Palau to GuamLetter from Palau to Guam
Letter from Palau to Guam
 
Guam Governor's Letter to Pence
Guam Governor's Letter to Pence Guam Governor's Letter to Pence
Guam Governor's Letter to Pence
 
OHA Analysis by Akina
OHA Analysis by AkinaOHA Analysis by Akina
OHA Analysis by Akina
 
Case COFA Letter
Case COFA LetterCase COFA Letter
Case COFA Letter
 
List Of Pro Bono Legal Service Providers
List Of Pro Bono Legal Service ProvidersList Of Pro Bono Legal Service Providers
List Of Pro Bono Legal Service Providers
 
Arbitration Hearing Transcript December 2018
Arbitration Hearing Transcript December 2018Arbitration Hearing Transcript December 2018
Arbitration Hearing Transcript December 2018
 
Caldwell Press Release
Caldwell Press ReleaseCaldwell Press Release
Caldwell Press Release
 
Letter to Caldwell
Letter to Caldwell Letter to Caldwell
Letter to Caldwell
 

Recently uploaded

Opportunities, challenges, and power of media and information
Opportunities, challenges, and power of media and informationOpportunities, challenges, and power of media and information
Opportunities, challenges, and power of media and informationReyMonsales
 
Referendum Party 2024 Election Manifesto
Referendum Party 2024 Election ManifestoReferendum Party 2024 Election Manifesto
Referendum Party 2024 Election ManifestoSABC News
 
Global Terrorism and its types and prevention ppt.
Global Terrorism and its types and prevention ppt.Global Terrorism and its types and prevention ppt.
Global Terrorism and its types and prevention ppt.NaveedKhaskheli1
 
Rohan Jaitley: Central Gov't Standing Counsel for Justice
Rohan Jaitley: Central Gov't Standing Counsel for JusticeRohan Jaitley: Central Gov't Standing Counsel for Justice
Rohan Jaitley: Central Gov't Standing Counsel for JusticeAbdulGhani778830
 
Top 10 Wealthiest People In The World.pdf
Top 10 Wealthiest People In The World.pdfTop 10 Wealthiest People In The World.pdf
Top 10 Wealthiest People In The World.pdfauroraaudrey4826
 
57 Bidens Annihilation Nation Policy.pdf
57 Bidens Annihilation Nation Policy.pdf57 Bidens Annihilation Nation Policy.pdf
57 Bidens Annihilation Nation Policy.pdfGerald Furnkranz
 
Manipur-Book-Final-2-compressed.pdfsal'rpk
Manipur-Book-Final-2-compressed.pdfsal'rpkManipur-Book-Final-2-compressed.pdfsal'rpk
Manipur-Book-Final-2-compressed.pdfsal'rpkbhavenpr
 
VIP Girls Available Call or WhatsApp 9711199012
VIP Girls Available Call or WhatsApp 9711199012VIP Girls Available Call or WhatsApp 9711199012
VIP Girls Available Call or WhatsApp 9711199012ankitnayak356677
 
Brief biography of Julius Robert Oppenheimer
Brief biography of Julius Robert OppenheimerBrief biography of Julius Robert Oppenheimer
Brief biography of Julius Robert OppenheimerOmarCabrera39
 
complaint-ECI-PM-media-1-Chandru.pdfra;;prfk
complaint-ECI-PM-media-1-Chandru.pdfra;;prfkcomplaint-ECI-PM-media-1-Chandru.pdfra;;prfk
complaint-ECI-PM-media-1-Chandru.pdfra;;prfkbhavenpr
 
AP Election Survey 2024: TDP-Janasena-BJP Alliance Set To Sweep Victory
AP Election Survey 2024: TDP-Janasena-BJP Alliance Set To Sweep VictoryAP Election Survey 2024: TDP-Janasena-BJP Alliance Set To Sweep Victory
AP Election Survey 2024: TDP-Janasena-BJP Alliance Set To Sweep Victoryanjanibaddipudi1
 
Quiz for Heritage Indian including all the rounds
Quiz for Heritage Indian including all the roundsQuiz for Heritage Indian including all the rounds
Quiz for Heritage Indian including all the roundsnaxymaxyy
 
IndiaWest: Your Trusted Source for Today's Global News
IndiaWest: Your Trusted Source for Today's Global NewsIndiaWest: Your Trusted Source for Today's Global News
IndiaWest: Your Trusted Source for Today's Global NewsIndiaWest2
 

Recently uploaded (13)

Opportunities, challenges, and power of media and information
Opportunities, challenges, and power of media and informationOpportunities, challenges, and power of media and information
Opportunities, challenges, and power of media and information
 
Referendum Party 2024 Election Manifesto
Referendum Party 2024 Election ManifestoReferendum Party 2024 Election Manifesto
Referendum Party 2024 Election Manifesto
 
Global Terrorism and its types and prevention ppt.
Global Terrorism and its types and prevention ppt.Global Terrorism and its types and prevention ppt.
Global Terrorism and its types and prevention ppt.
 
Rohan Jaitley: Central Gov't Standing Counsel for Justice
Rohan Jaitley: Central Gov't Standing Counsel for JusticeRohan Jaitley: Central Gov't Standing Counsel for Justice
Rohan Jaitley: Central Gov't Standing Counsel for Justice
 
Top 10 Wealthiest People In The World.pdf
Top 10 Wealthiest People In The World.pdfTop 10 Wealthiest People In The World.pdf
Top 10 Wealthiest People In The World.pdf
 
57 Bidens Annihilation Nation Policy.pdf
57 Bidens Annihilation Nation Policy.pdf57 Bidens Annihilation Nation Policy.pdf
57 Bidens Annihilation Nation Policy.pdf
 
Manipur-Book-Final-2-compressed.pdfsal'rpk
Manipur-Book-Final-2-compressed.pdfsal'rpkManipur-Book-Final-2-compressed.pdfsal'rpk
Manipur-Book-Final-2-compressed.pdfsal'rpk
 
VIP Girls Available Call or WhatsApp 9711199012
VIP Girls Available Call or WhatsApp 9711199012VIP Girls Available Call or WhatsApp 9711199012
VIP Girls Available Call or WhatsApp 9711199012
 
Brief biography of Julius Robert Oppenheimer
Brief biography of Julius Robert OppenheimerBrief biography of Julius Robert Oppenheimer
Brief biography of Julius Robert Oppenheimer
 
complaint-ECI-PM-media-1-Chandru.pdfra;;prfk
complaint-ECI-PM-media-1-Chandru.pdfra;;prfkcomplaint-ECI-PM-media-1-Chandru.pdfra;;prfk
complaint-ECI-PM-media-1-Chandru.pdfra;;prfk
 
AP Election Survey 2024: TDP-Janasena-BJP Alliance Set To Sweep Victory
AP Election Survey 2024: TDP-Janasena-BJP Alliance Set To Sweep VictoryAP Election Survey 2024: TDP-Janasena-BJP Alliance Set To Sweep Victory
AP Election Survey 2024: TDP-Janasena-BJP Alliance Set To Sweep Victory
 
Quiz for Heritage Indian including all the rounds
Quiz for Heritage Indian including all the roundsQuiz for Heritage Indian including all the rounds
Quiz for Heritage Indian including all the rounds
 
IndiaWest: Your Trusted Source for Today's Global News
IndiaWest: Your Trusted Source for Today's Global NewsIndiaWest: Your Trusted Source for Today's Global News
IndiaWest: Your Trusted Source for Today's Global News
 

HPD Use of Force Report Summary

  • 1. 1 Rev. 9-2020 EXECUTIVE SUMMARY: USE OF FORCE REPORT This report provides a summary of force incidents by Honolulu Police Department (HPD) officers for 2019. Use of force information officers entered into the department’s Case Reporting System (CRS) is the data source for this report. The key findings are summarized below: • During the year, 2,354 Use of Force incidents were reported and submitted by officers. This is an increase from 2018 when there were 2,070 incidents reported and submitted by officers. • Only a small percentage of police interactions with the public involved the use of force. The department averaged 4.14 force incidents per 1,000 calls for service. This is an increase from 2018 when the department averaged 3.67 force incidents per 1,000 calls for service. • The most common types of incidents that required officers to use force were Simple Assault 13.4% (316), Mental Health, also known as MH-1 13.2% (312), and Miscellaneous Public 6.7% (158) cases. This is similar to the 2018 findings. • During the year, most of the force incidents occurred on Mondays and Saturdays. The time of the day when most incidents occurred was between 2400 hours and 0059 hours. • In 2019, the average age of subjects was 34 years old. The average was the same for 2018. Males accounted for 78% of subjects involved in force incidents. Juvenile subjects ranged in age from 12 to 17 years old and were involved in 6.4% of incidents. Unemployed subjects accounted for 28% of all subjects. At 34.5%, the greatest number of subjects in force incidents were Native Hawaiian Pacific Islanders. Subjects suspected of drug and/or alcohol use at the time of the incident accounted for 58% of all force incidents. This is a decrease from 2018, where 63.1% of all force incidents involved subjects where drug and/or alcohol use was suspected. • In 2019, Physical Confrontation techniques were the most frequent force option used by officers and accounted for 53% of force applications, as compared to 51% in 2018. • There were five subject deaths involving firearms discharged by officers. • There were no subject injuries in 74% of the incidents, as compared to 73% in 2018. • In 2019, there were no officer injuries in 95% of the incidents, as compared to 94% in the previous year.
  • 2. 2 Rev. 9-2020 GENERAL INFORMATION The Honolulu Police Department’s jurisdiction is the City and County of Honolulu (island of Oahu). The land area is approximately 600 square miles with an estimated resident population of 980,080. The department geographically divides the island into eight police districts. At the end of 2019, the actual personnel strength of the department was 2,292 of which 1,825 were police officers. Calls for Service. In 2019, the department recorded 568,157 calls for service that resulted in a case report. Calls for service are incidents that require the presence of officers and/or come to the attention of officers via the communications center (9-1-1 calls) or are field-initiated. The following provides a general summary of use of force incidents by district.
  • 3. 3 Rev. 9-2020 USE OF FORCE INCIDENTS Data collection. When any use of force beyond routine handcuffing is used, a use of force report is completed and submitted by the officer who used force, whether injuries occurred or not. Data for this report is based on 2,354 incidents where force was used in 2019 that was documented in the CRS. There were occurrences where multiple reports resulting from the same incident were submitted by each of the officers involved. These reports are counted as a single force incident. Incidents by District. District 1 reported the highest number of use of force incidents (690) during this period. Furthermore, District 1 had the highest number of calls for service in 2019 with 150,896. A summary of force incidents per 1,000 calls for service is provided below. Use of Force Incidents by District Resident Population 2019* Calls for Service** Use of Force Incidents District 1 82,900 150,896 690 District 2 116,900 35,568 173 District 3 166,800 64,810 174 District 4 136,000 49,381 159 District 5 140,900 79,861 321 District 6 26,200 42,886 308 District 7 158,600 67,313 276 District 8 154,700 77,442 253 Total 983,000 568,157 2,354 *Resident population estimates based on 2018 U.S. Census Honolulu County QuickFacts; (2019 data not available, as of March 6, 2020). **Source: Computer Aided Dispatch System. Incident types not included as they are generated by officers and/or dispatchers: 000 (Follow up), 200W (WARN FAM OFF/NEG), 210 (DUI), 297 (WARRANT ARREST), 446 (EXTRADITION VIOLATION), 464 (INITIAL TRO), 535 (TRAFF ARREST/CIT), 653 (TRANSFER), 999 (OFCR IN TROUBLE), C6 (INVESTIGATION), OT, OUT (OUT OF SERVICE), SA (SPECIAL ASSIGNMENT), SV (STALLED VEHICLE), TS (TRAFFIC STOP), TZ (TOW ZONE)
  • 4. 4 Rev. 9-2020 TYPES OF INCIDENTS Types of incidents. The following is a summary of the type of incidents where force was used. Simple Assault cases accounted for the largest number of force incidents with 13.4% (316). Mental Health cases accounted for the second largest number of incidents at 13.3% (312). Miscellaneous Public cases were the third largest figure, accounting for 6.7% (158) of all force incidents. Incidents by hour of day. The following is a summary of use of force incidents by hour of day and by day of week. The number of incidents was highest between 2400 and 0059 hours, accounting for 6.9% of force incidents. Incidents occurring on Mondays (347) and Saturdays (351) accounted for almost 29.7% of all use of force incidents. 0 20 40 60 80 100 120 140 160 180 0600 to 0659 0700 to 0759 0800 to 0859 0900 to 0959 1000 to 1059 1100 to 1159 1200 to 1259 1300 to 1359 1400 to 1459 1500 to 1559 1600 to 1659 1700 to 1759 1800 to 1859 1900 to 1959 2000 to 2059 2100 to 2159 2200 to 2259 2300 to 2359 2400 to 0059 0100 to 0159 0200 to 0259 0300 to 0359 0400 to 0459 0500 to 0559 51 63 68 95 72 86 85 73 84 132 110 134 120 115 117 95 134 131 162 138 107 79 59 44 Hours of Day NumberofIncidents Use of Force Incidents by Hour of Day Use of Force Incidents by Day of Week Sun Mon Tue Wed Thu Fri Sat Incidents 312 347 342 331 342 329 351 Percentage 13.3% 14.7% 14.5% 14.1% 14.5% 14.0% 14.9%
  • 5. 5 Rev. 9-2020 SUBJECTS OF FORCE INCIDENTS Subject age. Of the 2,248 incidents where age can be determined, subject’s ages ranged from 12 years old to 91 years old. The most frequent age group was subjects in their twenties (26%) with 27 year olds being the most frequent subjects involved in force incidents. The average age of all subjects was 34 years of age with the median age being 47 years old. Juveniles (ages 12 to 17 years old were subjects in approximately 6.4% (150) of force incidents. 150 113 707 631 317 216 89 21 3 1 106 0 100 200 300 400 500 600 700 800 10-17 18-19 20-29 30-39 40-49 50-59 60-69 70-79 80-89 90-99 UNK Incidents Age Incidents by Subject Age Subject Gender. In the 2,298 reports where gender is reported, 1,790 subjects (78%) were male and 508 (22%) were female. Juvenile males accounted for 7.16% of all male subjects and juvenile females accounted for 6.63% of all female subjects. Subject Employment. The number of subjects who were unemployed at the time of the incident continues to be significant. Even with a large number of blank and unknown entries on the Use of Force Report form in CRS, subjects known to be unemployed at the time of the incident accounted for 650 (28%) of all subjects. This is a decrease from 2018, where unemployed subjects accounted for 37% of all incidents.
  • 6. 6 Rev. 9-2020 SUBJECTS ORIGIN AND RACE Subject Origin and Race. The origin and race of subjects involved in force incidents were more frequently Native Hawaiian and Other Pacific Islander (NHPI), accounting for 34.5% of incidents. This is an increase from 2018 where 31.1% of incidents involved NHPI. NHPI are defined by the Census Bureau as persons having origins in any of the original peoples of Hawaii, Guam, Samoa, or other Pacific Islands. It includes people who indicate their race as “Native Hawaiian,” “Micronesian,” “Samoan,” or provide other detailed Pacific Islander responses. NHPI was followed by White subjects (23.1%) and Asian subjects (13.4%). When compared with the U.S. Census estimates for Honolulu, there continues to be a significant difference in the number of Use of Force subjects represented in the NHPI category when compared to the general population. Use of Force Incidents by Subject Origin and Race Origin & Race Use of Force Incidents Percent of UOF Incidents by Race WHITE 543 23.1% BLACK 174 7.4% AIAN (American Indian, Alaska Native) 4 0.2% ASIAN 316 13.4% NHPI (Native Hawaiian Pacific Islander) 811 34.5% 2 OR MORE RACES 256 10.9% HISPANIC ORIGIN 51 2.2% UNKNOWN 189 8.0% OTHERS 10 0.4%
  • 7. 7 Rev. 9-2020 DRUGS AND/OR ALCOHOL USE BY SUBJECT Drug or alcohol use. Fifty-eight percent of all incidents involved subjects that used or were suspected of using drugs and/or alcohol. This is a slight decrease in the reported number of incidents involving subjects that used or were suspected of using drugs and/or alcohol in 2018 (63.1%). Male subjects had a higher (76.4%) frequency of drug and/or alcohol use at the time of the incident than female subjects (22.3%). Incidents where subject used or suspected of using drugs and/or alcohol Gender Incidents Percent of Incidents by gender Percent of all incidents Male 1,044 76.4% 44.4% Female 305 22.3% 13.0% Unk or Multiple Subjects 17 1.2% 0.7% Total 1,366 100.0% 58.0%
  • 8. 8 Rev. 9-2020 SUBJECT LEVEL OF RESISTANCE The amount of force used should be relative to the level of resistance (the actions taken by a subject to evade an officer's attempts at control). The Honolulu Police Department’s Use of Force Report form categorizes subject resistance into seven levels, listed here from the lowest to highest: psychological intimidation, verbal noncompliance, passive resistance, defensive resistance, active resistance, active aggression, and aggravated active aggression. In examining the highest level of resistance encountered for each incident, defensive resistance was the most frequent level of resistance encountered in 818 (35%) incidents. Active resistance was the second most frequent level with 445 (19%) and active aggression was third with 217 (9%). No resistance was encountered in 396 (17%) incidents. These 396 incidents represent the number of times officers unholstered their weapons (e.g., firearm, conducted energy weapon) as a safety measure when they responded to potentially dangerous situations, however, no subjects were encountered nor weapons discharged. Though a weapon is not used on a subject, unholstering it is considered a display, therefore, counted as a type of force. None Psychological Intimidation Verbal Noncompliance Passive Resistance Defensive Resistance Active Resistance Active Aggression Aggravated Active Aggression Total 396 35 156 207 818 445 217 80 2,354 Subject’s Actions Highest Level of Resistance Encountered by Officer
  • 9. 9 Rev. 9-2020 BREAKDOWN OF OPTIONS USED IN INCIDENTS REQUIRING FORCE Summarized below is the highest level of force used by officers in each incident. Physical Confrontation techniques were the most frequent force options used by officers, which accounted for 46% of force applications. Deadly Force accounted for 21% of force options used. The act of unholstering the firearm is included in the same category as deadly force. See below for details. Highest Level of Control Use During Incident Type of Force Used by Officers Deadly Force: Firearm Unholstered Versus Discharged at Subject The deadly force figure above does not indicate that firearms were discharged at subjects in 21% of force incidents. Officers often unholster their firearms as a safety measure when responding to potentially dangerous situations such as a burglary in progress or building search for a suspect. Included in the 21% are incidents when firearms are unholstered but not discharged at a subject. Though officers unholstered their firearms in 478 incidents, only in 9 situations did officers resort to discharging their firearms at a subject.
  • 10. 10 Rev. 9-2020 Officer Response to Subject’s Actions Officer Response SubjectResistance Verbal Command Physical Contact Chemical Agent Physical Confrontation Intermediate Weapon Deadly Force Total Psychological Intimidation 2 10 1 5 1 16 35 Verbal Noncompliance 3 52 10 44 2 44 155 Passive Resistance 3 127 3 59 1 13 206 Defensive Resistance 2 314 18 454 3 27 818 Active Resistance 2 96 16 307 6 17 444 Active Aggression 2 31 20 153 4 7 217 Aggravated Active Aggression 1 3 1 29 3 43 80 Total 15 633 69 1,051 20 167 1,955 Duration of Resistance. Most of the resistance interactions lasted less than 30 seconds (935) or 40%. Of the total, 69% of all incidents lasted a minute or less. Duration of Resistance < 30 Sec 30 Sec to 1 Min 1-2 Min 2-4 Min > 4 Min N/A 935 693 341 201 134 50 40% 29% 14% 9% 6% 2%
  • 11. 11 Rev. 9-2020 Officer Response in Relation to Subject Age and Gender. In 2019, Physical Confrontation was most effective in incidents involving juveniles, the same was reported for 2018. Consistent with 2018, the application of force options were applied consistently over all age groups with Physical Confrontation techniques (45%) being the most commonly used option. In 2018, it accounted for 44% of all force incidents. Physical Confrontation technique was used more often with male (36%) than female (10%) subjects. The Deadly Force option, which includes unholstering of a firearm, was used in a higher percentage of incidents where male subjects (17%) were involved versus female subjects (3%). Subject injuries. In 2019, 74% of subjects in use of force incidents had no observable injury and reported none when asked. Subjects who had no observable injury but complained of injury accounted for 6% of subjects. There were 471 (21%) subjects who sustained bodily injury, eleven subjects who sustained substantial bodily injury, and seven subjects who sustained serious bodily injury. As reported by officer(s) at the time of the incident, eight subjects died during incidents where force was used in response to a call for service. Officer injuries. In 2019, 95% of incidents occurred without an officer reporting injury. Officers sustained bodily injuries in 108 (5%) incidents. Of the total use of force incidents, one (less than 1%) resulted in substantial bodily injury. There were 17 (1%) officers who complained of injuries without having visible signs of the injuries.
  • 12. 12 Rev. 9-2020 Use of Batons. In 2019, there were nine incidents reported in the Case Reporting System (CRS) where a baton was used. Six incidents involved the display of the baton. There were three baton strikes and no jabs. In 2018, there were eight incidents where the baton was used. Five incidents involving displaying the baton, three incidents involving baton strikes, and no jabs. Use of Vascular Neck Restraint. There were eleven incidents where the vascular neck restraint (VNR) was used as compared to nine incidents in 2018. Use of Chemical Agents. There were 73 reports on the use of chemical agents. Of those reported, all were oleoresin capsicum (OC) spray incidents. Of those incidents, 18 incidents were display only and 55 officers reported discharging the spray. In 2018, there were 93 reports on the use of chemical agents, all OC spray incidents. Of those incidents, 20 incidents were display only and 73 officers reported discharging the spray. Conducted Electrical Weapon Use. In 2019, there were 58 incidents in which the conducted electrical weapon (CEW) was used. Of those incidents, 40 were display and 18 were probe deployments. In comparison for 2018, the CRS reported 53 incidents where the CEW was used. Of those, 42 were display only incidents, 11 probe deployments, and no drive stuns. Use of Firearms. Use or display of firearms, including handguns, shotguns, and rifles were reported in 488 force incidents in 2019. Of the total number of cases involving firearms, nine incidents involved a discharge of the weapon(s). In 2018, there were 407 incidents, including 11 incidents where firearms were discharged. Tables on the following pages summarize some of the observations in this section.
  • 13. 13 Rev. 9-2020 Type of Control Used Within Each Force Option (based on highest level of force used)* Verbal Command Asking Setting Context Ordering Giving Options Confirmation Other Total 12 0 15 0 0 0 27 Physical Contact Touch Escort Lt Pressure Pt Lt Joint Lock Other Total 446 110 13 35 55 659 Chemical Agent Chemical Agent Displayed Only Chemical Agent Used Total 18 55 73 Physical Confrontation (Includes Conducted Energy Weapon) Hand/Arm Strike Foot/Leg Strike Head Lock Joint Lock Physical Strength Technique Other Total 118 45 25 140 627 115 1,070 Display Only Probes Drive Stun Conducted Energy Weapon Total 40 18 0 58 Intermediate Weapon Display Baton Only Baton Strike Baton Jab Vascular Neck Restraint Stun Weapon (less-lethal, impact, specialty) Other Total 6 3 0 11 0 0 20 Deadly Force Displayed/Unholstered Weapon Fired Weapon Other Total 478 9 1 488 *Note: Information was retrieved from CRS and filtered based on (i) force start dates between 1/1/2019 to 12/31/2019, and (ii) submitted as approved reports. Confirmed with PSO.
  • 14. 14 Rev. 9-2020 Type of Force Used by Subject Age <18 18-29 30-39 40-49 50-59 60+ Not Specified Total None 1 0 3 2 3 0 8 17 Verbal Command 1 11 8 5 1 1 0 27 Physical Contact 40 236 179 94 52 39 19 659 Chemical Agent 4 25 18 7 6 3 10 73 Physical Confrontation 79 375 299 134 108 41 34 1,070 Intermediate Weapon 1 8 6 3 0 2 0 20 Deadly Force 25 165 116 72 46 29 35 488 Total 151 820 629 317 216 115 106 2,354 Type of Force Used by Subject Gender Subject Gender None Verbal Command Physical Contact Chemical Agent Physical Confrontation Intermediate Weapon Deadly Force Total Male 10 (1%) 21 (1%) 451 (20%) 55 (4%) 838 (36%) 17 (1%) 398 (17%) 1,790 Female 1 (1%) 6 (1%) 202 (9%) 11 (1%) 218 (10%) 3 (1%) 67 (3%) 508 Not Specified 6 (1%) 0 (0%) 6 (1%) 7 (1%) 14 (1%) 0 (0%) 23 (1%) 56 Total 17 (0.7%) 27 (1.1%) 659 (28.0%) 73 (3.1%) 1,070 (45.5%) 20 (0.8%) 488 (20.7%) 2,354
  • 15. 15 Rev. 9-2020 Subject Injuries by Type of Force Used Type of Force None Complaint of Injury Bodily Injury Substantial Bodily Injury Serious Bodily Injury Death Total None 16 1 0 0 0 0 17 Verbal Command 25 0 2 0 0 0 27 Physical Contact 516 39 100 1 0 3 661 Chemical Agent 41 7 25 0 0 0 73 Physical Confrontation 662 79 317 8 4 0 1,070 Intermediate Weapon 10 4 6 0 0 0 20 Deadly Force 447 10 21 2 3 5 488 Total 1,717 140 471 11 7 8 2,354 % of Force Used 73.0% 5.9% 20.0% 0.5% 0.3% 0.3% *Note: Information was retrieved from CRS and filtered based on (i) force start dates between 1/1/2019 to 12/31/2019, and (ii) submitted as approved reports. Officer Injuries by Type of Force Used Type of Force None Complaint of Injury Bodily Injury Substantial Bodily Injury Serious Bodily Injury Death Total None 16 0 1 0 0 0 17 Verbal Command 27 0 0 0 0 0 27 Physical Contact 639 9 10 0 1 0 659 Chemical Agent 71 0 2 0 0 0 73 Physical Confrontation 976 8 85 1 0 0 1,070 Intermediate Weapon 18 0 2 0 0 0 20 Deadly Force 480 0 8 0 0 0 488 Total 2,227 17 108 1 1 0 2,354 % of Force Used 94.6% 0.7% 4.5% 0.1% 0.1% 0% *Note: Information was retrieved from CRS and filtered based on (i) force start dates between 1/1/2019 to 12/31/2019, and (ii) submitted as approved reports.
  • 16. 16 Rev. 9-2020 RECOMMNDATIONS The following recommendations are based on the call for police reform facing law enforcement agencies across the nation. Although Hawaii has a more diversified demographic make-up in regards to ethnicities, there still may be a need to track officers’ use of force to identify issues of implicit or explicit bias. Also, a review of the Justice in Policing Act draft identifies disproportionate minority contact as one of the key issues in developing their proposed reporting mandates. The purpose of these recommendations are two-fold: to identify employees who may be bias in their application of use of force and to anticipate reporting mandates to maintain federal funding requirements. Toward these ends, the department will explore the feasibility of implementing the following: • Ensure that the source material data contain specific fields that can capture and provide a breakdown of the number of incidents by the race, age, and gender of the officers involved in relation to the subject on whom force is used. • Ensure that the source material data contain data to capture incidents when canines are deployed as a force response. This will also be included in the update of the policy on Use of Force. • Implementation of IAPro Blue Team upon completion of the new Report Management System (RMS). The Blue Team feature will be able to extract and compile Use of Force data and compose an early intervention dashboard to be used in conjunction with the Employee Early Recognition System policy. • Integration of officer race information into IAPro from a human resources database. This will give the system the ability to provide racial comparisons between officers and subjects. The information may identify patterns or trends in an officer’s use of force. This process will be crucial to supporting the ability to provide officers’ demographics in upcoming reports.
  • 17. 17 Rev. 9-2020 The following recommendation is being made to help improve reporting accuracies and streamline data collecting practices. It has been determined that reporting discrepancies between statistics obtained from the Professional Standards Office (PSO) and the RMS (via the Case Report System) were due to each division maintaining their own separate databases. • Implementation of IAPro Blue Team upon completion of the RMS. The data collection (documenting) of use of force into the database will be at the user-level. Regardless of purpose, the extracting of data will be from the original source. The PSO and ITD will need to work with IAPro in the development of the reporting format to ensure all data they need for their specific purpose is captured, including statistics for mandated reporting. The following recommendations are to include data on other force options not previously documented and to further define the types of Deadly Force used. The statistics contained in the Annual Use of Force Report severely misrepresents Deadly Force reporting as it includes unholstering of a firearm even when a subject is not encountered (i.e.: state of readiness, building searches, etc.). • Delineate circumstances where a firearm was used into specific categories (i.e.: discharge of a firearm, brandish of a firearm, other technique, etc.). The Deadly Force categories would be represented in the Annual Use of Force Report in a table or pie chart. • Revise the Use of Force report form and data collection to distinguish incidents that do not involve the presence of a subject or the weapon being used to compel a subject. As an example, an officer performing a building search, but no subject is encountered. • The PSO investigates all reports of officer involved shootings, therefore, the accuracy of firearm discharges in the Annual Use of Force Report shall be reconciled with the PSO prior to publishing. This would ensure that the reporting of statistics include all officer-involved shootings. • Capturing data and reporting on the use of the Vascular Neck Restraint (VNR) as a deadly force option. An update to department’s policy on Use of Force will reflect this reporting change. • Documenting and reporting the deployment of a canine as a force option.
  • 18. 18 Rev. 9-2020 The following recommendations are intended to improve accuracy and quality of data that is documented on the Use of Force form. • Officers and supervisors should receive more training on how to fill out the Use of Force form as well as why properly completing the form is important (e.g., improving training, policy, and responsiveness to areas of corrections). • Measures or procedures to improve the accountability of supervisors and/or others who are directly responsible for reviewing and ensuring Use of Force forms are properly and thoroughly completed.