Final results - Politicians - Civil Beat Poll
•
1 like•3,994 views

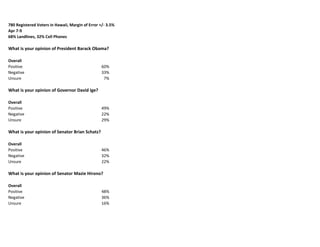
Honolulu Civil Beat Poll on politicians, April 2015.

Recommended
More Related Content
What's hot
What's hot (20)
Similar to Final results - Politicians - Civil Beat Poll
Similar to Final results - Politicians - Civil Beat Poll (20)
More from Honolulu Civil Beat
More from Honolulu Civil Beat (20)
Recently uploaded
Recently uploaded (17)
Final results - Politicians - Civil Beat Poll
- 1. 780 Registered Voters in Hawaii, Margin of Error +/- 3.5% Apr 7-9 68% Landlines, 32% Cell Phones Overall Positive 60% Negative 33% Unsure 7% Overall Positive 49% Negative 22% Unsure 29% Overall Positive 46% Negative 32% Unsure 22% Overall Positive 48% Negative 36% Unsure 16% What is your opinion of President Barack Obama? What is your opinion of Governor David Ige? What is your opinion of Senator Brian Schatz? What is your opinion of Senator Mazie Hirono?
- 2. Overall Positive 64% Negative 19% Unsure 17% By CD CD1 CD2 Positive 62% 67% Negative 20% 17% Unsure 18% 16% Overall Positive 44% Negative 16% Unsure 40% By CD CD1 CD2 Positive 48% 40% Negative 20% 12% Unsure 32% 48% Overall Positive 52% Negative 27% Unsure 21% By Island Oahu Neighbor Islands Positive 54% 46% Negative 33% 14% Unsure 13% 40% What is your opinion of Honolulu mayor Kirk Caldwell? What is your opinion of Second District Congresswoman Tulsi Gabbard? What is your opinion of First District Congressman Mark Takai?
- 3. DEMOGRAPHICS -- ALL OF HAWAII Gender Male 47% Female 53% Age 18-49 37% 50-64 32% 65+ 31% Ethnicity Caucasian 36% Japanese 27% Filipino 6% Hawaiian 10% Chinese 6% Hispanic 1% Other/Mixed 14% Politics Liberal/progressive 24% Moderate 34% Conservative 22% Unsure 20% Party ID Democrat 46% Republican 23% Independent 28% Unsure 3%
- 4. Household Income Less than $50,000 25% $50,000 - $100,000 30% $100,000 or more 26% Refused 20% Island Oahu 68% Neighbor Islands 32% Congressional District 1 52% 2 48% County/CD Oahu_1 52% Oahu_2 16% Hawaii 14% Maui 12% Kauai 6% DEMOGRAPHICS -- CONGRESSIONAL DISTRICT 2 372 Registered Voters in Hawaii's Second Congressional District, Margin of Error +/- 5.1% Gender Male 45% Female 55% Age 18-49 34% 50-64 34% 65+ 32%
- 5. Ethnicity Caucasian 44% Japanese 20% Filipino 5% Hawaiian 12% Chinese 2% Hispanic 1% Other/Mixed 15% Refused 0% Poltics Liberal/progressive 24% Moderate 35% Conservative 18% Unsure 23% Party ID Democrat 54% Republican 18% Independent 26% Unsure 2% Household Income Less than $50,000 33% $50,000 - $100,000 29% $100,000 or more 24% Refused 14% County/CD Oahu_2 34% Hawaii 29% Maui 24% Kauai 13%
- 6. DEMOGRAHPICS -- CONGRESSIONAL DISTRICT 1 409 Registered Voters in Hawaii's First Congressional District, Margin of Error +/- 4.8% Gender Male 48% Female 52% Age 18-49 40% 50-64 30% 65+ 30% Ethnicity Caucasian 29% Japanese 33% Filipino 7% Hawaiian 8% Chinese 10% Hispanic 0% Other/Mixed 12% Poltics Liberal/progressive 25% Moderate 33% Conservative 25% Unsure 16% Party ID Democrat 39% Republican 28% Independent 29% Unsure 4%
- 7. Household Income Less than $50,000 17% $50,000 - $100,000 30% $100,000 or more 28% Refused 25% DEMOGRAPHICS -- OAHU 535 Registered Voters on Oahu, Margin of Error +/- 4.2% Gender Male 47% Female 53% Age 18-49 39% 50-64 31% 65+ 31% Ethnicity Caucasian 32% Japanese 30% Filipino 5% Hawaiian 10% Chinese 8% Hispanic 1% Other/Mixed 13% Politics Liberal/progressive 25% Moderate 31% Conservative 26% Unsure 17%
- 8. Party ID Democrat 40% Republican 28% Independent 28% Unsure 4% Household Income Less than $50,000 17% $50,000 - $100,000 31% $100,000 or more 29% Refused 23% Obama Crosstabs Obama by Gender Male Female Positive 66% 56% Negative 29% 36% Unsure 5% 8% Obama by Age 18-49 50-64 65+ Positive 64% 59% 60% Negative 34% 36% 31% Unsure 1% 5% 10% Obama by Ethnicity Caucasian Japanese Filipino Hawaiian Chinese Hispanic Other/Mixed Positive 57% 73% 45% 62% 54% 71% 54% Negative 40% 21% 36% 31% 43% 29% 40% Unsure 3% 7% 19% 7% 2% 0% 6% Obama by Politics Liberal/progressive Moderate Conservative Unsure Positive 89% 65% 24% 56% Negative 6% 31% 71% 33% Unsure 5% 4% 5% 11%
- 9. Obama by Party Democrat Republican Independent Unsure Positive 84% 21% 53% 28% Negative 10% 76% 44% 33% Unsure 7% 3% 3% 39% Obama by Household Income Less than $50,000 $50,000 - $100,000 $100,000 or more Positive 52% 62% 65% Negative 44% 37% 30% Unsure 4% 1% 5% Obama by Island Oahu Neighbor Islands Positive 55% 70% Negative 36% 26% Unsure 9% 5% Obama by CD 1 2 Positive 57% 63% Negative 34% 32% Unsure 9% 6% Obama by County/CD Oahu_1 Oahu_2 Hawaii Maui Kauai Positive 57% 48% 61% 67% 97% Negative 34% 43% 32% 29% 3% Unsure 9% 8% 7% 4% 0% Ige Crosstabs Ige by Gender Male Female Positive 59% 42% Negative 21% 22% Unsure 20% 36%
- 10. Ige by Age 18-49 50-64 65+ Positive 51% 48% 55% Negative 27% 22% 16% Unsure 23% 30% 29% Ige by Ethnicity Caucasian Japanese Filipino Hawaiian Chinese Hispanic Other/Mixed Positive 42% 65% 47% 51% 34% 37% 45% Negative 28% 12% 32% 24% 37% 47% 15% Unsure 30% 22% 22% 24% 29% 16% 40% Ige by Politics Liberal/progressive Moderate Conservative Unsure Positive 56% 61% 36% 35% Negative 14% 17% 39% 23% Unsure 30% 22% 25% 42% Ige by Party Democrat Republican Independent Unsure Positive 56% 47% 43% 17% Negative 17% 31% 26% 28% Unsure 27% 22% 31% 55% Ige by Household Income Less than $50,000 $50,000 - $100,000 $100,000 or more Positive 38% 54% 61% Negative 23% 27% 17% Unsure 39% 20% 23% Ige by Island Oahu Neighbor Islands Positive 48% 52% Negative 24% 19% Unsure 29% 29%
- 11. Ige by CD 1 2 Positive 46% 52% Negative 24% 20% Unsure 30% 28% Ige by County/CD Oahu_1 Oahu_2 Hawaii Maui Kauai Positive 46% 52% 55% 52% 47% Negative 24% 22% 15% 32% 3% Unsure 30% 26% 30% 16% 50% Schatz Crosstabs Schatz by Gender Male Female Positive 42% 50% Negative 40% 26% Unsure 19% 25% Schatz by Age 18-49 50-64 65+ Positive 36% 50% 55% Negative 41% 31% 24% Unsure 23% 19% 21% Schatz by Ethnicity Caucasian Japanese Filipino Hawaiian Chinese Hispanic Other/Mixed Positive 42% 47% 24% 47% 47% 63% 49% Negative 41% 34% 26% 40% 27% 21% 19% Unsure 17% 19% 50% 14% 26% 16% 32% Schatz by Politics Liberal/progressive Moderate Conservative Unsure Positive 79% 39% 20% 37% Negative 10% 41% 57% 26% Unsure 11% 20% 23% 37%
- 12. Schatz by Party Democrat Republican Independent Unsure Positive 62% 14% 47% 8% Negative 20% 69% 29% 29% Unsure 18% 17% 24% 64% Schatz by Household Income Less than $50,000 $50,000 - $100,000 $100,000 or more Positive 49% 48% 54% Negative 19% 35% 39% Unsure 31% 18% 6% Schatz by Island Oahu Neighbor Islands Positive 43% 52% Negative 35% 27% Unsure 22% 21% Schatz by CD 1 2 Positive 42% 50% Negative 35% 29% Unsure 23% 21% Schatz by County/CD Oahu_1 Oahu_2 Hawaii Maui Kauai Positive 42% 46% 52% 36% 80% Negative 35% 34% 26% 40% 4% Unsure 23% 20% 21% 24% 15% Hirono Crosstabs Hirono by Gender Male Female Positive 45% 50% Negative 41% 33% Unsure 14% 16%
- 13. Hirono by Age 18-49 50-64 65+ Positive 43% 49% 54% Negative 44% 38% 29% Unsure 13% 13% 17% Hirono by Ethnicity Caucasian Japanese Filipino Hawaiian Chinese Hispanic Other/Mixed Positive 43% 57% 47% 50% 20% 66% 43% Negative 44% 32% 27% 39% 64% 19% 29% Unsure 13% 11% 26% 11% 16% 16% 28% Hirono by Politics Liberal/progressive Moderate Conservative Unsure Positive 69% 46% 23% 43% Negative 13% 43% 61% 37% Unsure 18% 11% 15% 20% Hirono by Party Democrat Republican Independent Unsure Positive 68% 13% 37% 34% Negative 14% 80% 46% 33% Unsure 18% 6% 17% 33% Hirono by Household Income Less than $50,000 $50,000 - $100,000 $100,000 or more Positive 54% 46% 53% Negative 31% 42% 32% Unsure 15% 12% 15% Hirono by Island Oahu Neighbor Islands Positive 42% 61% Negative 43% 22% Unsure 15% 17%
- 14. Hirono by CD 1 2 Positive 39% 57% Negative 44% 28% Unsure 17% 15% Hirono by County/CD Oahu_1 Oahu_2 Hawaii Maui Kauai Positive 39% 50% 52% 55% 91% Negative 44% 40% 25% 31% 1% Unsure 17% 10% 23% 14% 8% Gabbard Crosstabs -- CD 2 Only Gabbard by Gender Male Female Positive 61% 72% Negative 20% 15% Unsure 19% 13% Gabbard by Age 18-49 50-64 65+ Positive 56% 74% 70% Negative 28% 13% 13% Unsure 16% 13% 17% Gabbard by Ethnicity Caucasian Japanese Filipino Hawaiian Chinese Hispanic Other/Mixed Positive 72% 78% 23% 74% 78% 53% 55% Negative 18% 14% 0% 12% 6% 27% 27% Unsure 9% 7% 77% 14% 16% 20% 18% Gabbard by Politics Liberal/progressive Moderate Conservative Unsure Positive 81% 67% 64% 61% Negative 12% 14% 23% 21% Unsure 7% 18% 13% 17%
- 15. Gabbard by Party ID Democrat Republican Independent Unsure Positive 80% 61% 55% 59% Negative 8% 31% 30% 10% Unsure 12% 8% 15% 31% Gabbard by Household Income Less than $50,000 $50,000 - $100,000 $100,000 or more Positive 68% 70% 84% Negative 16% 19% 12% Unsure 16% 11% 4% Gabbard by County/CD Positive Oahu_2 Hawaii Maui Kauai Negative 65% 69% 56% 90% Unsure 23% 13% 22% 1% Takai Crosstabs -- CD 1 Only Takai by Gender Male Female Positive 59% 40% Negative 16% 25% Unsure 25% 36% Takai by Age 18-49 50-64 65+ Positive 52% 45% 50% Negative 24% 24% 14% Unsure 24% 30% 36% Takai by Ethnicity Caucasian Japanese Filipino Hawaiian Chinese Hispanic Other/Mixed Positive 39% 71% 12% 59% 25% 0% 32% Negative 31% 11% 42% 21% 17% 0% 21% Unsure 30% 18% 45% 21% 58% 47%
- 16. Takai by Politics Liberal/progressive Moderate Conservative Unsure Positive 59% 67% 24% 25% Negative 5% 15% 47% 21% Unsure 37% 18% 29% 54% Takai by Party ID Democrat Republican Independent Unsure Positive 66% 35% 37% 45% Negative 8% 34% 30% 12% Unsure 26% 30% 34% 43% Takai by Household Income Less than $50,000 $50,000 - $100,000 $100,000 or more Positive 29% 47% 55% Negative 32% 26% 21% Unsure 39% 27% 24% Caldwell Crosstabs -- Oahu only Caldwell by Gender Male Female Positive 64% 48% Negative 32% 34% Unsure 4% 18% Caldwell by Age 18-49 50-64 65+ Positive 66% 52% 45% Negative 27% 33% 42% Unsure 7% 14% 14% Caldwell by Ethnicity Caucasian Japanese Filipino Hawaiian Chinese Hispanic Other/Mixed Positive 46% 70% 67% 57% 51% 70% 32% Negative 48% 20% 11% 37% 38% 18% 42% Unsure 6% 10% 22% 6% 11% 13% 26%
- 17. Caldwell by Politics Liberal/progressive Moderate Conservative Unsure Positive 65% 53% 49% 51% Negative 28% 37% 43% 27% Unsure 8% 11% 8% 22% Caldwell by Party ID Democrat Republican Independent Unsure Positive 55% 61% 47% 34% Negative 33% 32% 39% 40% Unsure 12% 7% 14% 26% Caldwell by Household Income Less than $50,000 $50,000 - $100,000 $100,000 or more Positive 54% 51% 53% Negative 28% 39% 41% Unsure 18% 10% 6%