More Related Content
Similar to Civil beat june 2013 crosstabs
Similar to Civil beat june 2013 crosstabs (20)
More from Honolulu Civil Beat
More from Honolulu Civil Beat (20)
Civil beat june 2013 crosstabs
- 1. Merriman River Group
Civil Beat Poll -- June 2013
869 Registered Voters Throughout Hawaii
June 18-20, and 24, 2013
78% Landlines, 22% Cell Phones
Margin of Sampling Error +/-3.3%
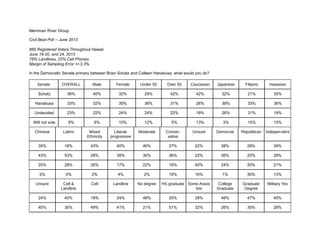
In the Democratic Senate primary between Brian Schatz and Colleen Hanabusa, what would you do?
Senate OVERALL Male Female Under 50 Over 50 Caucasian Japanese Filipino Hawaiian
Schatz 36% 40% 32% 29% 42% 42% 32% 21% 30%
Hanabusa 33% 32% 35% 36% 31% 26% 39% 33% 36%
Undecided 23% 22% 24% 24% 22% 19% 26% 31% 19%
Will not vote 9% 6% 10% 12% 5% 13% 3% 15% 15%
Chinese Latino Mixed
Ethnicity
Liberal-
progressive
Moderate Conser-
vative
Unsure Democrat Republican Indepen-dent
35% 18% 43% 40% 46% 27% 22% 38% 29% 39%
43% 53% 28% 39% 30% 36% 22% 36% 20% 28%
20% 29% 26% 17% 22% 18% 40% 24% 20% 21%
2% 0% 2% 4% 2% 19% 16% 1% 30% 13%
Unsure Cell &
Landline
Cell Landline No degree HS graduate Some Assoc
Voc
College
Graduate
Graduate
Degree
Military Yes
24% 40% 18% 24% 48% 20% 28% 46% 47% 40%
40% 30% 49% 41% 21% 51% 32% 26% 30% 28%
- 2. 28% 22% 33% 25% 27% 27% 31% 17% 16% 21%
8% 9% 1% 11% 4% 2% 10% 11% 8% 11%
Military No Union Yes Union No Children Yes Children No Children
Refused
50k or less Income 50-
100k
Income 100k
30% 38% 35% 37% 36% 20% 29% 39% 41%
38% 38% 29% 33% 31% 40% 35% 33% 29%
27% 17% 28% 25% 22% 17% 29% 21% 18%
5% 7% 9% 5% 11% 23% 7% 7% 12%
Do you generally have a positive or negative opinion of U.S. Senator Brian Schatz?
Schatz OVERALL Male Female Under 50 Over 50 Caucasian Japanese Filipino Hawaiian
Positive 49% 48% 50% 43% 55% 54% 47% 44% 39%
Negative 27% 29% 25% 30% 23% 30% 19% 30% 37%
Unsure 25% 23% 25% 27% 22% 16% 34% 27% 25%
Chinese Latino Mixed
Ethnicity
Liberal-
progressive
Moderate Conser-
vative
Unsure Democrat Republican Indepen-dent
40% 39% 55% 56% 58% 34% 39% 60% 31% 40%
16% 61% 19% 25% 17% 48% 22% 19% 50% 31%
45% 0% 26% 19% 25% 18% 39% 22% 19% 30%
Unsure Cell &
Landline
Cell Landline No degree HS graduate Some Assoc
Voc
College
Graduate
Graduate
Degree
Military Yes
34% 52% 33% 40% 28% 36% 47% 53% 59% 52%
- 3. 26% 22% 26% 48% 24% 28% 28% 21% 27% 27%
39% 26% 41% 11% 47% 36% 25% 25% 15% 21%
Military No Union Yes Union No Children Yes Children No Children
Refused
50k or less Income 50-
100k
Income 100k
46% 56% 45% 50% 50% 38% 39% 58% 54%
25% 29% 24% 24% 24% 56% 31% 24% 20%
30% 15% 31% 26% 26% 6% 30% 18% 26%
Do you generally have a positive or negative opinion of First District Congresswoman Colleen Hanabusa?
Hanabusa OVERALL Male Female Under 50 Over 50 Caucasian Japanese Filipino Hawaiian
Positive 48% 46% 51% 45% 51% 41% 57% 62% 48%
Negative 41% 45% 37% 46% 37% 48% 30% 35% 42%
Unsure 11% 9% 12% 9% 12% 10% 13% 3% 9%
Chinese Latino Mixed
Ethnicity
Liberal-
progressive
Moderate Conser-
vative
Unsure Democrat Republican Indepen-dent
49% 56% 45% 57% 49% 38% 43% 60% 12% 35%
38% 37% 45% 34% 39% 56% 40% 29% 82% 54%
13% 7% 10% 9% 12% 7% 16% 11% 5% 12%
Unsure Cell &
Landline
Cell Landline No degree HS graduate Some Assoc
Voc
College
Graduate
Graduate
Degree
Military Yes
71% 46% 55% 58% 35% 56% 51% 45% 45% 46%
15% 43% 24% 36% 45% 23% 41% 43% 50% 44%
- 4. 14% 11% 20% 6% 21% 21% 8% 13% 5% 11%
Military No Union Yes Union No Children Yes Children No Children
Refused
50k or less Income 50-
100k
Income 100k
52% 57% 43% 51% 44% 59% 50% 50% 45%
37% 37% 44% 40% 44% 31% 30% 42% 49%
11% 6% 14% 9% 13% 10% 20% 8% 6%
How do feel about Neil Abercrombie’s job performance as Governor?
Abercrombie OVERALL Male Female Under 50 Over 50 Caucasian Japanese Filipino Hawaiian
Approve 45% 48% 43% 41% 48% 42% 47% 58% 46%
Disapprove 48% 50% 48% 53% 46% 54% 45% 28% 51%
Unsure 7% 3% 9% 6% 6% 4% 8% 15% 4%
Chinese Latino Mixed
Ethnicity
Liberal-
progressive
Moderate Conser-
vative
Unsure Democrat Republican Indepen-dent
37% 57% 44% 53% 50% 30% 39% 55% 22% 39%
59% 43% 50% 42% 48% 67% 45% 40% 76% 60%
4% 0% 6% 5% 3% 3% 16% 5% 3% 2%
Unsure Cell &
Landline
Cell Landline No degree HS graduate Some Assoc
Voc
College
Graduate
Graduate
Degree
Military Yes
26% 44% 52% 45% 55% 51% 48% 38% 41% 46%
35% 50% 38% 50% 22% 40% 47% 54% 58% 50%
- 5. 39% 6% 10% 5% 23% 9% 5% 8% 2% 4%
Military No Union Yes Union No Children Yes Children No Children
Refused
50k or less Income 50-
100k
Income 100k
42% 43% 45% 48% 43% 27% 51% 42% 46%
48% 52% 48% 45% 52% 68% 43% 53% 46%
10% 5% 7% 7% 5% 5% 7% 4% 8%
How do you feel things are going in Hawaii—are they generally going in the right direction or the wrong direction?
Hawaii OVERALL Male Female Under 50 Over 50 Caucasian Japanese Filipino Hawaiian
Right 38% 39% 38% 33% 43% 38% 41% 44% 19%
Wrong 46% 45% 47% 52% 42% 50% 42% 32% 68%
Unsure 15% 15% 15% 15% 15% 12% 17% 24% 13%
Chinese Latino Mixed
Ethnicity
Liberal-
progressive
Moderate Conser-
vative
Unsure Democrat Republican Indepen-dent
40% 38% 52% 46% 45% 27% 26% 52% 21% 24%
28% 32% 34% 42% 41% 61% 46% 32% 65% 65%
32% 30% 14% 11% 14% 12% 27% 16% 14% 11%
Unsure Cell &
Landline
Cell Landline No degree HS graduate Some Assoc
Voc
College
Graduate
Graduate
Degree
Military Yes
19% 39% 39% 37% 28% 37% 34% 39% 49% 41%
55% 46% 44% 48% 44% 46% 50% 44% 43% 47%
- 6. 26% 15% 16% 15% 28% 17% 16% 17% 8% 11%
Military No Union Yes Union No Children Yes Children No Children
Refused
50k or less Income 50-
100k
Income 100k
35% 43% 37% 39% 41% 27% 34% 45% 45%
44% 38% 51% 50% 39% 57% 52% 38% 41%
21% 19% 13% 12% 20% 16% 14% 16% 15%
How do you feel about Barack Obama’s job performance as President?
Obama_ OVERALL Male Female Under 50 Over 50 Caucasian Japanese Filipino Hawaiian
Approve 68% 74% 65% 69% 69% 66% 70% 72% 66%
Disapprove 29% 25% 31% 28% 29% 33% 25% 25% 31%
Unsure 3% 1% 4% 4% 2% 1% 5% 3% 3%
Chinese Latino Mixed
Ethnicity
Liberal-
progressive
Moderate Conser-
vative
Unsure Democrat Republican Indepen-dent
65% 98% 71% 80% 78% 37% 68% 90% 17% 52%
30% 2% 26% 19% 21% 62% 21% 9% 82% 48%
5% 0% 2% 1% 1% 1% 11% 1% 1% 0%
- 7. Unsure Cell &
Landline
Cell Landline No degree HS graduate Some Assoc
Voc
College
Graduate
Graduate
Degree
Military Yes
61% 68% 81% 71% 71% 82% 66% 64% 70% 67%
7% 29% 17% 27% 6% 11% 31% 36% 30% 31%
32% 3% 2% 2% 23% 7% 3% 0% 0% 2%
Military No Union Yes Union No Children Yes Children No Children
Refused
50k or less Income 50-
100k
Income 100k
72% 76% 65% 67% 73% 66% 70% 71% 66%
23% 22% 31% 29% 26% 32% 27% 27% 29%
5% 1% 4% 4% 1% 1% 3% 1% 5%
Would you support or oppose a ban on semi-automatic military-style assault weapons in Hawaii?
Assault Ban OVERALL Male Female Under 50 Over 50 Caucasian Japanese Filipino Hawaiian
Support 62% 60% 64% 55% 69% 66% 63% 47% 56%
Oppose 27% 29% 25% 32% 22% 24% 26% 45% 32%
Doesn't
Matter
6% 9% 4% 8% 4% 6% 4% 3% 7%
Unsure 5% 2% 8% 6% 4% 3% 6% 5% 5%
Chinese Latino Mixed
Ethnicity
Liberal-
progressive
Moderate Conser-
vative
Unsure Democrat Republican Indepen-dent
70% 78% 56% 74% 71% 45% 45% 72% 40% 59%
21% 19% 30% 15% 20% 46% 39% 16% 47% 34%
- 8. 3% 0% 8% 4% 7% 4% 9% 7% 3% 4%
6% 3% 7% 7% 3% 5% 6% 5% 10% 2%
Unsure Cell &
Landline
Cell Landline No degree HS graduate Some Assoc
Voc
College
Graduate
Graduate
Degree
Military Yes
31% 63% 59% 59% 30% 54% 54% 70% 76% 63%
56% 26% 32% 31% 57% 28% 30% 24% 22% 27%
11% 6% 1% 6% 3% 10% 10% 3% 1% 7%
2% 5% 9% 4% 11% 8% 7% 3% 2% 4%
Military No Union Yes Union No Children Yes Children No Children
Refused
50k or less Income 50-
100k
Income 100k
62% 65% 61% 59% 73% 23% 61% 68% 65%
27% 23% 29% 26% 22% 62% 25% 21% 30%
5% 6% 6% 8% 4% 3% 11% 6% 3%
7% 5% 4% 6% 1% 12% 3% 4% 3%
Would you support or oppose a national law expanding background checks to gun sales made at gun shows and over the Internet?
Background
Checks
OVERALL Male Female Under 50 Over 50 Caucasian Japanese Filipino Hawaiian
Support 79% 77% 82% 76% 84% 82% 85% 59% 70%
Oppose 13% 17% 10% 17% 9% 13% 9% 28% 17%
Doesn't
Matter
4% 5% 3% 4% 4% 2% 4% 8% 8%
- 9. Unsure 4% 1% 5% 3% 3% 2% 2% 5% 4%
Chinese Latino Mixed
Ethnicity
Liberal-
progressive
Moderate Conser-
vative
Unsure Democrat Republican Indepen-dent
80% 100% 81% 89% 90% 67% 64% 88% 66% 75%
10% 0% 12% 8% 8% 22% 17% 8% 21% 19%
6% 0% 2% 2% 1% 4% 13% 3% 8% 2%
4% 0% 5% 0% 0% 7% 6% 2% 6% 4%
Unsure Cell &
Landline
Cell Landline No degree HS graduate Some Assoc
Voc
College
Graduate
Graduate
Degree
Military Yes
74% 82% 87% 71% 46% 75% 78% 85% 87% 81%
7% 12% 5% 20% 45% 8% 15% 10% 11% 13%
16% 4% 0% 3% 4% 11% 5% 2% 0% 2%
3% 2% 8% 6% 5% 5% 2% 3% 2% 3%
Military No Union Yes Union No Children Yes Children No Children
Refused
50k or less Income 50-
100k
Income 100k
80% 81% 80% 82% 85% 45% 75% 88% 81%
11% 13% 12% 12% 10% 31% 17% 6% 15%
6% 3% 5% 5% 3% 0% 6% 3% 4%
3% 3% 3% 1% 2% 24% 3% 3% 0%
Overall, do you think that guns are as important an issue in Hawaii as in the rest of the country?
Hawaii Guns OVERALL Male Female Under 50 Over 50 Caucasian Japanese Filipino Hawaiian
- 10. As Important 58% 53% 63% 57% 60% 57% 59% 48% 63%
Mainland
Issue
32% 41% 25% 37% 26% 35% 26% 41% 35%
Unsure 10% 6% 13% 6% 13% 8% 15% 11% 2%
Chinese Latino Mixed
Ethnicity
Liberal-
progressive
Moderate Conser-
vative
Unsure Democrat Republican Indepen-dent
62% 63% 61% 54% 62% 59% 58% 55% 51% 65%
24% 32% 34% 35% 31% 29% 35% 35% 37% 29%
14% 5% 5% 11% 7% 12% 8% 10% 12% 6%
Unsure Cell &
Landline
Cell Landline No degree HS graduate Some Assoc
Voc
College
Graduate
Graduate
Degree
Military Yes
77% 57% 69% 62% 65% 64% 55% 63% 53% 61%
17% 34% 23% 25% 30% 23% 35% 31% 38% 32%
6% 9% 8% 13% 5% 13% 11% 5% 9% 7%
Military No Union Yes Union No Children Yes Children No Children
Refused
50k or less Income 50-
100k
Income 100k
54% 57% 59% 63% 51% 56% 64% 56% 54%
34% 35% 32% 27% 40% 35% 30% 34% 39%
12% 8% 10% 9% 8% 10% 6% 10% 7%
Would you support or oppose a ballot initiative system in Hawaii that would allow state residents to place issues on the ballot directly, just by
getting enough valid petition signatures?
- 11. Direct
Democracy
OVERALL Male Female Under 50 Over 50 Caucasian Japanese Filipino Hawaiian
Yes 62% 61% 63% 65% 61% 64% 56% 68% 74%
No 22% 24% 20% 20% 23% 25% 24% 18% 10%
Doesn't
Matter
6% 9% 4% 5% 6% 4% 10% 9% 6%
Unsure 10% 6% 13% 10% 10% 7% 11% 6% 10%
Chinese Latino Mixed
Ethnicity
Liberal-
progressive
Moderate Conser-
vative
Unsure Democrat Republican Indepen-dent
46% 65% 63% 53% 68% 64% 64% 55% 72% 76%
35% 9% 21% 31% 23% 18% 10% 27% 12% 17%
8% 0% 3% 4% 3% 10% 11% 6% 2% 2%
10% 26% 13% 12% 6% 8% 15% 11% 13% 4%
Unsure Cell &
Landline
Cell Landline No degree HS graduate Some Assoc
Voc
College
Graduate
Graduate
Degree
Military Yes
44% 64% 48% 59% 37% 50% 73% 60% 60% 65%
16% 24% 14% 16% 24% 14% 14% 27% 33% 22%
27% 4% 19% 12% 9% 20% 5% 4% 2% 7%
13% 8% 19% 13% 30% 16% 9% 9% 5% 6%
Military No Union Yes Union No Children Yes Children No Children
Refused
50k or less Income 50-
100k
Income 100k
58% 60% 64% 67% 59% 40% 71% 62% 56%
- 12. 22% 22% 21% 20% 27% 4% 13% 26% 29%
5% 5% 7% 4% 5% 37% 9% 2% 5%
15% 12% 8% 9% 9% 19% 7% 9% 10%
Would you support or oppose moving Memorial Day back to its original date of May 30, regardless of the day of the week?
Memorial Day OVERALL Male Female Under 50 Over 50 Caucasian Japanese Filipino Hawaiian
Support 31% 34% 28% 25% 36% 24% 36% 33% 41%
Oppose 51% 51% 53% 58% 47% 62% 43% 52% 46%
Doesn't
Matter
16% 14% 17% 17% 14% 13% 19% 14% 13%
Unsure 2% 1% 2% 0% 3% 1% 2% 1% 0%
Chinese Latino Mixed
Ethnicity
Liberal-
progressive
Moderate Conser-
vative
Unsure Democrat Republican Indepen-dent
47% 29% 21% 19% 29% 48% 30% 25% 40% 34%
33% 17% 61% 64% 55% 40% 45% 56% 46% 55%
17% 54% 17% 17% 15% 11% 23% 18% 13% 10%
3% 0% 0% 0% 1% 1% 2% 1% 2% 2%
Unsure Cell &
Landline
Cell Landline No degree HS graduate Some Assoc
Voc
College
Graduate
Graduate
Degree
Military Yes
40% 27% 62% 35% 28% 48% 34% 23% 20% 36%
27% 56% 30% 44% 47% 35% 50% 60% 60% 49%
30% 16% 8% 20% 25% 15% 15% 17% 18% 14%
- 13. 2% 1% 0% 2% 0% 2% 1% 0% 2% 1%
Military No Union Yes Union No Children Yes Children No Children
Refused
50k or less Income 50-
100k
Income 100k
22% 27% 32% 29% 26% 67% 34% 25% 28%
57% 57% 50% 52% 58% 19% 44% 62% 53%
20% 15% 17% 18% 14% 14% 20% 13% 18%
1% 1% 1% 1% 1% 0% 1% 0% 2%