More Related Content
Similar to GMO Labeling Crosstabs
Similar to GMO Labeling Crosstabs (20)
More from Honolulu Civil Beat
More from Honolulu Civil Beat (20)
GMO Labeling Crosstabs
- 1. Hirono by County/CD Oahu_1 Oahu_2 Hawaii Maui Kauai
Positive 39% 50% 52% 55% 91%
Negative 44% 40% 25% 31% 1%
Unsure 17% 10% 23% 14% 8%
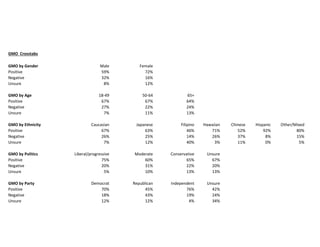
GMO Crosstabs
GMO by Gender Male Female
Positive 59% 72%
Negative 32% 16%
Unsure 8% 12%
GMO by Age 18-49 50-64 65+
Positive 67% 67% 64%
Negative 27% 22% 24%
Unsure 7% 11% 13%
GMO by Ethnicity Caucasian Japanese Filipino Hawaiian Chinese Hispanic Other/Mixed
Positive 67% 63% 46% 71% 52% 92% 80%
Negative 26% 25% 14% 26% 37% 8% 15%
Unsure 7% 12% 40% 3% 11% 0% 5%
GMO by Politics Liberal/progressive Moderate Conservative Unsure
Positive 75% 60% 65% 67%
Negative 20% 31% 22% 20%
Unsure 5% 10% 13% 13%
GMO by Party Democrat Republican Independent Unsure
Positive 70% 45% 76% 42%
Negative 18% 43% 19% 24%
Unsure 12% 12% 4% 34%
- 2. GMO by Household Income Less than $50,000 $50,000 - $100,000 $100,000 or more
Positive 76% 67% 60%
Negative 13% 22% 28%
Unsure 11% 11% 11%
GMO by Island Oahu Neighbor Islands
Positive 64% 68%
Negative 25% 21%
Unsure 11% 10%
GMO by CD 1 2
Positive 64% 67%
Negative 24% 24%
Unsure 12% 9%
GMO by County/CD Oahu_1 Oahu_2 Hawaii Maui Kauai
Positive 64% 65% 65% 71% 72%
Negative 24% 29% 24% 21% 15%
Unsure 12% 6% 11% 8% 14%
Gabbard Crosstabs -- CD 2 Only
Gabbard by Gender Male Female
Positive 61% 72%
Negative 20% 15%
Unsure 19% 13%
Gabbard by Age 18-49 50-64 65+
Positive 56% 74% 70%
Negative 28% 13% 13%
Unsure 16% 13% 17%