1. Overall
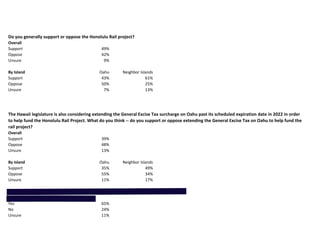
Support 49%
Oppose 42%
Unsure 9%
By Island Oahu Neighbor Islands
Support 43% 61%
Oppose 50% 25%
Unsure 7% 13%
Overall
Support 39%
Oppose 48%
Unsure 13%
By Island Oahu Neighbor Islands
Support 35% 49%
Oppose 55% 34%
Unsure 11% 17%
Overall
Yes 65%
No 24%
Unsure 11%
Do you think there should be a requirement for foods containing GMOs to be labeled?
Do you generally support or oppose the Honolulu Rail project?
The Hawaii legislature is also considering extending the General Excise Tax surcharge on Oahu past its scheduled expiration date in 2022 in order
to help fund the Honolulu Rail Project. What do you think -- do you support or oppose extending the General Excise Tax on Oahu to help fund the
rail project?
2. Caldwell by Age 18-49 50-64 65+
Positive 66% 52% 45%
Negative 27% 33% 42%
Unsure 7% 14% 14%
Caldwell by Ethnicity Caucasian Japanese Filipino Hawaiian Chinese Hispanic Other/Mixed
Positive 46% 70% 67% 57% 51% 70% 32%
Negative 48% 20% 11% 37% 38% 18% 42%
Unsure 6% 10% 22% 6% 11% 13% 26%
Caldwell by Politics Liberal/progressive Moderate Conservative Unsure
Positive 65% 53% 49% 51%
Negative 28% 37% 43% 27%
Unsure 8% 11% 8% 22%
Caldwell by Party ID Democrat Republican Independent Unsure
Positive 55% 61% 47% 34%
Negative 33% 32% 39% 40%
Unsure 12% 7% 14% 26%
Caldwell by Household
Income Less than $50,000 $50,000 - $100,000 $100,000 or more
Positive 54% 51% 53%
Negative 28% 39% 41%
Unsure 18% 10% 6%
Rail Question Crosstabs -- Oahu Only
Rail by Gender Male Female
Positive 52% 37%
Negative 45% 53%
Unsure 3% 10%
3. Rail by Age 18-49 50-64 65+
Positive 60% 37% 33%
Negative 38% 56% 58%
Unsure 2% 7% 9%
Rail by Ethnicity Caucasian Japanese Filipino Hawaiian Chinese Hispanic Other/Mixed
Positive 38% 56% 70% 33% 20% 82% 41%
Negative 56% 39% 23% 66% 80% 18% 51%
Unsure 6% 5% 7% 1% 0% 0% 9%
Rail by Politics Liberal/progressive Moderate Conservative Unsure
Positive 56% 47% 34% 36%
Negative 40% 50% 56% 58%
Unsure 4% 3% 9% 5%
Rail by Party ID Democrat Republican Independent Unsure
Positive 45% 50% 40% 24%
Negative 48% 47% 55% 75%
Unsure 7% 3% 5% 1%
Rail by Household Income Less than $50,000 $50,000 - $100,000 $100,000 or more
Positive 51% 35% 51%
Negative 38% 60% 47%
Unsure 10% 6% 2%
Excise Tax Crosstabs -- Oahu only
Excise Tax by Gender Male Female
Positive 44% 28%
Negative 53% 56%
Unsure 3% 17%
4. Excise Tax by Age 18-49 50-64 65+
Positive 49% 30% 28%
Negative 39% 66% 62%
Unsure 11% 4% 10%
Excise Tax by Ethnicity Caucasian Japanese Filipino Hawaiian Chinese Hispanic Other/Mixed
Positive 27% 48% 12% 35% 39% 70% 32%
Negative 64% 46% 34% 62% 58% 18% 58%
Unsure 9% 5% 54% 3% 3% 13% 10%
Excise Tax by Politics Liberal/progressive Moderate Conservative Unsure
Positive 45% 38% 18% 43%
Negative 49% 55% 64% 49%
Unsure 6% 6% 19% 8%
Excise Tax by Party ID Democrat Republican Independent Unsure
Positive 35% 29% 41% 26%
Negative 56% 56% 52% 67%
Unsure 9% 16% 7% 7%
Excise Tax by Household
Income Less than $50,000 $50,000 - $100,000 $100,000 or more
Positive 29% 36% 39%
Negative 45% 63% 52%
Unsure 26% 0% 9%