Civil Beat Poll October 2018 -- Constitutional Amendment
•
0 likes•674 views

Civil Beat Poll October 2018 -- Constitutional Amendment

Recommended
Recommended
More Related Content
What's hot
What's hot (20)
Similar to Civil Beat Poll October 2018 -- Constitutional Amendment
Similar to Civil Beat Poll October 2018 -- Constitutional Amendment (20)
More from Honolulu Civil Beat
More from Honolulu Civil Beat (20)
Recently uploaded
Recently uploaded (15)
Civil Beat Poll October 2018 -- Constitutional Amendment
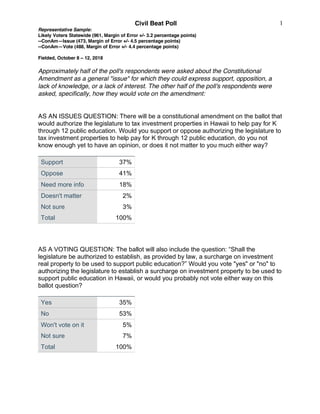
- 1. Civil Beat Poll Representative Sample: Likely Voters Statewide (961, Margin of Error +/- 3.2 percentage points) --ConAm—Issue (473, Margin of Error +/- 4.5 percentage points) --ConAm—Vote (488, Margin of Error +/- 4.4 percentage points) Fielded, October 8 – 12, 2018 1 Approximately half of the poll's respondents were asked about the Constitutional Amendment as a general "issue" for which they could express support, opposition, a lack of knowledge, or a lack of interest. The other half of the poll's respondents were asked, specifically, how they would vote on the amendment: AS AN ISSUES QUESTION: There will be a constitutional amendment on the ballot that would authorize the legislature to tax investment properties in Hawaii to help pay for K through 12 public education. Would you support or oppose authorizing the legislature to tax investment properties to help pay for K through 12 public education, do you not know enough yet to have an opinion, or does it not matter to you much either way? Support 37% Oppose 41% Need more info 18% Doesn't matter 2% Not sure 3% Total 100% AS A VOTING QUESTION: The ballot will also include the question: “Shall the legislature be authorized to establish, as provided by law, a surcharge on investment real property to be used to support public education?” Would you vote "yes" or "no" to authorizing the legislature to establish a surcharge on investment property to be used to support public education in Hawaii, or would you probably not vote either way on this ballot question? Yes 35% No 53% Won't vote on it 5% Not sure 7% Total 100%
- 2. Civil Beat Poll Representative Sample: Likely Voters Statewide (961, Margin of Error +/- 3.2 percentage points) --ConAm—Issue (473, Margin of Error +/- 4.5 percentage points) --ConAm—Vote (488, Margin of Error +/- 4.4 percentage points) Fielded, October 8 – 12, 2018 2 CROSSTABS—ConAm Issue Male Female Support 36% 36% Oppose 47% 34% Need info 13% 23% Does not matter 1% 3% Unsure 3% 4% Total 100% 100% Under 50 50 or Older Support 43% 33% Oppose 33% 46% Need info 15% 17% Does not matter 4% 1% Unsure 4% 3% Total 100% 100% Caucasian Japanese Filipino Hawaiian Chinese Hispanic Other/Mixed Support 41% 30% 24% 38% 21% 44% 40% Oppose 36% 47% 45% 49% 63% 56% 30% Need info 22% 16% 21% 9% 11% 22% Does not matter 7% Unsure 1% 10% 4% 5% 8% Total 100% 100% 100% 100% 100% 100% 100%
- 3. Civil Beat Poll Representative Sample: Likely Voters Statewide (961, Margin of Error +/- 3.2 percentage points) --ConAm—Issue (473, Margin of Error +/- 4.5 percentage points) --ConAm—Vote (488, Margin of Error +/- 4.4 percentage points) Fielded, October 8 – 12, 2018 3 Liberal/progressive Moderate Conservative Support 50% 29% 30% Oppose 24% 49% 60% Need info 21% 18% 7% Does not matter 4% 2% Unsure 2% 2% 3% Total 100% 100% 100% Democrat Republican Independent Support 43% 34% 17% Oppose 31% 53% 63% Need info 21% 10% 15% Does not matter 3% Unsure 2% 4% 4% Total 100% 100% 100% College Degree No college Degree Support 41% 32% Oppose 43% 41% Need info 14% 20% Does not matter 5% Unsure 2% 2% Total 100% 100%
- 4. Civil Beat Poll Representative Sample: Likely Voters Statewide (961, Margin of Error +/- 3.2 percentage points) --ConAm—Issue (473, Margin of Error +/- 4.5 percentage points) --ConAm—Vote (488, Margin of Error +/- 4.4 percentage points) Fielded, October 8 – 12, 2018 4 Less than $50,000 $50,000 - $100,000 More than $100,000 Support 44% 43% 30% Oppose 34% 43% 57% Need info 20% 15% 12% Does not matter 1% Unsure 1% 1% Total 100% 100% 100% Oahu_1 Oahu_2 Hawaii Maui Kauai Support 38% 31% 29% 32% 59% Oppose 39% 51% 51% 32% 31% Need info 16% 18% 20% 34% 10% Does not matter 3% Unsure 5% 2% Total 100% 100% 100% 100% 100%
- 5. Civil Beat Poll Representative Sample: Likely Voters Statewide (961, Margin of Error +/- 3.2 percentage points) --ConAm—Issue (473, Margin of Error +/- 4.5 percentage points) --ConAm—Vote (488, Margin of Error +/- 4.4 percentage points) Fielded, October 8 – 12, 2018 5 CROSSTABS—ConAm Vote Male Female Yes 36% 35% No 53% 52% Will not vote 6% 5% Unsure 6% 9% Total 100% 100% Under 50 50 or Older Yes 46% 32% No 47% 54% Will not vote 3% 6% Unsure 3% 9% Total 100% 100% Caucasian Japanese Filipino Hawaiian Chinese Hispanic Other/Mixed Yes 41% 32% 20% 30% 48% 56% 45% No 49% 56% 64% 63% 52% 22% 41% Will not vote 5% 7% 4% 3% 5% Unsure 5% 7% 12% 5% 22% 9% Total 100% 100% 100% 100% 100% 100% 100%
- 6. Civil Beat Poll Representative Sample: Likely Voters Statewide (961, Margin of Error +/- 3.2 percentage points) --ConAm—Issue (473, Margin of Error +/- 4.5 percentage points) --ConAm—Vote (488, Margin of Error +/- 4.4 percentage points) Fielded, October 8 – 12, 2018 6 Liberal/progressive Moderate Conservative Yes 55% 33% 19% No 37% 54% 74% Will not vote 4% 7% 1% Unsure 4% 6% 6% Total 100% 100% 100% Democrat Republican Independent Yes 45% 17% 31% No 41% 77% 60% Will not vote 6% 1% 3% Unsure 7% 5% 6% Total 100% 100% 100% College Degree No college Degree Yes 41% 31% No 49% 58% Will not vote 5% 2% Unsure 5% 9% Total 100% 100%
- 7. Civil Beat Poll Representative Sample: Likely Voters Statewide (961, Margin of Error +/- 3.2 percentage points) --ConAm—Issue (473, Margin of Error +/- 4.5 percentage points) --ConAm—Vote (488, Margin of Error +/- 4.4 percentage points) Fielded, October 8 – 12, 2018 7 Less than $50,000 $50,000 - $100,000 More than $100,000 Yes 44% 43% 35% No 43% 48% 57% Will not vote 4% 4% 6% Unsure 9% 6% 2% Total 100% 100% 100% Oahu_1 Oahu_2 Hawaii Maui Kauai Yes 33% 33% 32% 51% 33% No 54% 52% 60% 42% 44% Will not vote 7% 7% 1% 11% Unsure 6% 7% 7% 7% 11% Total 100% 100% 100% 100% 100%
- 8. Civil Beat Poll Representative Sample: Likely Voters Statewide (961, Margin of Error +/- 3.2 percentage points) --ConAm—Issue (473, Margin of Error +/- 4.5 percentage points) --ConAm—Vote (488, Margin of Error +/- 4.4 percentage points) Fielded, October 8 – 12, 2018 8 About the Poll About the Poll Civil Beat surveyed a random sample of 961 likely General Election voters statewide. Calls were made from October 8 – 12, 2018, using interactive voice response technology (touch-tone polling). Cell phones were contacted by live call-agents who obtained consent and then patched consenting participants through to the same recorded survey as landline respondents. The sample consisted of 70% landlines and 30% cellphones. Results were balanced for gender, age, ancestry/ethnicity/race, county and Congressional District of residence, education, and likelihood of voting. The margin of error +/- 3.2 percentage points. Other sources of error, such as imperfect response rates and design effect (the effect of weighting results based on demographics) are also common in public opinion research and may affect the results. The adjusted margin of error, accounting for the design effect is +/- 4.3 percentage points. The margin of error for any crosstabulated result is larger than the margin of error of the corresponding topline result. Some columns may sum to totals slightly higher or lower than 100% due to rounding. The poll was conducted by Civil Beat working with Merriman River Group, a full-service consulting organization specializing in opinion research, election management, and communications.