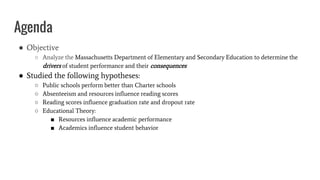
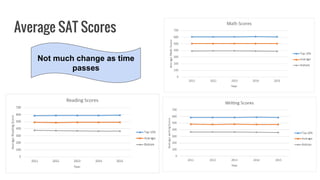
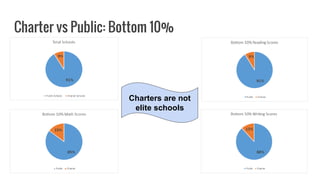
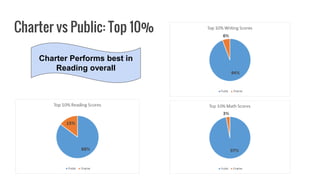
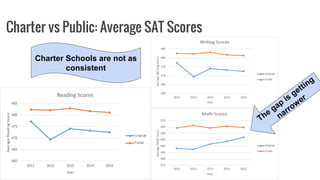
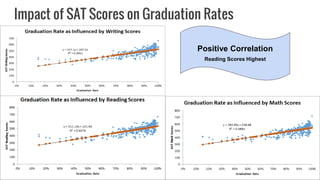
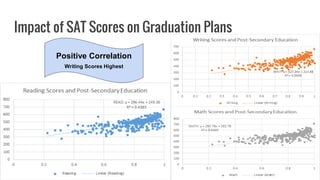
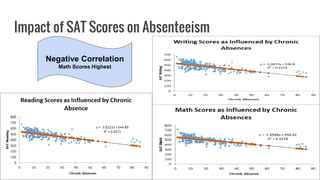
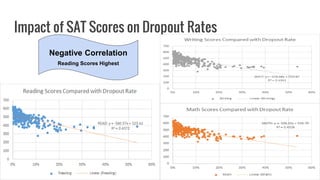
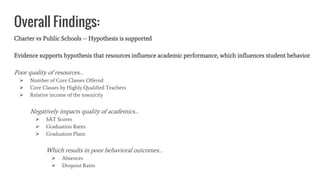
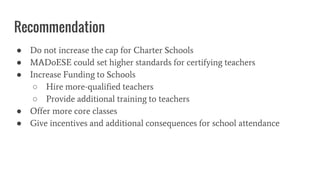
Analysis of Massachusetts
Department of Elementary and
Secondary Education
Shannon Downey, Marissa Elizardo, Eliza
Hodge, and Savanah Miles
What is the MADoESE?
● Run by the Massachusetts Board of Education
● Responsibilities Include:
○ Granting and renewing charter school applications
○ Developing and implementing the Massachusetts Comprehensive Assessment System (MCAS)
○ Submitting yearly budget proposals for public education to the Massachusetts General Court
○ Setting the standards for and certifying teachers, principals, and superintendents
○ Intervening to better the achievement of underperforming districts in the Commonwealth.
Data Set Background
● Approximately 1800 schools
○ Pre-Kindergarten to 12th grade
○ All public and charter schools in MA
● Data distributed into 7 tabs
○ SATs
○ Graduation Rate
○ Educator Performance
○ Student Teacher Ratio
○ Attendance & Retention
○ Discipline
○ High School Graduation Plans
● Asked to analyze high schools
Agenda
● Objective
○ Analyze the Massachusetts Department of Elementary and Secondary Education to determine the
drivers of student performance and their consequences
● Studied the following hypotheses:
○ Public schools perform better than Charter schools
○ Absenteeism and resources influence reading scores
○ Reading scores influence graduation rate and dropout rate
○ Educational Theory:
■ Resources influence academic performance
■ Academics influence student behavior
Hypothesis: Public Schools perform better
than Charter Schools
Average SAT Scores
Not much change as time
passes
Charter vs Public: Bottom 10%
Charters are not
elite schools
Charter vs Public: Top 10%
Charter Performs best in
Reading overall
Charter vs Public: Average SAT Scores
Charter Schools are not as
consistent
Hypothesis: Resources influence Academic
Performance
Impact of School Resources on SAT Scores
More Classes =
higher SAT Scores
Better quality
teachers = higher
SAT Scores
Impact of Real Estate Wealth on Academic Performance
As home prices increase,
SAT scores increase.
Hypothesis: Academic Performance
influences Student Behaviors
Impact of SAT Scores on Graduation Rates
Positive Correlation
Reading Scores Highest
Impact of SAT Scores on Graduation Plans
Positive Correlation
Writing Scores Highest
Impact of SAT Scores on Absenteeism
Negative Correlation
Math Scores Highest
Impact of SAT Scores on Dropout Rates
Negative Correlation
Reading Scores Highest
Conclusion of Findings & Recommendations
Overall Findings:
Charter vs Public Schools -- Hypothesis is supported
Evidence supports hypothesis that resources influence academic performance, which influences student behavior
Poor quality of resources…
 Number of Core Classes Offered
 Core Classes by Highly Qualified Teachers
 Relative income of the town/city
Negatively impacts quality of academics…
 SAT Scores
 Graduation Rates
 Graduation Plans
Which results in poor behavioral outcomes…
 Absences
 Dropout Rates
Recommendation
● Do not increase the cap for Charter Schools
● MADoESE could set higher standards for certifying teachers
● Increase Funding to Schools
○ Hire more-qualified teachers
○ Provide additional training to teachers
● Offer more core classes
● Give incentives and additional consequences for school attendance
Bibliography
Emery, Debbie. "5 Key Indicators of School Performance." Flippen Group. Flippen Group, 08 Mar. 2014. Web. 14 Nov. 2016.
http://flippengroup.com/5-key-indicators-school-performance-2/
Hein, Vanessa. "Predictors of Post-Secondary Success." College Career Readiness Success Center. American Institutes for Research, 1 Nov. 2013.
Web. 14 Nov. 2016 .http://www.ccrscenter.org/sites/default/files/CCRS%20Center_Predictors%20of%20Postsecondary%20Success_final_0.pdf
Fulks, Janet. "Reading May Be the Key to Unlocking Basic Skills Success." ASCC. Academic Senate for California Community Colleges, 1 Apr.
2010. Web. 14 Nov. 2016. http://www.asccc.org/content/reading-may-be-key-unlocking-basic-skills-success
Sanchez, Claudio. “The Charter School vs. Public School Debate Continues.” NPR. NPR. 16 July, 2013. 14 Nov. 2016.
http://www.npr.org/2013/07/16/201109021/the-charter-school-vs-public-school-debate-continues
Goldfarb, Zachary. “These Four Charts Show how the SAT Favors Rich, Educated Families.” The Washington Post. The Washington Post. 5 March,
2014. 14 Nov. 2016. https://www.washingtonpost.com/news/wonk/wp/2014/03/05/these-four-charts-show-how-the-sat-favors-the-rich
Srahota, Hilary. “Average Student has Better Chance of Graduating.” Center on Education and the Workforce. Georgetown University. 21 June,
2016. 14 Nov. 2016. https://cew.georgetown.edu/wp-content/uploads/MismatchFisherUT_pressrelease_6-21-16.pdf
Whitehouse “Increasing College Opportunity for Low-Income Students.” The Executive Office of the President. Whitehouse.gov. January 2014. 14
Nov. 2016. https://www.whitehouse.gov/sites/default/files/docs/white_house_report_on_increasing_college_opportunity_for_low-income_students

CIS Data Analysis Project PowerPoint

  • 1.
    Analysis of Massachusetts Departmentof Elementary and Secondary Education Shannon Downey, Marissa Elizardo, Eliza Hodge, and Savanah Miles
  • 2.
    What is theMADoESE? ● Run by the Massachusetts Board of Education ● Responsibilities Include: ○ Granting and renewing charter school applications ○ Developing and implementing the Massachusetts Comprehensive Assessment System (MCAS) ○ Submitting yearly budget proposals for public education to the Massachusetts General Court ○ Setting the standards for and certifying teachers, principals, and superintendents ○ Intervening to better the achievement of underperforming districts in the Commonwealth.
  • 3.
    Data Set Background ●Approximately 1800 schools ○ Pre-Kindergarten to 12th grade ○ All public and charter schools in MA ● Data distributed into 7 tabs ○ SATs ○ Graduation Rate ○ Educator Performance ○ Student Teacher Ratio ○ Attendance & Retention ○ Discipline ○ High School Graduation Plans ● Asked to analyze high schools
  • 4.
    Agenda ● Objective ○ Analyzethe Massachusetts Department of Elementary and Secondary Education to determine the drivers of student performance and their consequences ● Studied the following hypotheses: ○ Public schools perform better than Charter schools ○ Absenteeism and resources influence reading scores ○ Reading scores influence graduation rate and dropout rate ○ Educational Theory: ■ Resources influence academic performance ■ Academics influence student behavior
  • 5.
    Hypothesis: Public Schoolsperform better than Charter Schools
  • 6.
    Average SAT Scores Notmuch change as time passes
  • 7.
    Charter vs Public:Bottom 10% Charters are not elite schools
  • 8.
    Charter vs Public:Top 10% Charter Performs best in Reading overall
  • 9.
    Charter vs Public:Average SAT Scores Charter Schools are not as consistent
  • 10.
    Hypothesis: Resources influenceAcademic Performance
  • 11.
    Impact of SchoolResources on SAT Scores More Classes = higher SAT Scores Better quality teachers = higher SAT Scores
  • 12.
    Impact of RealEstate Wealth on Academic Performance As home prices increase, SAT scores increase.
  • 13.
  • 14.
    Impact of SATScores on Graduation Rates Positive Correlation Reading Scores Highest
  • 15.
    Impact of SATScores on Graduation Plans Positive Correlation Writing Scores Highest
  • 16.
    Impact of SATScores on Absenteeism Negative Correlation Math Scores Highest
  • 17.
    Impact of SATScores on Dropout Rates Negative Correlation Reading Scores Highest
  • 18.
    Conclusion of Findings& Recommendations
  • 19.
    Overall Findings: Charter vsPublic Schools -- Hypothesis is supported Evidence supports hypothesis that resources influence academic performance, which influences student behavior Poor quality of resources…  Number of Core Classes Offered  Core Classes by Highly Qualified Teachers  Relative income of the town/city Negatively impacts quality of academics…  SAT Scores  Graduation Rates  Graduation Plans Which results in poor behavioral outcomes…  Absences  Dropout Rates
  • 20.
    Recommendation ● Do notincrease the cap for Charter Schools ● MADoESE could set higher standards for certifying teachers ● Increase Funding to Schools ○ Hire more-qualified teachers ○ Provide additional training to teachers ● Offer more core classes ● Give incentives and additional consequences for school attendance
  • 21.
    Bibliography Emery, Debbie. "5Key Indicators of School Performance." Flippen Group. Flippen Group, 08 Mar. 2014. Web. 14 Nov. 2016. http://flippengroup.com/5-key-indicators-school-performance-2/ Hein, Vanessa. "Predictors of Post-Secondary Success." College Career Readiness Success Center. American Institutes for Research, 1 Nov. 2013. Web. 14 Nov. 2016 .http://www.ccrscenter.org/sites/default/files/CCRS%20Center_Predictors%20of%20Postsecondary%20Success_final_0.pdf Fulks, Janet. "Reading May Be the Key to Unlocking Basic Skills Success." ASCC. Academic Senate for California Community Colleges, 1 Apr. 2010. Web. 14 Nov. 2016. http://www.asccc.org/content/reading-may-be-key-unlocking-basic-skills-success Sanchez, Claudio. “The Charter School vs. Public School Debate Continues.” NPR. NPR. 16 July, 2013. 14 Nov. 2016. http://www.npr.org/2013/07/16/201109021/the-charter-school-vs-public-school-debate-continues Goldfarb, Zachary. “These Four Charts Show how the SAT Favors Rich, Educated Families.” The Washington Post. The Washington Post. 5 March, 2014. 14 Nov. 2016. https://www.washingtonpost.com/news/wonk/wp/2014/03/05/these-four-charts-show-how-the-sat-favors-the-rich Srahota, Hilary. “Average Student has Better Chance of Graduating.” Center on Education and the Workforce. Georgetown University. 21 June, 2016. 14 Nov. 2016. https://cew.georgetown.edu/wp-content/uploads/MismatchFisherUT_pressrelease_6-21-16.pdf Whitehouse “Increasing College Opportunity for Low-Income Students.” The Executive Office of the President. Whitehouse.gov. January 2014. 14 Nov. 2016. https://www.whitehouse.gov/sites/default/files/docs/white_house_report_on_increasing_college_opportunity_for_low-income_students

Editor's Notes