
Download to read offline

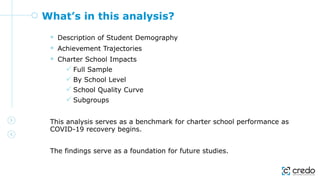
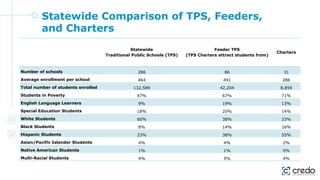
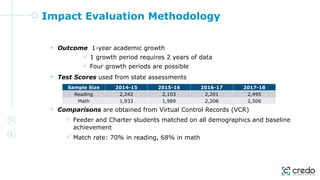
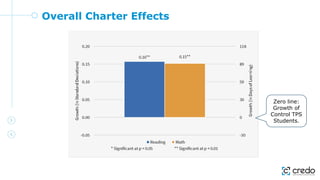
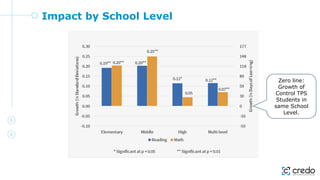
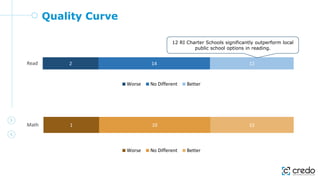
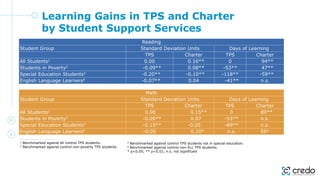
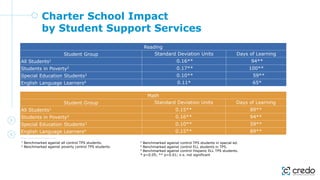
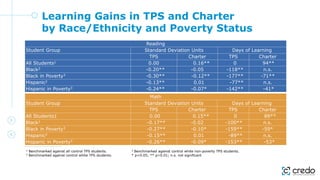
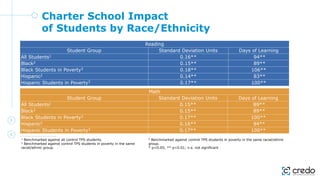
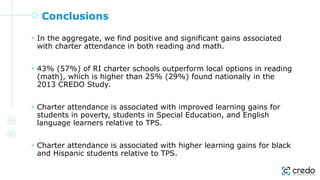
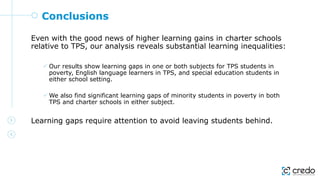

This document analyzes charter school performance in Rhode Island. It finds that: 1) Students attending charter schools in Rhode Island experience significantly higher academic growth compared to similar students in traditional public schools, with 43% of charter schools outperforming local traditional public school options in reading and 57% outperforming in math. 2) Charter school attendance is associated with improved learning gains for disadvantaged student groups like those in poverty, English learners, and students with special needs relative to traditional public schools. 3) Charter school attendance is also linked to higher learning gains for Black and Hispanic students compared to traditional public schools. However, the analysis still finds substantial learning inequalities that exist for disadvantaged student


