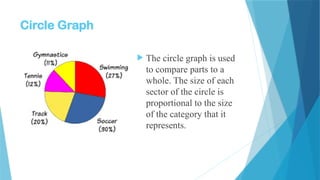
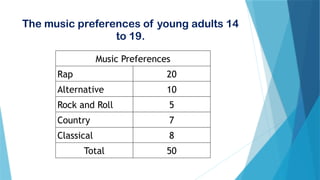
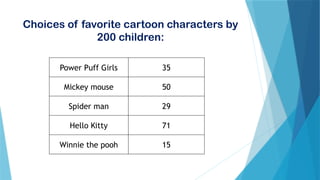
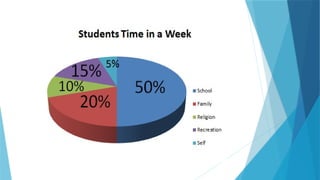
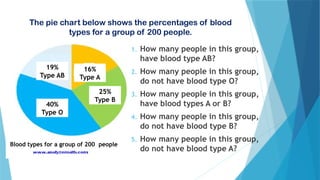
This document explains how to create line and circle graphs, highlighting their purposes and construction methods. It provides specific data examples, including budget allocations for a family and music preferences of young adults, as well as favorite cartoon characters among children. Additionally, it presents blood type distributions within a group of 200 people and poses related statistical questions.


![Presenting-Experimental-Data-Grade-8 [Autosaved].pptx](https://cdn.slidesharecdn.com/ss_thumbnails/presenting-experimental-data-grade-8autosaved-240925105557-9775d0ae-thumbnail.jpg?width=640&height=640&fit=bounds)
![Presenting-Experimental-Data-Grade-8 [Autosaved].pptx](https://cdn.slidesharecdn.com/ss_thumbnails/presenting-experimental-data-grade-8autosaved-240925104859-008a237a-thumbnail.jpg?width=640&height=640&fit=bounds)


