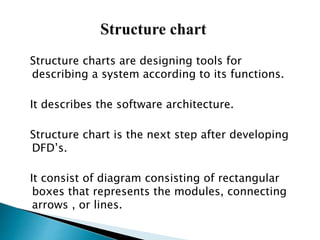
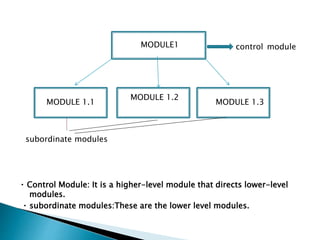
SYSTEM ANALYSIS & DESIGNING
ARJUN.R
C5
Structure charts are designing tools for
describing a system according to its functions.
It describes the software architecture.
Structure chart is the next step after developing
DFD’s.
It consist of diagram consisting of rectangular
boxes that represents the modules, connecting
arrows , or lines.
control module
subordinate modules
Control Module: It is a higher-level module that directs lower-level
modules.
subordinate modules:These are the lower level modules.
lMODULE1
MODULE 1.1
MODULE 1.2
1.2
MOMODULE 1.3
Structure chart shows the system module and
their relationship between them.
It shows the size and complexity of the system.
There are two types of structure charts . They are
1 HIPO Chart
2 Warnier-orr Diagram
The most popular type of structure chart is
the HIPO chart.
HIPO stands for Hierarchy plus Input
Processing Output.
Actually ,two types of charts make up a HIPO
package.
Hierarchy chart and IPO chart.
One shows the hiearchy,the other depicts the
input,processing,and outputs.
Hierarchy chart describes the hierarchy of
system functions in a top to bottom manner.
The system is the top level.The second level is
made up of the major functions of the
system.For the third level ,each of the major
function is broken down into subfunctions.
It is a designphase tool with adetailed level
about equal to intermediate level system
flowcharts
Customer billing system hierarchy
Customer billing
system
Generate outputsUpdate master fileInput transactions
Print
customer
bills
Update
customer
balance
Display
charge
sales
summary
Delete
inactive
accounts
Add new
accounts
Build
transaction
file
Cdata
edit
The second of the HIPO package chart is IPO chart.
IPO chart decribes each functional modules of
hierarchy chart by listing inputs,processing
steps,and outputs.
IPO charts do not show hierarchy. It is normally
prepared for each function shown on the
hierarchy chart.
IPO chart for customer billing system hierarchy chart
input process output
IPO charts are used for input –output analysis
1.Sales data
2.Payment data
3.New accounts
4.Inactive
accounts
1.Verify account
numbers
2.validate all
numeric fields
3.check for valid
transaction codes
1.transaction file
2.Error report
The second type of structure chart is Warnier-orr
diagram.
Warnier-orr diagram is essentially a hierarchy chart
drawn from left to right rather than top to bottom.
It uses brackets to group subfunctions and relate them
to their higher level functions.
They are simple in appearance and easy to understand.
It gives more emphasize on functions rather than data
flow.
Warnier-orr diagram for customer billing system
Customer billing
system
Input
transactions
Update master
file
Generate
outputs
Cdata edit
Build transaction file
Add new accounts
Delete inactive accounts
update customer balance
Display charge sales
summary
Print customer bills
DO YOU HAVE ANY QUESTIONS ?
????????
THANK YOU

Structure chart

  • 1.
    SYSTEM ANALYSIS &DESIGNING ARJUN.R C5
  • 2.
    Structure charts aredesigning tools for describing a system according to its functions. It describes the software architecture. Structure chart is the next step after developing DFD’s. It consist of diagram consisting of rectangular boxes that represents the modules, connecting arrows , or lines.
  • 3.
    control module subordinate modules ControlModule: It is a higher-level module that directs lower-level modules. subordinate modules:These are the lower level modules. lMODULE1 MODULE 1.1 MODULE 1.2 1.2 MOMODULE 1.3
  • 4.
    Structure chart showsthe system module and their relationship between them. It shows the size and complexity of the system. There are two types of structure charts . They are 1 HIPO Chart 2 Warnier-orr Diagram
  • 5.
    The most populartype of structure chart is the HIPO chart. HIPO stands for Hierarchy plus Input Processing Output. Actually ,two types of charts make up a HIPO package. Hierarchy chart and IPO chart. One shows the hiearchy,the other depicts the input,processing,and outputs.
  • 6.
    Hierarchy chart describesthe hierarchy of system functions in a top to bottom manner. The system is the top level.The second level is made up of the major functions of the system.For the third level ,each of the major function is broken down into subfunctions. It is a designphase tool with adetailed level about equal to intermediate level system flowcharts
  • 7.
    Customer billing systemhierarchy Customer billing system Generate outputsUpdate master fileInput transactions Print customer bills Update customer balance Display charge sales summary Delete inactive accounts Add new accounts Build transaction file Cdata edit
  • 8.
    The second ofthe HIPO package chart is IPO chart. IPO chart decribes each functional modules of hierarchy chart by listing inputs,processing steps,and outputs. IPO charts do not show hierarchy. It is normally prepared for each function shown on the hierarchy chart.
  • 9.
    IPO chart forcustomer billing system hierarchy chart input process output IPO charts are used for input –output analysis 1.Sales data 2.Payment data 3.New accounts 4.Inactive accounts 1.Verify account numbers 2.validate all numeric fields 3.check for valid transaction codes 1.transaction file 2.Error report
  • 10.
    The second typeof structure chart is Warnier-orr diagram. Warnier-orr diagram is essentially a hierarchy chart drawn from left to right rather than top to bottom. It uses brackets to group subfunctions and relate them to their higher level functions. They are simple in appearance and easy to understand. It gives more emphasize on functions rather than data flow.
  • 11.
    Warnier-orr diagram forcustomer billing system Customer billing system Input transactions Update master file Generate outputs Cdata edit Build transaction file Add new accounts Delete inactive accounts update customer balance Display charge sales summary Print customer bills
  • 12.
    DO YOU HAVEANY QUESTIONS ? ????????
  • 13.