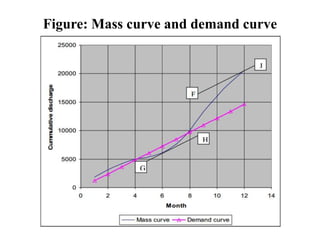
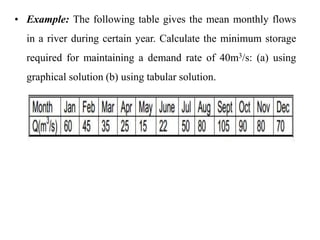
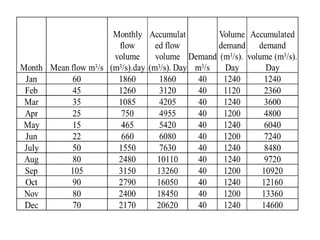
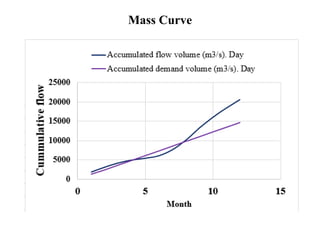
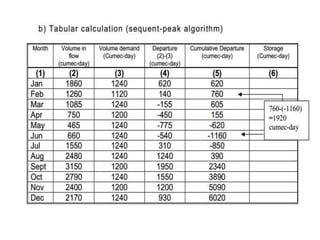
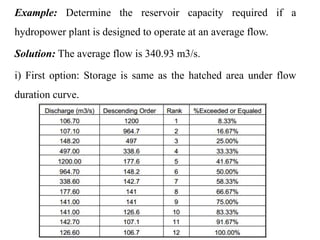
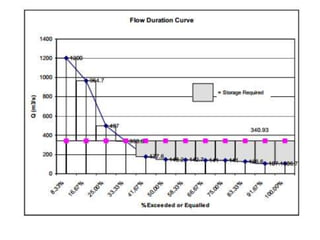
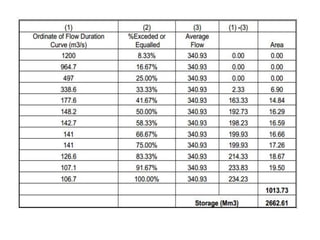
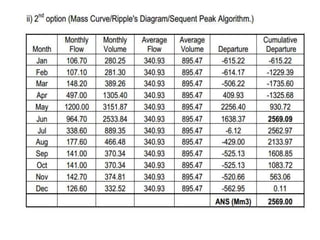
CHAPTER NINE
RESERVOIR CAPACITY DETERMINATION
By Ayansa T.( B.Sc. In Met. And Hydr., M.Sc. In WRE)
Introduction
• The reservoir capacity is a term used to
represent the reservoir storage capacity.
• Its determination is performed using historical
inflow records in the stream at the proposed dam
site.
• There are several methods to determine a
reservoir storage capacity.
Methods to determine a reservoir storage capacity
Mass curve (ripple's) method:
• A mass curve (or mass inflow curve) is a plot of
accumulated flow in a stream against time.
• A mass curve continuously rises as it shows
accumulated flows.
• The slope of the curve at any point indicates the rate
of flow at that particular time.
• A demand curve on the other hand is a plot between
accumulated demand and time.
• If the demand is at a constant rate then the demand
curve is a straight line having its slope equal to the
demand rate.
• However, if the demand is not constant then the
demand will be curved indicating a variable rate of
demand.
• The reservoir capacity required for a specified yield or demand
may be determined by using mass curve and demand curve
using the following steps.
1. A mass curve is prepared from the flow hydrograph for a
number of consecutive years selected from the available stream
flow record such that it includes the most critical or the driest
period.
2. Corresponding to the given rate of demand, a demand curve is
prepared.
3. Lines are drawn parallel to the demand curve and tangential to the
high points G, F etc, of the mass curve
4. The maximum vertical intercepts X1Y1, X2Y2, etc. between the
tangential lines drawn in step 3 and the mass curves are
measured.
5. The largest of the maximum vertical intercepts X1Y1, X2Y2 etc.,
determined in step 4 represents the reservoir capacity required to
satisfy the given demand.
• However, the requirement of storage so obtained would be the net
storage that must be available for utilization and it must be
increased by the amount of water lost by evaporation and
seepage.
Figure: Mass curve and demand curve
• Example: The following table gives the mean monthly flows
in a river during certain year. Calculate the minimum storage
required for maintaining a demand rate of 40m3/s: (a) using
graphical solution (b) using tabular solution.
Mass Curve
Example: Determine the reservoir capacity required if a
hydropower plant is designed to operate at an average flow.
Solution: The average flow is 340.93 m3/s.
i) First option: Storage is same as the hatched area under flow
duration curve.
Reservoirs and sediments
• In the design of dam, it is important to assess the magnitude of
sediment deposition in the reservoir.
• The problem can be divided in two parts:
1. How much sediments enter the reservoir
2. What is the trap efficiency of the reservoir
• In a detailed study, the sediment size distributions also have to
be determined for question 1.
• Question 2 may also involve determining the location of the
deposits and the concentration and grain size distribution of the
sediments entering the water intakes.
• In general, there are two approaches to the sedimentation
problem:
1. The reservoir is constructed so large that it will take a very long
time to fill. The economical value of the project will thereby be
maintained.
2. The reservoir is designed relatively small and the dam gates are
constructed relatively large, so that it is possible to remove the
sediments regularly by flushing. The gates are opened, lowering
the water level in the reservoir, which increases the water
velocity. The sediment transport capacity is increased, causing
erosion of the deposits.
• A medium sized reservoir will be the least beneficial.
• Then it will take relatively short time to fill the reservoir, and
the size is so large that only a small part of the sediments are
removed by flushing.
• The flushing has to be done while the water discharge in to the
reservoir is relatively high.
• The water will erode the deposits to a cross-stream magnitude
similar to the normal width of the river.
• A long and narrow reservoir will therefore be more effectively
flushed than a short and wide geometry.
• For the later, the sediment deposits may remain on the sides.
• The flushing of a reservoir may be investigated by physical
model studies.
• Another question is the location of sediment deposits.
• Figure below shows a longitudinal profile of the reservoir.
• There is a dead storage below the lowest level the water can be
withdrawn.
• This storage may be filled with sediments without affecting the
operation of the reservoir.
Figure: Longitudinal profile of a reservoir. HRW is the highest regulated
water level. The reservoir volume below LRW is called the dead storage, as
this can be used.
Sediment Load Prediction
• Rough estimates of sediment load may be taken from regional
data.
• Often the sediment yield in the area is known from neighboring
catchments.
• It is then possible to assess the seriousness of the erosion in the
present catchment and estimate rough figures of sediment yield.
• The land use, slope and size of the catchment are important
factors.
Qs is the sediment load, Qw is the water discharge and a and b
are constants, obtained by curve fitting
• The total sediment transport may be estimated by adding 10-22%
to the suspended sediment transport to allow for the bed load
contribution.
Reduction in reservoir capacity
• The useful life of a reservoir gets reduced due to sediment
deposition causing a decrease in its storage capacity.
• The percent of the inflowing sediment which is retained in a
reservoir is called the trap efficiency and it is a function of the
ratio of reservoir capacity to total annual sediment inflow
• The rate at which the capacity of a reservoir is reduced by
sediment deposition depends on
1. The rate of sediment inflow i.e. sediment load
2. The percentage of the sediment inflow trapped in the reservoir,
i.e. trap efficiency
Chapter Nine.ppt

Chapter Nine.ppt

  • 1.
    CHAPTER NINE RESERVOIR CAPACITYDETERMINATION By Ayansa T.( B.Sc. In Met. And Hydr., M.Sc. In WRE)
  • 2.
    Introduction • The reservoircapacity is a term used to represent the reservoir storage capacity. • Its determination is performed using historical inflow records in the stream at the proposed dam site. • There are several methods to determine a reservoir storage capacity.
  • 3.
    Methods to determinea reservoir storage capacity Mass curve (ripple's) method: • A mass curve (or mass inflow curve) is a plot of accumulated flow in a stream against time. • A mass curve continuously rises as it shows accumulated flows. • The slope of the curve at any point indicates the rate of flow at that particular time.
  • 4.
    • A demandcurve on the other hand is a plot between accumulated demand and time. • If the demand is at a constant rate then the demand curve is a straight line having its slope equal to the demand rate. • However, if the demand is not constant then the demand will be curved indicating a variable rate of demand.
  • 5.
    • The reservoircapacity required for a specified yield or demand may be determined by using mass curve and demand curve using the following steps. 1. A mass curve is prepared from the flow hydrograph for a number of consecutive years selected from the available stream flow record such that it includes the most critical or the driest period. 2. Corresponding to the given rate of demand, a demand curve is prepared.
  • 6.
    3. Lines aredrawn parallel to the demand curve and tangential to the high points G, F etc, of the mass curve 4. The maximum vertical intercepts X1Y1, X2Y2, etc. between the tangential lines drawn in step 3 and the mass curves are measured. 5. The largest of the maximum vertical intercepts X1Y1, X2Y2 etc., determined in step 4 represents the reservoir capacity required to satisfy the given demand. • However, the requirement of storage so obtained would be the net storage that must be available for utilization and it must be increased by the amount of water lost by evaporation and seepage.
  • 7.
    Figure: Mass curveand demand curve
  • 8.
    • Example: Thefollowing table gives the mean monthly flows in a river during certain year. Calculate the minimum storage required for maintaining a demand rate of 40m3/s: (a) using graphical solution (b) using tabular solution.
  • 10.
  • 12.
    Example: Determine thereservoir capacity required if a hydropower plant is designed to operate at an average flow. Solution: The average flow is 340.93 m3/s. i) First option: Storage is same as the hatched area under flow duration curve.
  • 16.
    Reservoirs and sediments •In the design of dam, it is important to assess the magnitude of sediment deposition in the reservoir. • The problem can be divided in two parts: 1. How much sediments enter the reservoir 2. What is the trap efficiency of the reservoir • In a detailed study, the sediment size distributions also have to be determined for question 1. • Question 2 may also involve determining the location of the deposits and the concentration and grain size distribution of the sediments entering the water intakes.
  • 17.
    • In general,there are two approaches to the sedimentation problem: 1. The reservoir is constructed so large that it will take a very long time to fill. The economical value of the project will thereby be maintained. 2. The reservoir is designed relatively small and the dam gates are constructed relatively large, so that it is possible to remove the sediments regularly by flushing. The gates are opened, lowering the water level in the reservoir, which increases the water velocity. The sediment transport capacity is increased, causing erosion of the deposits.
  • 18.
    • A mediumsized reservoir will be the least beneficial. • Then it will take relatively short time to fill the reservoir, and the size is so large that only a small part of the sediments are removed by flushing. • The flushing has to be done while the water discharge in to the reservoir is relatively high. • The water will erode the deposits to a cross-stream magnitude similar to the normal width of the river. • A long and narrow reservoir will therefore be more effectively flushed than a short and wide geometry.
  • 19.
    • For thelater, the sediment deposits may remain on the sides. • The flushing of a reservoir may be investigated by physical model studies. • Another question is the location of sediment deposits. • Figure below shows a longitudinal profile of the reservoir. • There is a dead storage below the lowest level the water can be withdrawn. • This storage may be filled with sediments without affecting the operation of the reservoir.
  • 20.
    Figure: Longitudinal profileof a reservoir. HRW is the highest regulated water level. The reservoir volume below LRW is called the dead storage, as this can be used.
  • 21.
    Sediment Load Prediction •Rough estimates of sediment load may be taken from regional data. • Often the sediment yield in the area is known from neighboring catchments. • It is then possible to assess the seriousness of the erosion in the present catchment and estimate rough figures of sediment yield. • The land use, slope and size of the catchment are important factors.
  • 23.
    Qs is thesediment load, Qw is the water discharge and a and b are constants, obtained by curve fitting • The total sediment transport may be estimated by adding 10-22% to the suspended sediment transport to allow for the bed load contribution.
  • 24.
    Reduction in reservoircapacity • The useful life of a reservoir gets reduced due to sediment deposition causing a decrease in its storage capacity. • The percent of the inflowing sediment which is retained in a reservoir is called the trap efficiency and it is a function of the ratio of reservoir capacity to total annual sediment inflow • The rate at which the capacity of a reservoir is reduced by sediment deposition depends on 1. The rate of sediment inflow i.e. sediment load 2. The percentage of the sediment inflow trapped in the reservoir, i.e. trap efficiency