1) A mass curve graphically represents the cumulative inflow into a reservoir over time, usually monthly or yearly. The slope of the mass curve indicates the inflow rate.
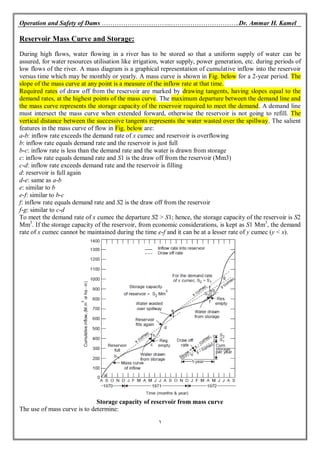
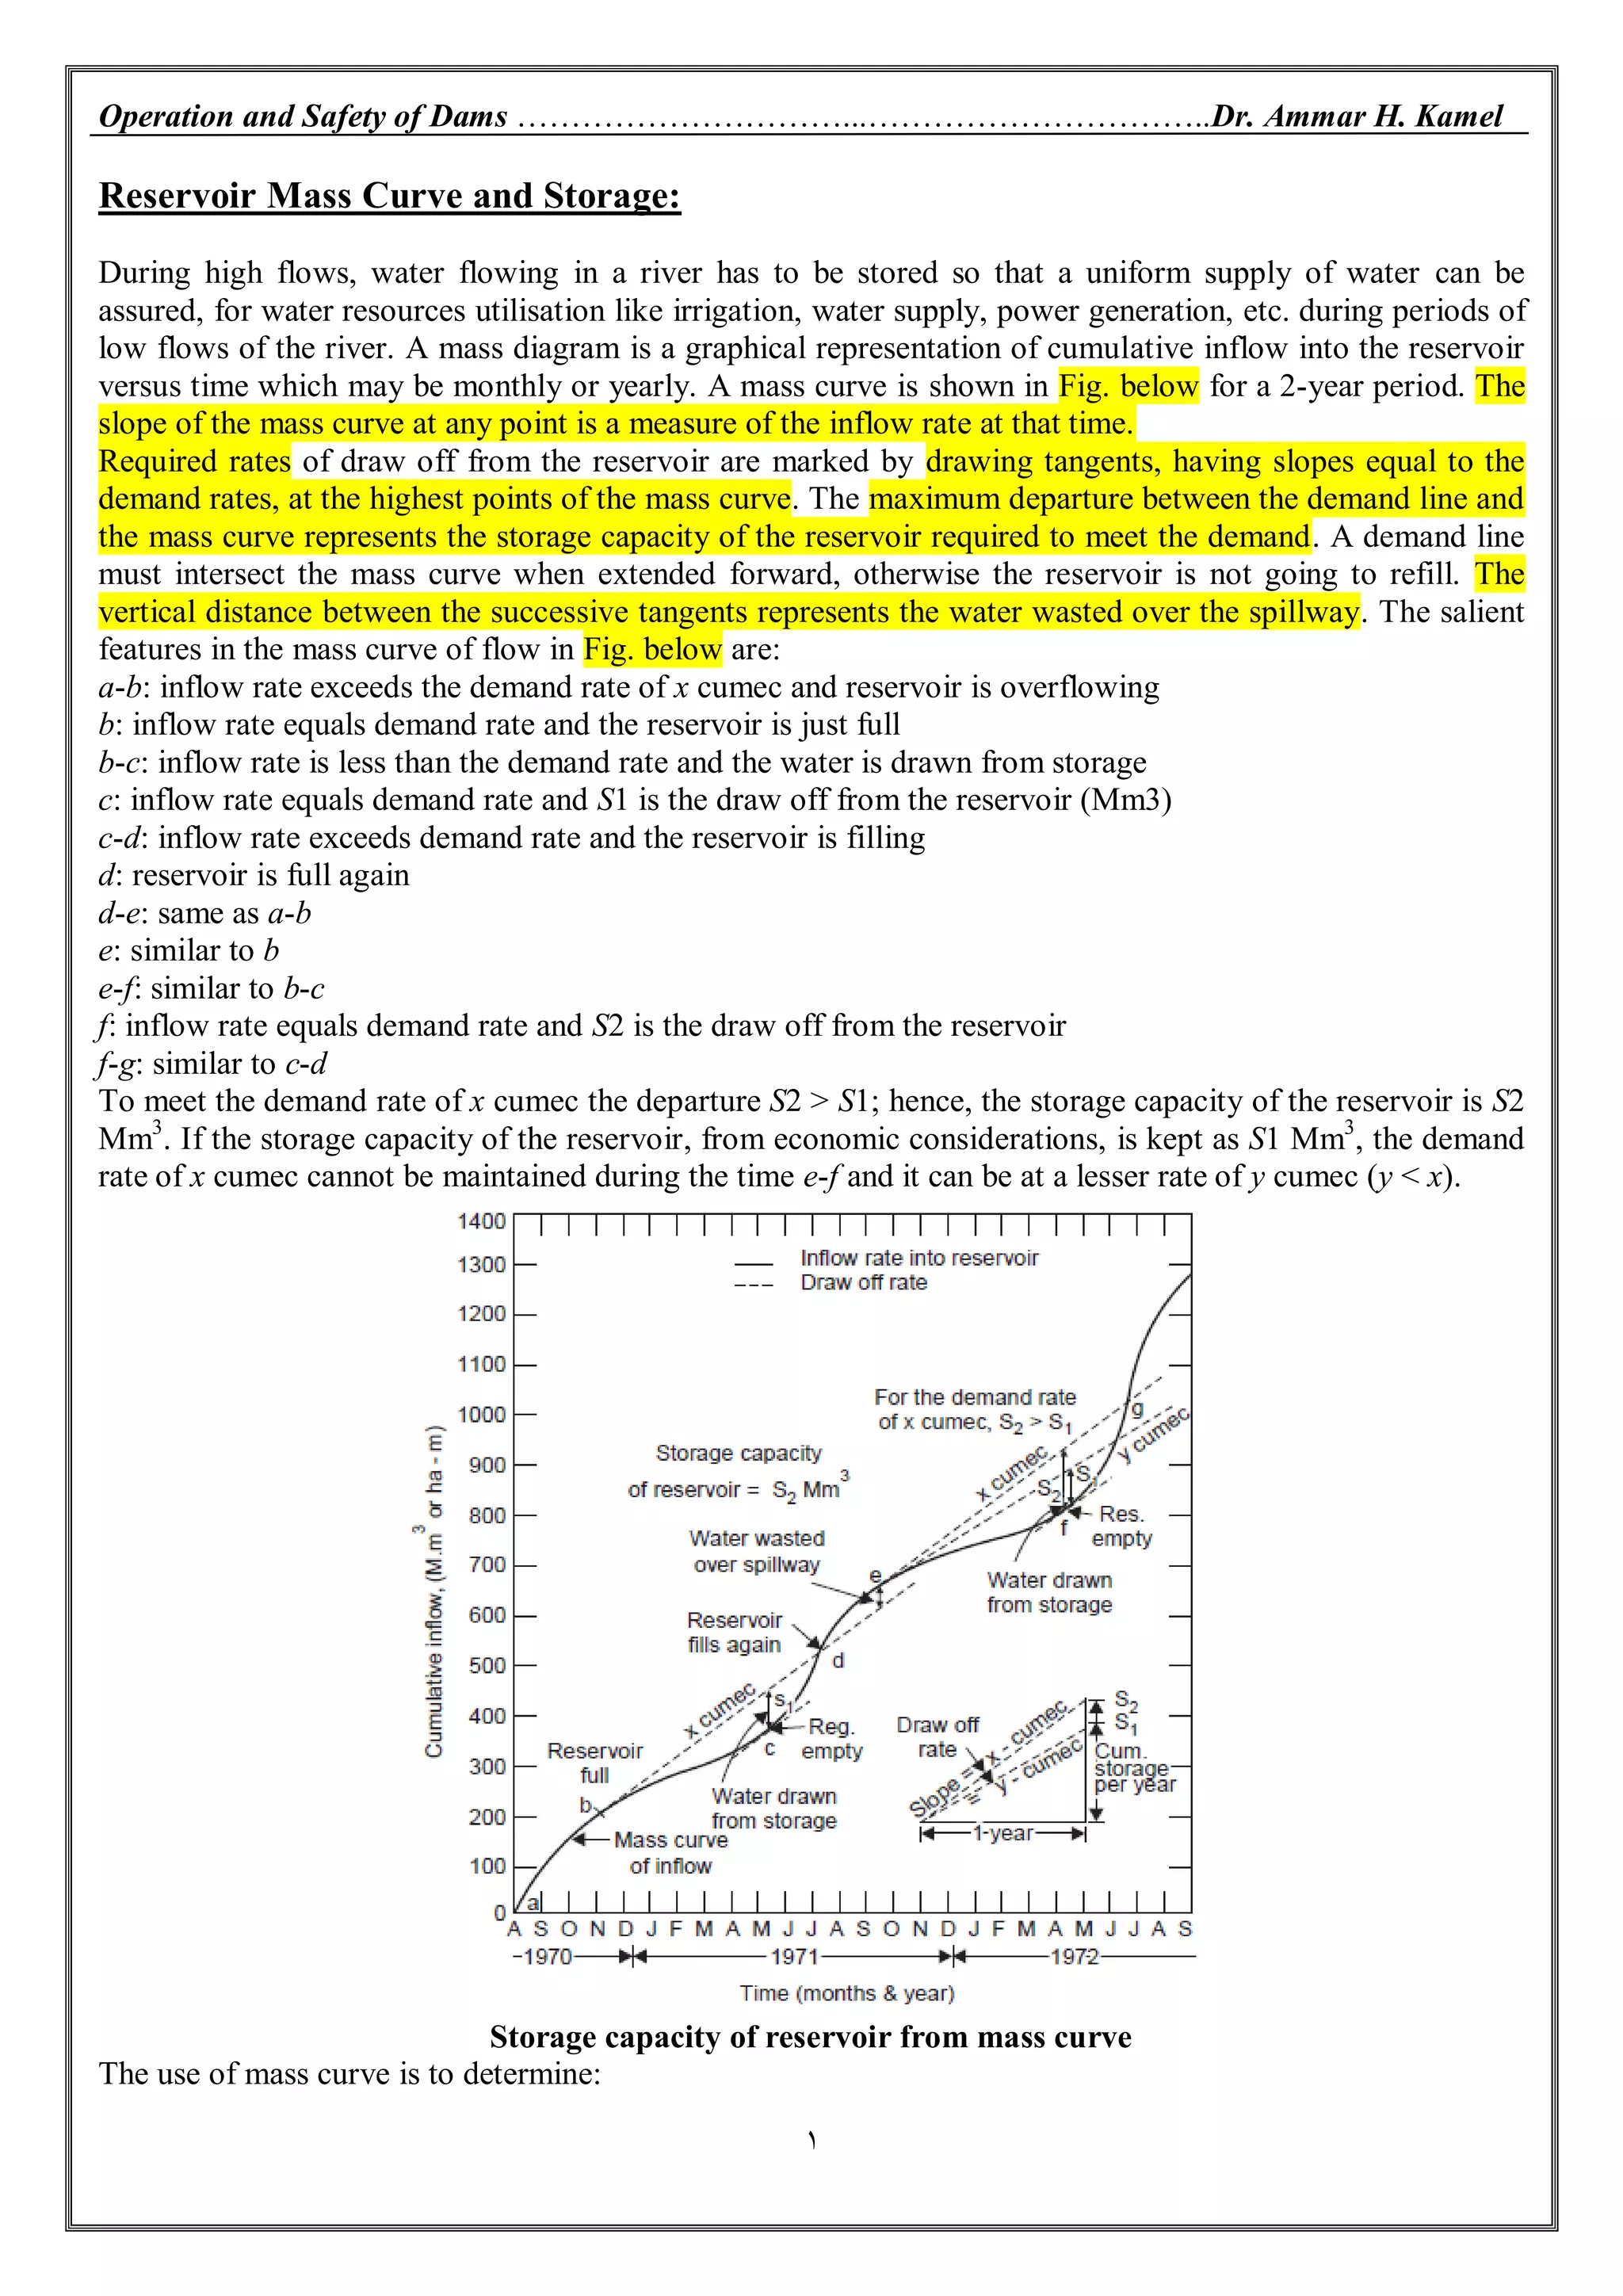
2) Required draw off rates from the reservoir are marked by drawing tangent lines to the high points of the mass curve, with slopes equal to demand rates. The maximum departure between the demand line and mass curve represents the necessary storage capacity.
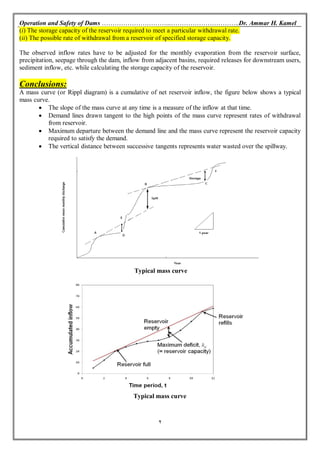
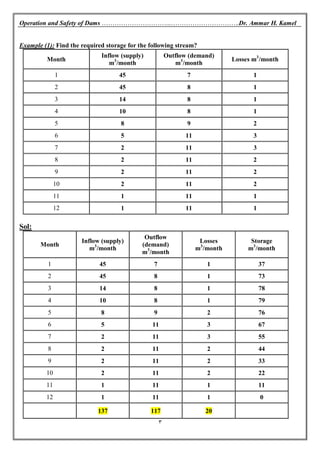
3) A mass curve is used to determine the storage capacity required to meet a given withdrawal rate, and the possible withdrawal rate given a specified storage capacity. It accounts for factors like evaporation and sediment inflow.