Characteristics of single pump and pumps in series and parallel use of indust...TOPENGINEERINGSOLUTIONS
This is a water engineering assignment on Characteristics of single pump and pumps in series and parallel
(Use of Industry Standard Software)
Module Code: NG2S106, Module Title: Water Engineering
Characteristics of single pump and pumps in series and parallel use of indust...TOPENGINEERINGSOLUTIONS
This is a water engineering assignment on Characteristics of single pump and pumps in series and parallel
(Use of Industry Standard Software)
Module Code: NG2S106, Module Title: Water Engineering
Covers the following points:-
Classification of pump
Different types of Heades
Working of Centrifugal and gear pump
Components of pump
Cavitation
failure of the pump with remedies
NPSH
Covers the following points:-
Classification of pump
Different types of Heades
Working of Centrifugal and gear pump
Components of pump
Cavitation
failure of the pump with remedies
NPSH
Крушунските водопади са едно от най-красивите, чудати и забележителни места за посещение в България. До тях се стига с кола. Покрай тях има изградена лека и приятна екопътека, която ги обхожда.
Pumps come in a variety of sizes for a wide range of applications. They can be classified
according to their basic operating principle as dynamic or displacement pumps. Dynamic
pumps can be sub-classified as centrifugal and special effect pumps. Displacement pumps can
be sub-classified as rotary or reciprocating pumps.
A regenerative turbine pump varies from the more familiar centrifugal pump mostly in the design of its impeller. This design difference makes the regenerative turbine pump uniquely suited for low NPSH (Net Positive Suction Head) applications, among others. Regenerative turbine pumps can safely pump liquids close to the boiling point without the detriment of cavitation, and the pump design is suitable for handling highly unstable liquids.
Basics Fundamentals and working Principle of Centrifugal Pump.SHASHI BHUSHAN
Basics Fundamentals and working Principle of Centrifugal Pump. Centrifugal pumps are the rotodynamic machines that convert mechanical energy of shaft into kinetic and pressure energy of Fluid which may be used to raise the level of fluid. A centrifugal pump is named so, because the energy added by the impeller to the fluid is largely due to centrifugal effects.
The hydraulic machines which convert the mechanical energy into hydraulic energy are called pumps.”
“If the mechanical energy is converted into pressure energy or kinetic energy by means of centrifugal force
acting on the fluid, the hydraulic machine is called Centrifugal pump.”
This lecture is all about the pumps, its components, need of pumping system, pumping system environment, classification of pump, pump characteristic curve, pump selection, affinity laws for pumps, and power requirement for pump.
Final project report on grocery store management system..pdfKamal Acharya
In today’s fast-changing business environment, it’s extremely important to be able to respond to client needs in the most effective and timely manner. If your customers wish to see your business online and have instant access to your products or services.
Online Grocery Store is an e-commerce website, which retails various grocery products. This project allows viewing various products available enables registered users to purchase desired products instantly using Paytm, UPI payment processor (Instant Pay) and also can place order by using Cash on Delivery (Pay Later) option. This project provides an easy access to Administrators and Managers to view orders placed using Pay Later and Instant Pay options.
In order to develop an e-commerce website, a number of Technologies must be studied and understood. These include multi-tiered architecture, server and client-side scripting techniques, implementation technologies, programming language (such as PHP, HTML, CSS, JavaScript) and MySQL relational databases. This is a project with the objective to develop a basic website where a consumer is provided with a shopping cart website and also to know about the technologies used to develop such a website.
This document will discuss each of the underlying technologies to create and implement an e- commerce website.
NO1 Uk best vashikaran specialist in delhi vashikaran baba near me online vas...Amil Baba Dawood bangali
Contact with Dawood Bhai Just call on +92322-6382012 and we'll help you. We'll solve all your problems within 12 to 24 hours and with 101% guarantee and with astrology systematic. If you want to take any personal or professional advice then also you can call us on +92322-6382012 , ONLINE LOVE PROBLEM & Other all types of Daily Life Problem's.Then CALL or WHATSAPP us on +92322-6382012 and Get all these problems solutions here by Amil Baba DAWOOD BANGALI
#vashikaranspecialist #astrologer #palmistry #amliyaat #taweez #manpasandshadi #horoscope #spiritual #lovelife #lovespell #marriagespell#aamilbabainpakistan #amilbabainkarachi #powerfullblackmagicspell #kalajadumantarspecialist #realamilbaba #AmilbabainPakistan #astrologerincanada #astrologerindubai #lovespellsmaster #kalajaduspecialist #lovespellsthatwork #aamilbabainlahore#blackmagicformarriage #aamilbaba #kalajadu #kalailam #taweez #wazifaexpert #jadumantar #vashikaranspecialist #astrologer #palmistry #amliyaat #taweez #manpasandshadi #horoscope #spiritual #lovelife #lovespell #marriagespell#aamilbabainpakistan #amilbabainkarachi #powerfullblackmagicspell #kalajadumantarspecialist #realamilbaba #AmilbabainPakistan #astrologerincanada #astrologerindubai #lovespellsmaster #kalajaduspecialist #lovespellsthatwork #aamilbabainlahore #blackmagicforlove #blackmagicformarriage #aamilbaba #kalajadu #kalailam #taweez #wazifaexpert #jadumantar #vashikaranspecialist #astrologer #palmistry #amliyaat #taweez #manpasandshadi #horoscope #spiritual #lovelife #lovespell #marriagespell#aamilbabainpakistan #amilbabainkarachi #powerfullblackmagicspell #kalajadumantarspecialist #realamilbaba #AmilbabainPakistan #astrologerincanada #astrologerindubai #lovespellsmaster #kalajaduspecialist #lovespellsthatwork #aamilbabainlahore #Amilbabainuk #amilbabainspain #amilbabaindubai #Amilbabainnorway #amilbabainkrachi #amilbabainlahore #amilbabaingujranwalan #amilbabainislamabad
Saudi Arabia stands as a titan in the global energy landscape, renowned for its abundant oil and gas resources. It's the largest exporter of petroleum and holds some of the world's most significant reserves. Let's delve into the top 10 oil and gas projects shaping Saudi Arabia's energy future in 2024.
About
Indigenized remote control interface card suitable for MAFI system CCR equipment. Compatible for IDM8000 CCR. Backplane mounted serial and TCP/Ethernet communication module for CCR remote access. IDM 8000 CCR remote control on serial and TCP protocol.
• Remote control: Parallel or serial interface.
• Compatible with MAFI CCR system.
• Compatible with IDM8000 CCR.
• Compatible with Backplane mount serial communication.
• Compatible with commercial and Defence aviation CCR system.
• Remote control system for accessing CCR and allied system over serial or TCP.
• Indigenized local Support/presence in India.
• Easy in configuration using DIP switches.
Technical Specifications
Indigenized remote control interface card suitable for MAFI system CCR equipment. Compatible for IDM8000 CCR. Backplane mounted serial and TCP/Ethernet communication module for CCR remote access. IDM 8000 CCR remote control on serial and TCP protocol.
Key Features
Indigenized remote control interface card suitable for MAFI system CCR equipment. Compatible for IDM8000 CCR. Backplane mounted serial and TCP/Ethernet communication module for CCR remote access. IDM 8000 CCR remote control on serial and TCP protocol.
• Remote control: Parallel or serial interface
• Compatible with MAFI CCR system
• Copatiable with IDM8000 CCR
• Compatible with Backplane mount serial communication.
• Compatible with commercial and Defence aviation CCR system.
• Remote control system for accessing CCR and allied system over serial or TCP.
• Indigenized local Support/presence in India.
Application
• Remote control: Parallel or serial interface.
• Compatible with MAFI CCR system.
• Compatible with IDM8000 CCR.
• Compatible with Backplane mount serial communication.
• Compatible with commercial and Defence aviation CCR system.
• Remote control system for accessing CCR and allied system over serial or TCP.
• Indigenized local Support/presence in India.
• Easy in configuration using DIP switches.
Hybrid optimization of pumped hydro system and solar- Engr. Abdul-Azeez.pdffxintegritypublishin
Advancements in technology unveil a myriad of electrical and electronic breakthroughs geared towards efficiently harnessing limited resources to meet human energy demands. The optimization of hybrid solar PV panels and pumped hydro energy supply systems plays a pivotal role in utilizing natural resources effectively. This initiative not only benefits humanity but also fosters environmental sustainability. The study investigated the design optimization of these hybrid systems, focusing on understanding solar radiation patterns, identifying geographical influences on solar radiation, formulating a mathematical model for system optimization, and determining the optimal configuration of PV panels and pumped hydro storage. Through a comparative analysis approach and eight weeks of data collection, the study addressed key research questions related to solar radiation patterns and optimal system design. The findings highlighted regions with heightened solar radiation levels, showcasing substantial potential for power generation and emphasizing the system's efficiency. Optimizing system design significantly boosted power generation, promoted renewable energy utilization, and enhanced energy storage capacity. The study underscored the benefits of optimizing hybrid solar PV panels and pumped hydro energy supply systems for sustainable energy usage. Optimizing the design of solar PV panels and pumped hydro energy supply systems as examined across diverse climatic conditions in a developing country, not only enhances power generation but also improves the integration of renewable energy sources and boosts energy storage capacities, particularly beneficial for less economically prosperous regions. Additionally, the study provides valuable insights for advancing energy research in economically viable areas. Recommendations included conducting site-specific assessments, utilizing advanced modeling tools, implementing regular maintenance protocols, and enhancing communication among system components.
Overview of the fundamental roles in Hydropower generation and the components involved in wider Electrical Engineering.
This paper presents the design and construction of hydroelectric dams from the hydrologist’s survey of the valley before construction, all aspects and involved disciplines, fluid dynamics, structural engineering, generation and mains frequency regulation to the very transmission of power through the network in the United Kingdom.
Author: Robbie Edward Sayers
Collaborators and co editors: Charlie Sims and Connor Healey.
(C) 2024 Robbie E. Sayers
1. CENTRIFUGAL PUMP SELECTION, SIZING, AND
INTERPRETATION OF PERFORMANCE
CURVES
4.0 PUMP CLASSES
Pumps may be classified in two general types, dynamic and positive displacement.
Positive displacement pumps are those in which energy is imparted to the liquid in a fixed
displacement volume, such as a casing or a cylinder, by the rotary motion of gears,
screws, or vanes, or by reciprocating pistons or plungers. Centrifugal pumps are dynamic
pumps. Energy is imparted to the liquid by means of a disk with curved vanes rotating on
a shaft called the impeller. The impeller imparts kinetic energy to the fluid by means of its
shape and high rotational velocity. This energy is transformed to pressure energy when
the fluid reaches the pump casing (see Figure 1-12). The pressure head difference
between the inlet and the outlet, or Total Head produced by the pump, is proportional to
the impeller speed and diameter. Therefore, to obtain a higher head, the rotational speed
or the impeller diameter can be increased. To learn more about how a centrifugal pump
increases a fluid's pressure, see reference 15.
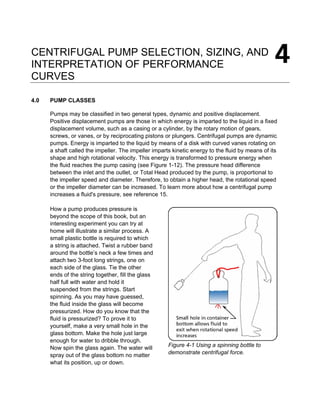
How a pump produces pressure is
beyond the scope of this book, but an
interesting experiment you can try at
home will illustrate a similar process. A
small plastic bottle is required to which
a string is attached. Twist a rubber band
around the bottle’s neck a few times and
attach two 3-foot long strings, one on
each side of the glass. Tie the other
ends of the string together, fill the glass
half full with water and hold it
suspended from the strings. Start
spinning. As you may have guessed,
the fluid inside the glass will become
pressurized. How do you know that the
fluid is pressurized? To prove it to
yourself, make a very small hole in the
glass bottom. Make the hole just large
enough for water to dribble through.
Now spin the glass again. The water will
spray out of the glass bottom no matter
what its position, up or down.
Figure 4-1 Using a spinning bottle to
demonstrate centrifugal force.
2. 4 • 2 PUMP SELECTION, SIZING AND INTERPRETATION OF PERFORMANCE CURVES
4.1 COVERAGE CHART FOR CENTRIFUGAL PUMPS
A coverage chart (see Figure 4-2) makes it possible to do a preliminary pump selection by
looking at a wide range of pump casing sizes for a specific impeller speed. This chart
helps narrow down the choice of pumps that will satisfy the system requirements.
4.2 PERFORMANCE CURVE CHART
The following figure shows a
typical pump performance chart
for a given model, casing size,
and impeller rotational speed. A
great deal of information is
crammed into one chart and this
can be confusing at first. The
performance chart covers a
range of impeller sizes, which
are shown in even increments of
1/2" from 7 1/2" to 9 1/2".
Impellers are manufactured to
the largest size for a given pump casing and machined or "trimmed" to the required
diameter when the pump is sold.
Figure 4-2 Typical pump capacity coverage chart.
Figure 4-3 Typical pump performance curve.
3. PUMP SELECTION, SIZING AND INTERPRETATION OF PERFORMANCE CURVES 4 • 3
Performance Curve
At some point in the pump selection process, the impeller diameter is selected. For an
existing pump, the diameter of the impeller is known. For a new pump, our calculations of
Total Head for a given flow rate will have determined the impeller diameter to select
according to the performance curve. Figure 4-4 shows only the information relevant to the
8 1/2" impeller performance curve.
A performance curve is a plot of Total Head vs. flow rate for a specific impeller diameter
and speed. The plot starts at zero flow. The head at this point corresponds to the shut-off
head of the pump, point A in Figure 4-4 (more about this later). Starting at this point, the
head decreases until it reaches its minimum at point B. This point is sometimes called the
run-out point and represents the maximum flow of the pump. Beyond this, the pump
cannot operate. The pump's range of operation is from point A to B.
Efficiency Curves
The pump's efficiency varies throughout its operating range. This information is essential
for calculating the motor power (see section 4.9).
The B.E.P. (best efficiency point) is the point of highest efficiency of the pump. All points
to the right or left of the B.E.P have a lower efficiency (see Figure 4-4). The impeller is
subject to axial and radial forces, which get greater the further away the operating point is
from the B.E.P. These forces manifest themselves as vibration depending on the speed
and construction of the pump. The point where the forces and vibration levels are minimal
is at the B.E.P.
In selecting a pump, one of the concerns is to optimize pumping efficiency. It is good
practice to examine several performance charts at different speeds to see if one model
satisfies the requirements more efficiently than another. Whenever possible the lowest
pump speed should be selected, as this will save wear and tear on the rotating parts.
Figure 4-4 Typical performance curve for a specific impeller diameter.
4. 4 • 4 PUMP SELECTION, SIZING AND INTERPRETATION OF PERFORMANCE CURVES
Note: The pump performance curves are based on data generated in a test rig using water as
the fluid. These curves are sometimes referred to as water performance curves. The use of
these curves for fluids with a different viscosity than water can lead to error if the proper
correction factors are not applied. These correction factors are applied to the Total Head, the
flow and the efficiency of the pump, and are published in form of curves by the Hydraulic
Institute (see Standards book published by the Hydraulic Institute, web site:
http://www.pumps.org and for the correction factor charts see the web site
www.fluidedesign.com).
Horsepower Curves
The horsepower curves are shown on the chart and give the power required to operate
the pump within a certain range. For example (see Figure 4-5), all points on the
performance curve to the left of the 2 hp curve will be attainable with a 2 hp motor. All
points to the left of 3 hp curve and to the right of the 2 hp curve will be attainable with a 3
hp motor. The horsepower can be calculated with the Total Head, flow and efficiency at
the operating point. (More on horsepower calculations and operating point later). Note
that the horsepower curves shown on the performance curves are valid for water only.
Figure 4-5 Coverage area of horsepower curves.
N.P.S.H. Requirement Curves
The pump manufacturer specifies a minimum requirement on the N.P.S.H. in order for the
pump to operate at its design capacity. These are the vertical dashed lines in Figure 4-6.
The N.P.S.H. required becomes higher as flow increases, and lower as flow decreases.
This essentially means that more pressure head is required at the pump suction for high
flows than low flows. Keep in mind that N.P.S.H. is a head term and therefore
independent of the fluid density and is in absolute fluid column height. The N.P.S.H.
required for the maximum flow in Figure 4-4 is approximately 4 feet absolute. This is not
very restrictive; most industrial pumping systems will have much more N.P.S.H. available.
5. PUMP SELECTION, SIZING AND INTERPRETATION OF PERFORMANCE CURVES 4 • 5
4.3 IMPELLER DIAMETER SELECTION
Quite often, the operating point is located between two curves on the performance chart.
We can calculate the impeller size required by linear interpolation. For example, if the
operating point falls between the 9" and 9 1/2" impeller curve (see Figure 4-7), the
following equation will give the correct size:
)(
95.9
9 9
92/91
HH
HH
D OPOP ∆−∆
∆−∆
−
+=
where DOP : impeller diameter required;
∆HOP : pump total head at the operating point;
∆H9 : pump total head at the intersection of the 9” impeller curve and flow rate;
∆H91/2 : pump total head at the intersection of the 9 1/2” impeller curve and the flow
rate.
Figure 4-6 N.P.S.H required curves.
Figure 4-7 Interpolating impeller diameter.
6. 4 • 6 PUMP SELECTION, SIZING AND INTERPRETATION OF PERFORMANCE CURVES
It is good practice to select (when possible) a pump with an impeller that can be increased in size,
permitting a future increase in head and capacity. Or alternatively, an impeller which can be reduced
in size. As a guide, select a pump with an impeller size no greater than between 1/3 and 2/3 of the
impeller range for that casing with an operating point in the high efficiency area (see Figure 4-8). It is
also important not to go too far right or left from the B.E.P.. A guideline is to locate the operating
point between 110% and 80% (see reference 16) of the B.E.P. flow rate with an operating point in the
desirable impeller selection area (see Figure 4-8).
4.4 SYSTEM CURVE
The system curve is a plot of the Total Head vs. the flow for a given system. The higher
the flow, the greater the head required (see Figure 4-9). The shape of the system curve
depends on the type of system being considered. The system curve equation for a typical
single outlet system such as in Figure 2-10 is:
TSvEQFP HqHqHqHqH ∆+∆+∆+∆=∆ )()()()(
The system curve is superimposed on the pump performance chart. The Total Static head
is constant and the friction head, equipment head and velocity head are flow dependent.
The calculation of Total Head at different flow rates produces a plot of Total Head vs. flow
that is called the system curve.
The operating point is the point on the system curve corresponding to the flow and head
required. It is also the point where the system curve intersects the performance curve.
The design system curve is usually calculated with extra flow capacity in mind. It is good
Figure 4-8 Desirable pump selection area.
7. PUMP SELECTION, SIZING AND INTERPRETATION OF PERFORMANCE CURVES 4 • 7
practice to plot the system curve for higher flow rates than the design flow rate, since flow
demand may change and extra capacity may be required.
4.5 OPERATING POINT
The question in example 2.1 has remained unanswered until now. That is: How can we
guarantee that the pump will deliver 500 USGPM at 70 feet of head?
First, determine the right pump size by using the coverage chart (see Figure 4-2). Locate
the head and flow coordinate (operating point) on the chart. This will identify the casing
size and pump speed. Locate the correct performance curve chart for this pump casing
size and again identify the operating point.
Figure 4-9 Superposition of system curve
and pump performance curve.
Figure 4-10 Location of operating point in example 2.1.
8. 4 • 8 PUMP SELECTION, SIZING AND INTERPRETATION OF PERFORMANCE CURVES
Determine the impeller size. The impeller size will be approximately 8.75". The dashed
line represents the performance curve of the pump. The pump can only operate on its
performance curve. The system can only be run somewhere on the system curve. The
intersection of these two defines the operating point which is the only point that the pump
and system can operate.
As is often the case, one question leads to another: How does the pump get to the
operating point from the moment it is switched on?
There are two methods which can be used to start a pump. With method 1 the discharge
valve is closed, whereas with method 2 the discharge valve is open. The term discharge
valve refers to the manual valve located close to the pump outlet flange.
Method 1 (discharge valve closed)
Pumps are often started with the discharge valve closed. Immediately after the pump is
started, the head rises to point D (see Figure 4-11). The system curve at this moment is
vertical. By gradually opening the discharge valve to its full open position, point D will
move down the performance curve to point C, where the discharge valve should be fully
open. The system curve's shape is progressively modified as the operating point is moved
towards point C. This is a typical way of starting large pumps and should be the preferred
method for any pump operating at more than 500 USGPM.
Figure 4-11 Starting the pump with discharge valve closed.
9. PUMP SELECTION, SIZING AND INTERPRETATION OF PERFORMANCE CURVES 4 • 9
Method 2 (discharge valve open)
The alternate method is to start with the discharge valve open. When the pump is just
starting the initial RPM is low; the pump produces little head and flow. As the pump
accelerates, it will intersect the system curve at point A at 200 RPM, point B at 500 RPM
and finally point C at the normal rotational speed of the pump and motor. This happens
very quickly since the motor will reach its full operating speed in a few seconds. The
disadvantage of starting with this method is that high initial velocity can produce a severe
water hammer, shaking pipes and equipment.
Method 1 is the preferred method of starting a pump. To minimize personnel
requirements, it is the practice in many plants to equip their pumps with remote operated
on-off discharge valves for large pumps (larger than 500 USGPM). The valves are opened
automatically by a control system, thereby providing a smooth start-up.
4.6 SAFETY FACTOR ON TOTAL HEAD OR CAPACITY
Before finalizing the choice of impeller size, consider whether you should apply an extra
capacity factor or not (capacity = flow). There are no rules; however, since we normally
size pumps for someone else, it is a good idea to agree on a safety margin with your
client. Point 1 on impeller curve A (see Figure 4-13) is the operating point (on system
curve a) before a capacity factor is applied.
Safety margin on total head
If we apply a head factor of 10%, we will have to select impeller C. The operating point
will now be at point 2. This means that there must be a different system curve than curve
a, which is curve c. The only explanation for this is that we have underestimated the
pressure drops throughout the system. If it turns out that the pressure drop calculations
were right after all, and that we really are operating with curve a, then the operating point
will shift from point 2 to 3 on impeller curve C (assuming there is sufficient horsepower to
operate at point 3). If we need to get back to the flow corresponding to point 1 for process
reasons, then throttling a valve at the pump discharge will change the operating curve to
match curve c and bring the operating point back to point 2.
Figure 4-12 Starting the pump with discharge valve
open.
10. 4 • 10 PUMP SELECTION, SIZING AND INTERPRETATION OF PERFORMANCE CURVES
Safety margin on flow
If we apply a capacity factor of say 10%, we will have to select impeller curve B. This
means that the system curve is in reality curve d. If in actuality our original flow estimate
was correct, then the operating point will shift from point 4 to 5. To get back to the original
flow, we have to throttle back so that we shift to point 6, and we will operate on a new
system curve b.
Safety margin on total head and flow
If we decide to put on suspenders and a belt (i.e. a head and capacity factor), and
assuming that we are operating on system curve a, then we would select impeller curve C
and operate at point 3. If we needed to get back to our original flow at point 1, then we
would throttle back until we reached point 2.
This is a similar situation to applying solely a head factor because of the shape of the
performance and system curves. Therefore, applying a head factor only also provides
reserve capacity on flow.
Figure 4-13 Location of capacity factor.
11. PUMP SELECTION, SIZING AND INTERPRETATION OF PERFORMANCE CURVES 4 • 11
4.7 PUMP OPERATION TO THE RIGHT OR LEFT OF THE BEST EFFICIENCY POINT (B.E.P.)
The impeller is subjected to axial and radial forces. The level of the radial force depends on
the pressure within the casing and is taken up by the drive shaft bearings.
Figure 4-14 The forces on the impeller.
There is also a net radial force whose level depends on the pressure level within the casing,
and also on the position of the operating point with respect to the B.E.P.. This force increases
rapidly the further away the operating point (see Figure 4-15) gets from the B.E.P. of the
pump (for more information see reference 16).
12. 4 • 12 PUMP SELECTION, SIZING AND INTERPRETATION OF PERFORMANCE CURVES
Figure 4-16 Variation in the level of vibration at the
operating point vs. the position of the B.E.P.(reprinted
with permission of the Goulds pump company).
Figure 4-15 Variation on the magnitude of the radial force on the impeller
according to the position of the operating point with respect to the
B.E.P.(reprinted with permission of McGrawHill).
13. PUMP SELECTION, SIZING AND INTERPRETATION OF PERFORMANCE CURVES 4 • 13
What are the consequences of operating to the right or left of the B.E.P.?
To the right of the B.E.P., or at high flows
Operating at the far right of the curve, near run-out point of the pump (point B, Figure 4-4)
should be avoided. As flow increases, so does the N.P.S.H. required, and therefore
cavitation is more likely to occur.
To the left of the B.E.P. or at low flows
Operation of centrifugal pumps at reduced capacity leads to a number of unfavorable
results that may take place separately or simultaneously, and should be anticipated and
circumvented. Some of these are:
• Operating at less than best efficiency
On occasion, reduced flows may be required by the process. This can be
accommodated by a variable speed drive, or by using several pumps. One or
more pumps can then be shut down to provide the reduced flow.
• Higher bearing load
If a pump is of a single volute design, it will be subjected to higher radial thrust,
which will increase the load on the radial bearing. Therefore, the bearing life
would be expected to diminish.
• Temperature rise
As capacity is reduced, the temperature of the pumped liquid increases. To
avoid exceeding permissible limits, a minimum flow by-pass is required.
• Internal re-circulation
At certain flows below the best efficiency, all centrifugal pumps are subjected
to internal re-circulation, in both the suction and the discharge area of the
impeller. This can cause hydraulic surging and damage to the impeller metal,
similar to that caused by classic cavitation, but taking place in a different area
of the impeller.
Figure 4-17 Internal recirculation at low flow (reprinted
with permission of McGraw-Hill).
14. 4 • 14 PUMP SELECTION, SIZING AND INTERPRETATION OF PERFORMANCE CURVES
4.8 PUMP-SHUT-OFF HEAD
The shut-off head is the Total Head that the pump can deliver at zero flow (see Figure 4-
19). The shut-off head is important for 2 reasons.
1. In certain systems (admittedly unusual), the pump discharge line may have to run
at a much higher elevation than the final discharge point. The fluid must first reach
the higher elevation in the system. If the shut-off head is smaller than the static
head corresponding to the high point, then flow will not be established in the
system.
2. During start-up and checkout of the pump, a quick way to determine if the pump
has the potential capacity to deliver the head and flow required, is to measure the
shut-off head. This value can be compared to the shut-off head predicted by the
performance curve of the pump.
Figure 4-18 Discharge pipe coming from
a higher elevation into the discharge
tank.
15. PUMP SELECTION, SIZING AND INTERPRETATION OF PERFORMANCE CURVES 4 • 15
Figure 4-19 Location of pump shut-off head on the
performance curve.
4.9 PUMP POWER
A pump's power demand is directly proportional to the difference between the inlet and
outlet pressure and the flow rate.
qpP P∆=
where ∆pP is the difference in pressure at the inlet and the outlet of the pump, and q the
flow rate. The above equation expressed in imperial units is:
2.1714
min)/()(
)(
USgalqpsip
hpP P∆
= [4-1]
∆pP is converted to head. From equation [1-5]:
)(
31.2
1
)( fluidofftHSGpsip PP ∆=∆ [4-2]
by substituting equation [4-2] into equation [4-1] we obtain:
3960
min)/()(
)(
USgalqfluidofftHSG
hpP P∆
= [4-3]
16. 4 • 16 PUMP SELECTION, SIZING AND INTERPRETATION OF PERFORMANCE CURVES
Equation [4-3] would be true if the pump were 100% efficient. Pump efficiency data are
available from the pump manufacturer. All manufacturers test their pumps for various
flows, heads and impeller sizes. The resulting efficiency data are mapped on the pump
performance curve. The true power required at the pump shaft is:
η3960
min)/()(
)(
USgalqfluidofftHSG
hpP
P∆
= [4-4]
where η is the pump efficiency. If the pump efficiency is 60%, then the value of η is 0.6.
It is good practice to design the pump base in such a way that the selected motor will
stand on spacer blocks, being high enough that the next largest motor frame can be
installed when the blocks are removed. This will allow the installation of a larger motor
without a major disturbance if it should be required.
4.9 AFFINITY LAWS
The affinity laws are derived from a dimensionless analysis of three important parameters that
describe pump performance: flow, total head and power (ref: The Pump Handbook by
McGraw-Hill, chapter 2). The analysis is based on the reduced impeller being geometrically
similar and operated at dynamically similar conditions or equal specific speed.
The affinity laws were developed using the law of similitudes which provide 3 basic
relationships.
Flow vs. diameter and speed
K
nD
Q
=3
or
3
2
3
1
2
1
2
1
D
D
n
n
Q
Q
=
17. PUMP SELECTION, SIZING AND INTERPRETATION OF PERFORMANCE CURVES 4 • 17
Total Head vs. diameter and speed
K
Dn
Hg
=22
or
2
2
2
1
2
2
2
1
2
1
D
D
n
n
H
H
=
Power vs. diameter and speed
where subscripts 1 and 2 denote the value before and after the change. P is the power, n the
speed, D the impeller diameter, H the total head.
If the speed is fixed the affinity laws become:
3
2
3
1
2
1
D
D
Q
Q
= 2
2
2
1
2
1
D
D
H
H
= 5
2
5
1
2
1
D
D
P
P
=
If the diameter is fixed the affinity laws become:
2
1
2
1
n
n
Q
Q
=
2
2
2
1
2
1
n
n
H
H
= 3
2
3
1
2
1
n
n
P
P
=
The process of arriving at the affinity laws assumes that the two operating points that are
being compared are at the same efficiency. The relationship between two operating points,
say 1 and 2, depends on the shape of the system curve (see Figure 4-20). The points that lie
on system curve A will all be approximately at the same efficiency. Whereas the points that lie
on system curve B are not. The affinity laws do not apply to points that belong to system
curve B. System curve B describes a system with a relatively high static head vs. system
curve A which has a low static head.
K
Dn
g
P
=
53γ
or
5
2
5
1
3
2
3
1
2
1
D
D
n
n
P
P
=
18. 4 • 18 PUMP SELECTION, SIZING AND INTERPRETATION OF PERFORMANCE CURVES
Figure 4-20 Limitation on the use of the affinity laws.
Diameter reduction To reduce costs pump casings are designed to accommodate several
different impellers. Also, a variety of operating requirements can be met by changing the
outside diameter of a given radial impeller. Euler’s equation shows that the head should be
proportional to (nD)2
provided that the exit velocity triangles remain the same before and after
cutting. This is the usual assumption and leads to:
22
11
2
1
Dn
Dn
Q
Q
=
2
2
2
2
2
1
2
1
2
1
Dn
Dn
H
H
= 3
2
3
2
3
1
3
1
2
1
Dn
Dn
P
P
=
Which apply only to a given impeller with altered D and constant efficiency but not a
geometrically similar series of impellers.
If that is the case then the affinity laws can be used to predict the performance of the pump at
different diameters for the same speed or different speed for the same diameter. Since in
practice impellers of different diameters are not geometrically identical, the author's of the
section called Performance Parameters in the Pump Handbook recommend to limit the use of
this technique to a change of impeller diameter no greater than 10 to 20%. In order to avoid
over cutting the impeller, it is recommended that the trimming be done in steps with careful
measurement of the results. At each step compare your predicted performance with the
measured one and adjust as necessary.
19. PUMP SELECTION, SIZING AND INTERPRETATION OF PERFORMANCE CURVES 4 • 19
Sizing things up ….
1. Head is independent of fluid density.
2. For fluids other than water, it should be determined if the fluid is Newtonian. Many pure
fluids are Newtonian (see the table on rheological properties of fluids in Appendix A as a
starting point). If the fluid is non-Newtonian, depending on the severity of its departure
from Newtonian behavior, a centrifugal pump may not be an appropriate pumping device.
If the fluid is Newtonian but with a different viscosity than water, apply the correction
factors to the performance curve suggested by the pump manufacturer (see reference 1
and 2).
3. Order the pump base with spacer blocks for the motor, allowing the next larger frame to
be installed when the blocks are removed.
4. Select a pump size and speed in such a way that the impeller is not close to its
maximum size (i.e. within 2/3’s of it’s total range) in order to allow for a future increase in
capacity. Locate the operating point somewhere between 110% and 80% of the B.E.P.
flow.
5. During the selection process, if the operating point falls between two performance
curves, by interpolation calculate the exact impeller size required to intersect the
operating point. Impeller size is easily machined down to the correct diameter.
6. Determine the total static head corresponding to the highest point of the system and
make sure that it is less than the pump shut-off head.
7. Finally, beware using the affinity laws for calculating a new pump diameter or speed for
systems that have a high static head, the affinity laws apply only between two points that
are at the same efficiency.