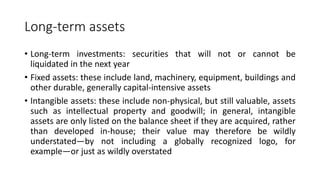
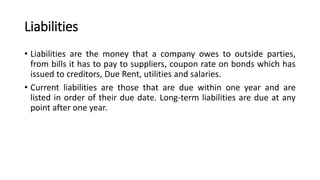
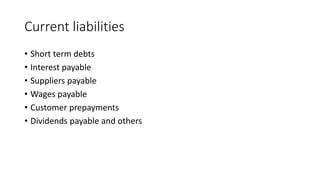
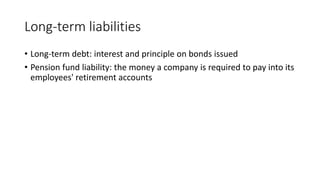
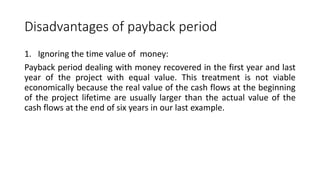
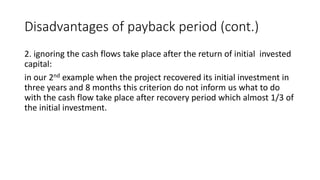
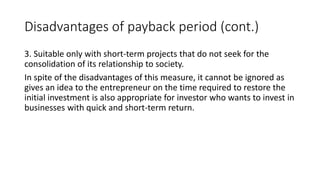
This document provides an overview and explanation of key financial statements used in feasibility studies:
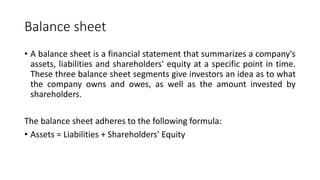
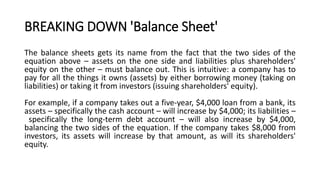
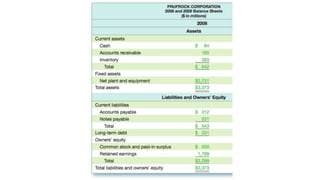
- The balance sheet summarizes a company's assets, liabilities, and shareholders' equity at a point in time and adheres to the formula that assets equal liabilities plus shareholders' equity.
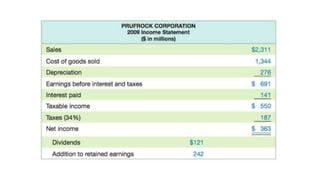
- The income statement assesses financial performance over a period by reporting revenues, expenses from operations and non-operations, and net profit/loss.
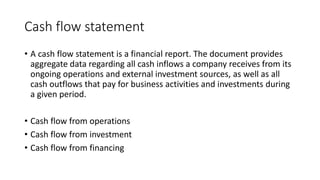
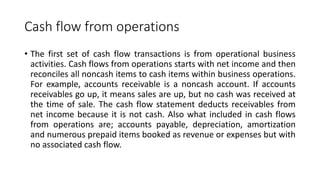
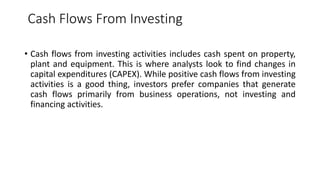
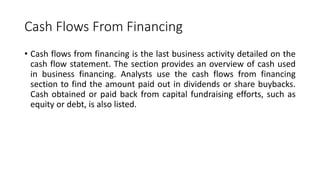
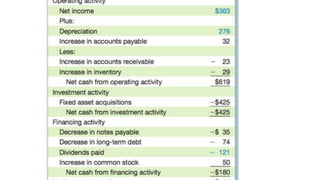
- The cash flow statement provides data on cash inflows and outflows from operations, investing, and financing activities during a period.
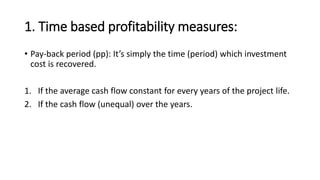
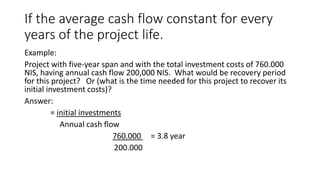
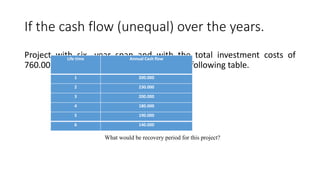
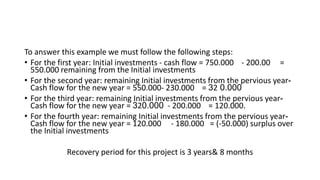
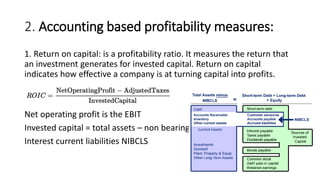
It then discusses various metrics used to evaluate profitability and feasibility, including payback period, return on capital, net present value, profit index


![2. Return on equity (ROE) is a measure of the profitability of a business
in relation to the book value of shareholder equity, also known as net
assets or assets minus liabilities. ROE is a measure of how well a
company uses investments to generate earnings growth.
ROE = [Net income / shareholders equity] * 100%](https://image.slidesharecdn.com/chapter7-171207102605/85/Chapter-7-Economic-Feasibility-Study-30-320.jpg)


![Credit Training[Finall]](https://cdn.slidesharecdn.com/ss_thumbnails/credittrainingfinall-091227073414-phpapp02-thumbnail.jpg?width=640&height=640&fit=bounds)


