chapter 5
Cost–Volume–Profit Analysis
Learning Objectives
• Extend your knowledge of fixed and variable costs, and be able to perform cost
behavior analysis.
• Understand the contribution margin, contribution margin ratio, and how knowledge of
these concepts can be used to calculate breakeven and other performance measures.
• Know the critical assumptions of cost–volume–profit analysis.
• Understand variable versus absorption costing.
• Be able to calculate residual income.
istockphoto
waL80281_05_c05_113-140.indd 1 9/25/12 1:03 PM
114
CHAPTER 5Section 5.1 Mixed Costs
Chapter Outline
5.1 Mixed Costs
5.2 Cost–Volume–Profit Analysis
The Algebra of Break-Even and Targeted Income Analysis
Influence of Taxes
Changing Costs
Changing Revenues
Multiple Products
5.3 CVP Assumptions
Direct Costing
Comprehensive Income Statements Under Variable and Absorption Costing
Fluctuating Inventory
5.4 Evaluating Residual Income
You have previously learned about fixed and variable costs. Fixed costs are the same over the relevant range of expected production. Variable costs fluctuate in direct pro-
portion to volume. You have seen how cost behavior influences measures of income, flex-
ible budgeting, standard costing models, and so forth. Management must understand
cost behavior to operate a successful business organization effectively. In this chapter,
your knowledge of cost behavior will be extended to encompass techniques useful in
studying a business’s break-even point and similar concepts. These techniques are com-
monly referred to as cost–volume–profit analysis or just CVP. You will also apply your
knowledge of cost behavior to understand alternative costing methods that are useful in
managing business decisions.
5.1 Mixed Costs
Before diving into CVP and alternative costing models, one must give consideration to the prospect of a mixed cost. Mixed costs entail a fixed component and a variable
component. They are actually quite common. If you have ever committed to a cell phone
contract, it is very possible that you have some hands-on experience with mixed costs.
Your monthly cellular bill may include both fixed and variable amounts. Perhaps there is
a fixed charge for basic monthly service and variable charges related to Internet access,
texting, and so forth. Mixed costs change in response to fluctuations in volume, but not
in a way that is immediately apparent. Before a manager can study the effects of volume
fluctuation on a business, it is first necessary to develop a model that separates mixed
costs into their fixed and variable components.
Assume that Charlie’s Restaurant receives a monthly electric bill. Charlie’s electricity use
fluctuates significantly each month. The cause of the fluctuation relates mostly to seasonal
differences in utility consumption, based on heating and air-conditioning needs. Charlie’s
provides data about its monthly electric bill in Table 5.1.
waL80281_05_c05_113-140.indd ...
1. chapter 5
Cost–Volume–Profit Analysis
Learning Objectives
• Extend your knowledge of fixed and variable costs, and be
able to perform cost
behavior analysis.
• Understand the contribution margin, contribution margin
ratio, and how knowledge of
these concepts can be used to calculate breakeven and other
performance measures.
• Know the critical assumptions of cost–volume–profit
analysis.
• Understand variable versus absorption costing.
• Be able to calculate residual income.
istockphoto
waL80281_05_c05_113-140.indd 1 9/25/12 1:03 PM
114
CHAPTER 5Section 5.1 Mixed Costs
2. Chapter Outline
5.1 Mixed Costs
5.2 Cost–Volume–Profit Analysis
The Algebra of Break-Even and Targeted Income Analysis
Influence of Taxes
Changing Costs
Changing Revenues
Multiple Products
5.3 CVP Assumptions
Direct Costing
Comprehensive Income Statements Under Variable and
Absorption Costing
Fluctuating Inventory
5.4 Evaluating Residual Income
You have previously learned about fixed and variable costs.
Fixed costs are the same over the relevant range of expected
production. Variable costs fluctuate in direct pro-
portion to volume. You have seen how cost behavior influences
measures of income, flex-
ible budgeting, standard costing models, and so forth.
Management must understand
cost behavior to operate a successful business organization
effectively. In this chapter,
your knowledge of cost behavior will be extended to encompass
techniques useful in
studying a business’s break-even point and similar concepts.
These techniques are com-
monly referred to as cost–volume–profit analysis or just CVP.
You will also apply your
knowledge of cost behavior to understand alternative costing
methods that are useful in
3. managing business decisions.
5.1 Mixed Costs
Before diving into CVP and alternative costing models, one
must give consideration to the prospect of a mixed cost. Mixed
costs entail a fixed component and a variable
component. They are actually quite common. If you have ever
committed to a cell phone
contract, it is very possible that you have some hands-on
experience with mixed costs.
Your monthly cellular bill may include both fixed and variable
amounts. Perhaps there is
a fixed charge for basic monthly service and variable charges
related to Internet access,
texting, and so forth. Mixed costs change in response to
fluctuations in volume, but not
in a way that is immediately apparent. Before a manager can
study the effects of volume
fluctuation on a business, it is first necessary to develop a
model that separates mixed
costs into their fixed and variable components.
Assume that Charlie’s Restaurant receives a monthly electric
bill. Charlie’s electricity use
fluctuates significantly each month. The cause of the fluctuation
relates mostly to seasonal
differences in utility consumption, based on heating and air-
conditioning needs. Charlie’s
provides data about its monthly electric bill in Table 5.1.
waL80281_05_c05_113-140.indd 2 9/25/12 1:03 PM
115
4. CHAPTER 5Section 5.1 Mixed Costs
Table 5.1: Charlie’s electric bill data
Total cost Kilowatts used
January $1,950 15,000
February 1,750 13,000
March 1,650 12,000
April 1,350 9,000
May 1,450 10,000
June 1,750 13,000
July 2,150 17,000
August 2,050 16,000
September 1,850 14,000
October 1,350 9,000
November 1,550 11,000
December 1,750 13,000
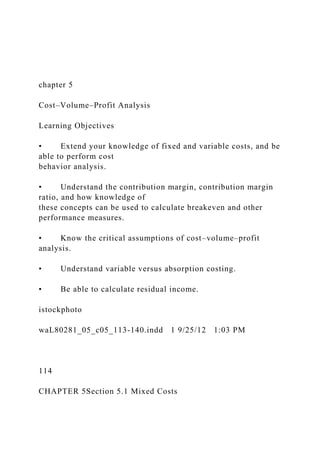
At first glance, it may not be at all apparent how the total cost
relates to the total usage.
However, a graphical representation of this cost is quite
revealing. Exhibit 5.1 is a chart
with the total cost indicated along the vertical axis and the total
5. usage along the horizontal
axis. From this chart, you are able to see that fixed cost is the
same, at $450, no matter the
electricity consumed. Variable cost is rising at $0.10 per
kilowatt hour.
Exhibit 5.1
KILOWATTS USED
TOTAL ELECTRICITY COST
Variable cost area
Fixed cost area
18,00016,00014,00012,00010,0008,0006,0004,0002,0000
$2,500
$2,000
$1,500
$1,000
$500
$0
waL80281_05_c05_113-140.indd 3 9/25/12 1:03 PM
116
6. CHAPTER 5Section 5.1 Mixed Costs
Perhaps you are able to “eyeball” the data in the table and make
a determination of the
fixed and variable portions in the electric bill. However, what if
the data set is much larger
and more cryptic? How can you estimate the fixed and variable
amounts? This problem
is frequently encountered because many expenses contain both
fixed and variable compo-
nents. A simple (and sometimes imprecise) approach is the
high–low method. With this
technique, the highest and lowest levels of activity are
identified and the difference in cost
is deemed to be representative of the variable portion. The
variable portion is divided by
the difference in activity/consumption between the high and low
activity levels to find
the variable cost per unit. The fixed cost can be calculated by
subtracting variable cost
from total cost. In Table 5.2 are calculations of the fixed and
variable costs for Exhibit 5.1,
determined by using the high–low method.
Table 5.2: Fixed and variable costs for Charlie’s Restaurant
Kilowatts Cost
Highest level 17,000 $2,150
Lowest level 9,000 1,350
Difference 8,000 $800
Variable cost per unit $800/8,000 5 $0.10
7. High Low
Total cost $2,150 $1,350
Less: Variable cost
(kilowatts 3 $0.10)
1,700 900
Fixed cost $450 $450
Certainly, the high–low method is not the only technique that
can be used to estimate
fixed and variable components. Also, if there are outlying data
points (on the high or low
end), the resulting estimates of fixed and variable components
can be quite misleading.
When data are not as linear as presented in the illustration,
more precise tools are needed
to separate costs into fixed and variable components.
One such tool is regression analysis (also known as the method
of least squares regression
analysis), which defines a line that has a best fit to a set of data.
The line is defined in terms
of its intercept with the vertical axis and its slope. To better
understand regression analy-
sis, consider Exhibit 5.2 showing a line that intercepts the y
axis at 2 and has a slope of 0.8.
waL80281_05_c05_113-140.indd 4 9/25/12 1:03 PM
117
8. CHAPTER 5Section 5.1 Mixed Costs
Exhibit 5.2
In the diagram, note that the line is rising consistently upward
to the right as it moves out
along the x axis. The rate of rise is called the slope of the line,
and it is occurring at the rate
of 0.8 along the y axis for every 1 unit increase along the x
axis. It is said that one picture is
worth a thousand words, and the same can be true of some
mathematical equations. You
should be able to close your eyes and imagine the same line
based on knowledge of its
mathematical formula:
Y 5 2 1 0.8X
where a is the intercept on the y axis, b is the slope of the line,
and X is the position on the
x axis.
This conventional mathematical formulation of a line can be
translated to a discussion of
fixed and variable costs in an accounting context. In other
words, the formula can also be
used to describe a mixed cost that consists of $2 of fixed cost
and an additional variable
component of $0.80 per unit. For example, if five units were
produced, total costs would
be $6 (see the circle in Exhibit 5.2), consisting of $2 fixed and
$4 variable (5 units 3 $0.80).
Given a large historical data set about a mixed cost over time,
how can regression analysis
be used to analyze the data and find the formula for the line that
9. best passes through the
data? In a precise context, regression provides a mathematical
model that processes the
data set to find a line where the cumulative sum of the squared
distances between the
points and the line is minimized (hence the name “least
squares”). You might actually
learn to do these calculations in an advanced statistics class.
Fortunately, however, elec-
tronic spreadsheets include built-in functions that do these
calculations for you. Exhibit
5.3 is an example of a spreadsheet plotting hypothetical cost
data against hypothetical
production data for a series of years:
20
2
0
4
6
8
10
12
4 6 8 10 12
X
Run = 10
10. Rise = 8Y
SLOPE = 0.8
waL80281_05_c05_113-140.indd 5 9/25/12 1:03 PM
118
CHAPTER 5Section 5.2 Cost–Volume–Profit Analysis
Exhibit 5.3
In the spreadsheet, column C includes annual production data,
whereas column D identi-
fies total cost. The formula included in cell C16
(=INTERCEPT(D5:D13,C5:C13)) serves
to calculate the intercept for the cost plotted against the
volume. The indicated value of
approximately $250,000 suggests fixed costs of approximately
that level for each year.
The slope reported in cell C17 (5SLOPE(D5:D13,C5:C13)) can
be interpreted to mean that
variable cost is $2.63 per unit of production. The accompanying
graph shows the indi-
vidual points and the resulting line defined by this formula:
Y 5 $250,044 1 $2.63X
This line resulting under regression analysis produces the best
fit line, such that the verti-
cal distance, squared, between each point and the resulting line
is minimized. This line is
deemed to be the best fit line, and it gives the best indication of
11. the fixed and variable costs
over time. A simple approach to regression is to simply “eyeball
the points” and draw a
line through them. You would then estimate the slope and
intercept of this estimated line.
This approach is not as precise as regression analysis, but it can
get you in the right ball-
park for a quick estimate.
5.2 Cost–Volume–Profit Analysis
Agood manager must understand an organization’s variable and
fixed cost components. That is why it is essential to perform
analysis such as that just illustrated to discern the
precise nature of a company’s cost behavior. Knowledge about
the cost structure is essen-
tial for cost–volume–profit (CVP) analysis. CVP is helpful in
assessing the relationships
between costs, business volume, and profitability. These
relationships take into account
variables pertaining to pricing, volume, variable and fixed
costs, and product mix.
$0
$600,000
$500,000
$400,000
$300,000
$200,000
$100,000
12. 20,000 40,000 60,000 80,000
TOTAL
COST
100,000 120,000
Year Production Total cost
20X1
20X2
20X3
20X4
20X5
20X6
20X7
20X8
20X9
100,000
90,000
75,000
110,000
14. 119
CHAPTER 5Section 5.2 Cost–Volume–Profit Analysis
The goal of CVP is to provide a foundation for pricing
decisions, product offerings, and
management of an organization’s cost structure. In the
following discussion, you will
learn how to calculate a company’s break-even point as well as
the volume level neces-
sary to achieve a targeted amount of income.
The core of CVP analysis is the contribution margin or revenues
minus all variable
expenses:
Contribution Margin 5 Revenues 2 Variable Expenses
Some of these variable costs are product costs and some relate
to selling and administra-
tive activities. The contribution margin should not be confused
with gross profit (revenues
minus cost of sales). Gross profit would be calculated after
deducting all manufacturing
costs associated with sold units, whether fixed or variable.
Furthermore, gross profit is
calculated before considering selling, general, and
administrative costs. Thus, the contribu-
tion margin and gross profit are two entirely different concepts.
The contribution margin is
a calculated value for internal analysis, but it is ordinarily not
reported to parties external
to the firm.
15. Assume that Mustang Corporation manufactures and sells
fishing boats. Each boat sells
for $10,000, and variable manufacturing costs are $6,000 per
boat. In addition, the boats
are only sold through commissioned agents who receive $1,500
for each boat sold. Mus-
tang’s per-unit contribution margin is $2,500 ($10,000 2
($6,000 1 $1,500)). Mustang incurs
$2,500,000 of fixed costs, no matter how many boats are
produced and sold. The company
must sell 1,000 units to break even, as shown in Table 5.3.
Table 5.3: Breaking even
Total Per boat Ratio
Sales (1,000 3 $10,000) $10,000,000 $10,000 100% (or 1.00)
Variable costs (1,000 3 $7,500) 7,500,000 7,500 75% (or 0.75)
Contribution margin $ 2,500,000 $ 2,500 25% (or 0.25)
Fixed costs 2,500,000
Net income $ 0
In reviewing Table 5.3, you likely noticed that the contribution
margin can be reflected
in the aggregate, on a per-unit basis, or on a ratio basis. The
ratios may be expressed as
percentages or fractional amounts (e.g., 50% or 0.50). These
data were designed to reflect
a break-even outcome of 1,000 units. In the following
paragraphs, you will learn how to
determine, in advance, the sales that are necessary to break
16. even. Before looking at those
formulations, let’s first consider what would happen to Mustang
if sales were 1,500 units.
Logic suggests that the company will be profitable. If 1,000
units are first needed to break
even, then selling an additional 500 units should produce profits
equivalent to the added
contribution on those 500 units (500 3 $2,500 5 $1,250,000).
The calculations in Table 5.4
prove this logic:
waL80281_05_c05_113-140.indd 7 9/25/12 1:03 PM
120
CHAPTER 5Section 5.2 Cost–Volume–Profit Analysis
Table 5.4: Logic of being profitable
Total Per boat Ratio
Sales (1,500 3 $10,000) $15,000,000 $10,000 100% (or 1.00)
Variable costs (1,500 3
$7,500)
11,250,000 7,500 75% (or 0.75)
Contribution margin $ 3,750,000 $ 2,500 25% (or 0.25)
Fixed costs 2,500,000
Net income $ 1,250,000
17. The changes in volume only impacted the total column in Table
5.4. Volume changes do
not change the per-unit or ratio effects. This will be important
to remember in the ensuing
formulas that you will learn for break-even calculations. Break-
even analysis can also be
presented in a graphical manner as in Exhibit 5.4.
Exhibit 5.4
A break-even chart, such as the one shown for Mustang, is
intended to allow the user to
observe the unit sales volume (as revealed along the horizontal
axis in Exhibit 5.4) that is
necessary for a company to break even. In other words, it is the
point where the amount of
sales in dollars equals the total cost in dollars. Total sales are
portrayed by the line starting
at zero and sloping upward at $10,000 per unit. In contrast, total
costs start at $2,500,000
(the amount of fixed costs) and rise more slowly at $7,500 per
unit (the amount of variable
cost per unit).
TOTAL UNITS
CVP ANALYSIS
Variable cost area
Profit area
Loss area
Total cost line
18. Break-even point
Total sales line
Fixed cost area
2,0001,5001,0005000
0
20,000,000
10,000,000
2,500,000
waL80281_05_c05_113-140.indd 8 9/25/12 1:03 PM
121
CHAPTER 5Section 5.2 Cost–Volume–Profit Analysis
Some companies utilize graphs such as that shown in Exhibit
5.4 to keep an eye on their
margin of safety. The margin of safety is simply the amount by
which sales exceed the
break-even sales level. If Mustang’s actual sales were
$15,000,000, their margin of safety
would be $5,000,000 ($15,000,000 2 $10,000,000 break-even
sales). Operating leverage is
a related CVP term that is often used. It refers to the amount of
increase in income associ-
ated with an increase in sales. This concept is based on the
differences in slope between
19. the total revenue line and the variable cost line; in essence, it
reflects the contribution mar-
gin rate. Some businesses refer to the process of evaluating
margin of safety and operating
leverage as tools in “sensitivity” or “scalability” analysis.
Basically, it is perspective on
how changes in volume impact changes in income.
The Algebra of Break-Even and Targeted Income Analysis
The preceding graphical representation can be converted to
algebraic formulas. Consider
the following relationships:
Break-Even Sales 5 Total Variable Costs 1 Total Fixed Costs
Mustang’s 10,000 units in sales to break even is confirmed via
the following:
(Units 3 $10,000) 5 (Units 3 $7,500) 1 $2,500,000
Solving:
(Units 3 $10,000) 2 (Units 3 $7,500) 5 $2,500,000
(Units 3 $2,500) 5 $2,500,000
Units 5 1,000
The 1,000 units, at $10,000 each, translate into total sales of
$10,000,000. The preceding
relationships can be algebraically modified to formulate a
calculation of breakeven by
reference to the contribution margin ratio:
Break-Even Sales = Total Fixed Costs / Contribution Margin
20. Ratio
$10,000,000 5 $2,500,000/0.25
Utilization of this ratio-based approach is helpful for
multiproduct companies as long as
all products have a consistent contribution margin.
As yet another modification to the algebra, consider that total
fixed costs can simply be
divided by the contribution margin per unit:
Break-Even Point in Units = Total Fixed Costs / Contribution
Margin Per Unit
1,000 Units 5 $2,500,000/$2,500
waL80281_05_c05_113-140.indd 9 9/25/12 1:03 PM
122
CHAPTER 5Section 5.2 Cost–Volume–Profit Analysis
Of course, businesses are not in business just to break even.
They likely have
targeted income levels and desire to know the amount of sales
that will be needed to
reach those goals. The determination of sales necessary to
achieve a targeted amount of
income is a very easy modification of the break-even
calculations. All that is required is
to treat the desired income in a manner similar to the amount of
fixed costs that must be
covered by the margin:
21. Sales to Achieve Targeted Income 5 Total Variable Costs 1
Total Fixed
Costs 1 Target Income
If Mustang desired to earn $1,000,000 of income, the following
calculations would be
appropriate:
(Units 3 $10,000) 5 (Units 3 $7,500) 1 $2,500,000 1 $1,000,000
Units 3 $2,500 5 $3,500,000
Units 5 1,400
If you want to know the dollar level of sales to achieve this
targeted income, you could
multiply the 1,400 units by the $10,000 selling price per unit, or
$14,000,000 5 (Total Fixed Costs 1 Target Income) /
Contribution Margin Ratio
$14,000,000 5 $3,500,000/0.25
Influence of Taxes
Taxes are a significant cost of doing business. Some taxes are
fixed in amount, such as
property taxes. They are easily factored into CVP by increasing
the total fixed cost pool.
However, taxes based on income present a slight complication
to CVP. Income taxes are
nonexistent up to the break-even point (i.e., you do not pay
income taxes until you turn
profitable) and then kick in based on a predetermined rate. The
effect of an income tax
22. essentially means that you have two different contribution
margin rates—one based on
sales minus variable expenses (without taxes) up to the break-
even point and another based
on sales minus variable expense and income taxes once the
break-even point is exceeded.
The preceding discussion points to the rather obvious need to
modify the algebra associ-
ated with profitability analysis. First, income taxes will not
modify the break-even cal-
culations. However, sales necessary to achieve target income
level calculations must be
amended. One simple way to perform this analysis is in two
stages. The first stage is to
calculate the break-even point. The second stage is to calculate
the additional sales needed
to reach the target income. In the second stage, it is important
to remember that fixed costs
have already been covered at the break-even point, but the
contribution margin is reduced
because of the income taxes.
To illustrate, assume the Go for Gold Mining faces the
following facts:
Fixed costs $2,000,000
waL80281_05_c05_113-140.indd 10 9/25/12 1:03 PM
123
CHAPTER 5Section 5.2 Cost–Volume–Profit Analysis
23. Variable mining costs $ 750 per ounce
Income tax rate 50%
If gold is selling for $1,500 per ounce (giving rise to a pretax
contribution margin of 50%),
and Go for Gold desires to reach an after-tax income level of
$1,000,000, how much gold
must be sold?
The first step is to calculate break-even sales:
$2,000,000 (fixed costs)/0.50 contribution margin ratio 5
$4,000,000 in sales
The second step is to calculate the additional sales to earn a
$1,000,000 profit:
$1,000,000 (target income)/0.25 revised contribution margin
ratio 5
$4,000,000 in sales. Note: 50% contribution plus 50% tax on
that same 50%
gives us 75% in contribution margin plus taxes.
Combining the sales to reach breakeven plus the additional sales
to reach the target income
level reveals that Go for Gold must sell $8,000,000 to achieve
the desired income level. You
likely noticed that the contribution margin in the second step
was only 25% instead of
50%. The reason is that any profits had to be shared 50:50 with
the government (given the
assumed 50% income tax rate). This means that the company’s
contribution was reduced
in half for all sales above the break-even point!
24. Changing Costs
Costs can naturally be expected to shift over time. These
changes will impact the struc-
tural relationships between fixed and variable components.
Management must be able to
contemplate how cost shifts will impact the business. For
instance, an increase in fixed
costs, without a change in per-unit variable costs and revenues,
will obviously increase
the break-even point. The proper analysis for an increase in
fixed cost requires that the
new total fixed cost be divided by the contribution margin.
Suppose Mustang’s total fixed
costs increased from $2,500,000 to $3,000,000. What sales level
is now necessary to break
even? Recall that the break-even point in sales can be derived
by dividing total fixed costs
by the contribution margin ratio. Thus, the new calculation of
breakeven is as follows:
$12,000,000 5 $3,000,000/0.25
The $500,000 additional fixed cost requires an additional
$2,000,000 in sales. As you can
see, the revisions in fixed costs are relatively simple to
incorporate into the break-even
framework with which you are already familiar. However, what
about changes in variable
costs? What if a new environmental regulation required that an
additional $500 be spent on
each boat to use a safer fiberglass handling process? Now, the
contribution margin is only
$2,000 per unit ($10,000 2 ($7,500 1 $500)). Assuming the
added cost cannot be passed
25. through, how will this impact the break-even point? The revised
break-even point (let’s
assume fixed costs are still $2,500,000 for this illustration) is
now calculated as follows:
$12,500,000 5 $2,500,000/0.20
waL80281_05_c05_113-140.indd 11 9/25/12 1:03 PM
124
CHAPTER 5Section 5.2 Cost–Volume–Profit Analysis
Of course, a business sometimes must choose between adding
either a fixed or a vari-
able cost. Suppose the per-unit increase in variable cost
associated with a safer fiberglass
handling process could be avoided by instead incurring a
$500,000 increase in fixed cost.
If you review the two preceding examples, you can see that
breakeven is lower with the
added fixed cost, and you might jump to the conclusion that it
would be the preferred
option. However, if the business’s sales fail to reach even the
break-even level, there is a
point at which the added fixed cost would become
disadvantageous. For example, if sales
reached only $8,000,000, Table 5.5 reveals that the loss is less
for the case in which the
increased fixed cost was avoided.
Table 5.5: Loss is less
With increased fixed cost Without increased fixed cost
26. Sales $8,000,000 $8,000,000
Less: Fixed costs ($3,000,000) ($2,500,000)
Less: Variable costs
(800 , $7,500)
($6,000,000)
Less: Variable costs
(800 , $8,000)
($ 6,400,000)
Net loss ($1,000,000) ($ 900,000)
Changing Revenues
Changes in per-unit revenue, without changes in total fixed
costs or per-unit variable cost,
can sometimes cause dramatic impacts on firm profits. This is
especially true for busi-
nesses with a low variable cost structure. Consider the example
in Table 5.6, in which firm
profits are calculated before and after a $10 per-unit increase in
selling price.
Table 5.6: Calculating profits
Before price increase After price increase
Sales (5,000 units) $500,000 $550,000
Variable costs ($40 per unit) 200,000 200,000
27. Contribution margin $300,000 $350,000
Fixed costs 275,000 275,000
Net income $25,000 $75,000
Notice that the $10 (10%) increase in selling price caused a
tripling of profits from $25,000
to $75,000. This simple illustration shows the importance of
small adjustments in selling
prices. Of course, markets are at times very sensitive to pricing.
Customers may not be
willing to pay the added $10, which can cause a reduction in
per-unit sales. Management
must be very careful in setting its pricing policies.
waL80281_05_c05_113-140.indd 12 9/25/12 1:03 PM
125
CHAPTER 5Section 5.3 CVP Assumptions
Multiple Products
Most businesses offer more than one product. Each product may
have a different selling
price, contribution margin, and contribution margin ratio. This
has the potential to com-
plicate CVP analysis. Now, knowledge is also required about
the proportion of total sales
attributable to each product.
To illustrate, assume that Infusion Technology sells hospital
medication pumps and dis-
28. posable cassettes that hold various medications. The pumps sell
for $5,000 and have vari-
able costs of $4,000. The contribution margin is therefore
$1,000 per pump. The cassettes
sell for $20 and have variable costs of $10, giving rise to a $10
per-unit contribution mar-
gin. Infusion Technology sells 1,000 cassettes for each pump
sold. How many pumps and
cassettes must be sold to cover the business’s $1,100,000 of
total fixed costs? Consider
that a product “unit” typically consists of one pump and 1,000
cassettes. Thus, the “unit”
would have a contribution margin of $11,000, as shown in Table
5.7.
Table 5.7: Contribution margin
Contribution margin
Pump 1 item at $1,000
Cassette 1,000 items at $10 5 $10,000
“Unit contribution” $11,000
To recover $1,100,000 of fixed cost requires sales of 100
“units” ($1,100,000/$11,000). This
is equivalent to selling 100 pumps and 100,000 cassettes. Total
break-even sales equal
$2,500,000 (($5,000 3 100 pumps) 1 ($20 3 100,000 cassettes)).
This break-even sales level
would shift dramatically if the product mix is not as projected.
Pumps have a much lower
contribution margin than cassettes, and increasing their sales
(without a corresponding
increase in the high-margin cassettes) would cause a dramatic
29. shift in the break-even level
of sales.
5.3 CVP Assumptions
The CVP techniques illustrated in this chapter are simply
models of cost behavior. Financial models are typically based
on various assumptions. Violating an assump-
tion can cause a model to produce misleading results. Therefore,
it is very important for
you to consider the assumptions of CVP in Table 5.8.
waL80281_05_c05_113-140.indd 13 9/25/12 1:03 PM
126
CHAPTER 5Section 5.3 CVP Assumptions
Table 5.8: Assumptions of CVP
Inventory levels Constant, with the number of units sold
equaling the number of units
produced. Fluctuations in inventory would result in
a portion of the
variable and fixedcostsbeing transferred in and
out of inventory rather
than income.
Identification of costs Costs can be clearly and
reliably identified as fixedand variable in
nature.
Preservation of linearity Variable costsare constant
per unit, and total fixedcostsare stable and
30. constant over the relevant range of activity.
Revenues are constant per
unit.
Product mix ratios meet
expectations
Revenues are constant per unit, and multiple-product
firms meet the
expected product mix ratios.
Direct Costing
Now that you have examined the contribution margin and how it
can be useful in corpo-
rate analysis, it is time to expand upon the concept to see how it
dovetails with report-
ing. Two general models can be used to measure and report
income for a manufacturer.
One is absorption (or full) costing. It is the model with which
you are currently familiar,
and it is required for external reporting purposes. There is an
alternative model, accept-
able only for internal use, called direct (or variable) costing.
Each has its advantages and
disadvantages.
Absorption costing provided the basis for prior chapter
illustrations. Under this tech-
nique, all manufacturing costs are deemed to be product costs
and are therefore included
in inventory. When sold, the full cost of inventory is transferred
to cost of goods sold. The
result is that gross profit is reduced by all costs of
manufacturing, including direct mate-
rials, direct labor, and variable and fixed manufacturing
31. overhead. Also recall that sell-
ing, general, and administrative costs (SG&A) are classified as
period expenses, whether
fixed or variable in nature. Generally accepted accounting
principles (GAAP) require this
approach based on the premise that inventory should be
measured and reported at its
complete cost. There is obvious merit to this conclusion. A
product could likely not be
produced without a certain amount of fixed manufacturing
overhead, and it seems inap-
propriate to exclude such costs as one attempts to report on
their manufacturing profits.
Variable (direct) costing only assigns variable product costs to
inventory and cost of
goods sold. Thus, product costs are deemed to include direct
materials, direct labor, and
variable manufacturing overhead. The fixed manufacturing
overhead is regarded as a
period cost. Table 5.9 highlights the difference in perspective
between absorption and
variable costing.
waL80281_05_c05_113-140.indd 14 9/25/12 1:03 PM
127
CHAPTER 5Section 5.3 CVP Assumptions
Table 5.9: Absorption versus variable costing
Absorption costing Variable costing
32. Product cost Period cost Product cost Period cost
Direct material ✔ ✔
Direct labor ✔ ✔
Variable manufacturing overhead ✔ ✔
Fixed manufacturing overhead ✔ ✔
Variable SG&A ✔ ✔
Fixed SG&A ✔ ✔
In light of GAAP’s requirement for absorption costing, and the
associated arguments
in support of this view, why might a company opt for variable
costing for internal use?
Regardless of the claims in support of absorption costing, it
does suffer from some limita-
tions that can impede appropriate management decisions.
Absorption costing does not
necessarily provide the best signals about product pricing,
whether to continue to produce
a product, whether to accept a special order, and similar
decisions. With variable costing,
fixed manufacturing costs are shifted from product costs to
period costs because they will
be incurred no matter the level of production. Simply stated, in
many cases, a company
should continue to produce a product that has a positive
contribution margin, even if the
overall results still appear to be producing a loss; the loss
would be larger if the fixed costs
were incurred and nothing was produced. Absorption costing
does not illuminate this
33. reality in a way that enables good decisions. Numerous similar
situations can arise. This is
a very important concept and bears much deeper analysis via a
series of examples.
Assume that Home Pride produces 500,000 loaves of bread per
month, and per-unit costs
are $0.45 for direct material, $0.30 for direct labor, and $0.25
for variable factory over-
head. Total fixed factory overhead amounts to $250,000. Under
absorption costing, a loaf
of bread costs $1.50 to produce. This consists of variable costs
($0.45 1 $0.30 1 $0.25 5
$1) and fixed costs ($250,000/500,000 loaves 5 $0.50). Under
variable costing, the prod-
uct cost includes just the $1.00 of variable manufacturing
components. If Home Pride is
approached by Super Grocery to produce a private-label bread
product, and Super Gro-
cery is willing to pay $1.25 per loaf, should Home Pride accept
the deal? Home Pride has
evaluated the transaction and concluded that it will not result in
any added variable or
fixed SG&A costs, and it will not cause a reduction in sales of
its own bread products.
With absorption costing, it appears that the offer should be
rejected. Why sell something
for $1.25 when it costs $1.50 to produce? This seems obviously
irrational. Conversely, vari-
able costing suggests that a profit of $0.25 per loaf will result
by accepting Super Grocery’s
offer. Which decision is right? Management may well decide to
accept the offer to enhance
profits. It is important to recall that no other costs will be
incurred. Reliance on absorption
costing for decision making could have resulted in this
34. opportunity having been missed.
Very likely, you are now beginning to understand why some
companies prefer a variable
costing structure for internal measurement and decision-making
purposes.
waL80281_05_c05_113-140.indd 15 9/25/12 1:03 PM
128
CHAPTER 5Section 5.3 CVP Assumptions
Comprehensive Income Statements Under Variable and
Absorption Costing
The preceding discussion focused on the general structure of
income measurement under
absorption and variable costing. The Home Pride example
further assumed that SG&A
was unaffected by the decision to sell to Super Grocery. That
assumption would often
not be valid. Variable SG&A typically increases along with
rising sales, and this factor
will be reflected in a variable costing income statement.
Consider the following income
statements for Garcia Company. Garcia does not maintain
inventory, and it sells all that
is produced each period. As a result, total income is the same,
whether measured under
absorption or variable costing. The difference, therefore, is only
in how the data are pre-
sented. Absorption costing will focus on an intermediate
subtotal relating to gross profit.
This is a different focus than with variable costing, in which the
35. emphasis is on contribu-
tion margins. Begin by closely examining the absorption costing
income statement shown
in Exhibit 5.5, and then review the additional commentary that
follows.
Exhibit 5.5
Under absorption costing, assume the $500,000 cost of goods
sold consists of direct mate-
rials ($150,000), direct labor ($200,000), and variable ($50,000)
and fixed manufacturing
overhead ($100,000). Gross profit is reduced by SG&A, which
is assumed to be $125,000
variable and $75,000 fixed. When these same factors are
rearranged and presented as in
a variable costing income statement format, you will first notice
that all variable costs
are subtracted from sales to arrive at the contribution margin.
Garcia Company further
divides the contribution margin between the manufacturing
margin and the overall mar-
gin, after subtracting variable SG&A (Exhibit 5.6).
Sales
Cost of goods sold
Gross profit
Less: Variable SG&A
Fixed SG&A
Net income
36. $ 125,000
75,000
$1,000,000
500,000
$ 500,000
200,000
$ 300,000
GARCIA COMPANY
Absorption Costing Income Statement
For the Year Ending December 31, 20XX
waL80281_05_c05_113-140.indd 16 9/25/12 1:03 PM
129
CHAPTER 5Section 5.3 CVP Assumptions
Exhibit 5.6
Fluctuating Inventory
You may be wondering what happens if inventory levels
fluctuate. With absorption cost-
ing, inventory will carry all manufacturing costs, whereas only
variable manufacturing
costs are assigned to inventory with variable costing.
Generalizing, therefore, inventory is
37. measured at a higher value with absorption costing; in other
words, certain costs (a por-
tion of the fixed manufacturing overhead) are placed in
inventory that would otherwise
be expensed immediately under variable costing. This means
that income is higher with
absorption costing in those periods during which inventory
levels are increasing. Let’s
revisit Garcia Company, this time assuming that sales are 10%
less, and the unsold units
become part of ending inventory. The income statements
(Exhibits 5.7 and 5.8) show how
income is higher under absorption costing by $10,000. This is
exactly as expected. In other
words, 10% of the $100,000 of fixed manufacturing overhead is
assigned to inventory
under absorption costing versus what is expensed under variable
costing.
Sales
Less: Variable product costs
Manufacturing margin
Less: Variable SG&A
Contribution margin
Less: Fixed factory cost
Fixed SG&A
Net income
$ 100,000
38. 75,000
$1,000,000
400,000
$ 600,000
125,000
$ 475,000
175,000
$ 300,000
GARCIA COMPANY
Variable Costing Income Statement
For the Year Ending December 31, 20XX
waL80281_05_c05_113-140.indd 17 9/25/12 1:03 PM
130
CHAPTER 5Section 5.4 Evaluating Residual Income
Exhibit 5.7
Exhibit 5.8
5.4 Evaluating Residual Income
39. Comparing income measures under absorption and variable
costing provides helpful clues to guide correct managerial
decisions. However, these measures are not a pana-
cea for management. Additional economic facets must be
considered. For instance, neither
measure adjusts income for the embedded amount of capital that
must be deployed to gen-
erate the reported income numbers. In other words, the level of
stockholder investments
is not factored into the basic income calculations. If two
businesses each generate income
of $1,000,000 but one of the businesses has stockholder
investments of $5,000,000 and the
other has stockholder investments of $10,000,000, it is apparent
that the former business
Sales
Less: Variable product costs
Manufacturing margin
Less: Variable SG&A
Contribution margin
Less: Fixed factory cost
Fixed SG&A
Net income
$ 100,000
75,000
40. $ 900,000
360,000
$ 540,000
112,500
$ 427,500
175,000
$ 252,500
GARCIA COMPANY
Variable Costing Income Statement
For the Year Ending December 31, 20XX
Sales
Cost of goods sold
Gross profit
Less: Variable SG&A
Fixed SG&A
Net income
$ 112,500
75,000
$ 900,000
41. 450,000
$ 450,000
187,500
$ 262,500
GARCIA COMPANY
Absorption Costing Income Statement
For the Year Ending December 31, 20XX
waL80281_05_c05_113-140.indd 18 9/25/12 1:03 PM
131
CHAPTER 5Section 5.4 Evaluating Residual Income
is generating a better rate of return on the amount of invested
capital. Thus, not only is it
important that a business have profitable operations to maintain
long-run economic viabil-
ity but also it must generate returns that are sufficient to justify
the investment. In a later
chapter, you will study many capital budgeting tools that aid in
these evaluations.
However, you are already in a position to consider the concept
of residual income. Like vari-
able costing, residual income is not a GAAP-based measure.
Instead, it is another internal
financial assessment technique. Residual income provides a
scale of business success or fail-
42. ure after adjusting for the presumed cost of capital. The cost of
capital is the theoretical rate
that funds could earn if invested in alternative use. The cost of
capital varies by firm and is
based on general economic conditions. Although there are
variations in the way in which
residual income could be measured, one general approach is
based on this formulation:
Residual Income 5 Operating Income 2 (Operating Assets 3
Cost of Capital)
To see how residual income can be used for business
assessments, begin by looking at the
data for two separate business segments in Table 5.10.
Table 5.10: Data for two business segments
Segment A Segment B
Operating income $ 250,000 $500,000
Less: Cost of capital
Segment A capital $3,000,000 3 5% cost of capital (150,000)
Segment B capital $9,000,000 3 5% cost of capital (450,000)
Residual income $ 100,000 $ 50,000
At first glance, it appears that Segment B is more successful
because its operating income
is twice that of Segment A. However, Segment B has much more
capital invested in opera-
tions ($9,000,000 for B vs. $3,000,000 for A). Assuming a 5%
cost of capital, Segment A’s
43. residual income is twice that of Segment B. This information
casts the relative success of
the two divisions in a completely different light. Thus, residual
income can be a powerful
tool for identifying and ranking the performance of segments,
products, and other com-
ponents of business activity.
As with most analysis techniques, great care must be taken in
interpreting residual income.
Conclusions can be impacted by the assumption about the cost
of capital and different rank-
ings achieved by revisions in interest rates. In addition,
management needs to understand
the accounting principles that were used to measure operating
income. For example, a unit
may be spending heavily on developmental costs. Were these
costs expensed? If so, then
near-term income could be negatively impacted. In the long
term, those same costs (having
already been expensed) would be excluded from the calculation
of invested capital and per-
haps inflate the residual income in the latter stages of a project.
Thus, management needs
to be very careful in interpreting residual income. Nevertheless,
when used appropriately,
the technique is highly valuable in helping a business identify
and rank products, segments,
and business activities. It is crucial that business decisions
about which products and ser-
vices to offer, or cease to offer, be made with deliberate care
and attention to detail.
waL80281_05_c05_113-140.indd 19 9/25/12 1:03 PM
44. 132
CHAPTER 5Concept Check
Concept Check
The five questions that follow relate to several issues raised in
the chapter. Test
your knowledge of the issues by selecting the best answer. (The
correct answers can
be found at the end of your text.)
1. Variable costs (from the accountant’s viewpoint)
a. are graphed by means of a curvilinear line.
b. remain constant in total through the relevant range.
c. are constant on a per-unit basis through the relevant range.
d. are commonly divided into committed and discretionary
classifications.
2. The high–low method of analyzing cost behavior
a. can be used to determine the variable and fixed components
of a mixed cost
function.
b. uses the same number of data observations as a
scattergraph.
c. relies on the following computation to figure the variable
cost per unit (or hour):
Change in activity between the high and low points / change in
cost between the
high and low points.
d. results in different amounts of fixed cost at the high and
low data points.
45. 3. Foster Company has sales of $800,000, variable costs that
total 60% of sales, and
fixed costs of $180,000. The firm’s break-even point is
a. $140,000.
b. $300,000.
c. $450,000.
d. $560,000.
4. The contribution margin
a. is the amount that each unit contributes toward covering
variable costs and
producing income.
b. is the result of subtracting both the variable and fixed costs
per unit from the
selling price.
c. may, in select cases, be less than net income.
d. is the difference between a unit’s selling price and variable
cost and, when
divided into fixed costs, will produce the unit sales required to
break even.
5. The cost–volume–profit model
a. can be used only by single-product companies.
b. assumes that the sales mix will remain as predicted.
c. assumes that technology, efficiency, and costs can change.
d. cannot be used to study operating changes of the firm.
waL80281_05_c05_113-140.indd 20 9/25/12 1:03 PM
46. 133
CHAPTER 5Critical Thinking Questions
Critical Thinking Questions
1. Define the break-even point.
2. Define the contribution margin. What does the contribution
margin represent, and
how is it used in finding the break-even point?
3. Product A has a negative contribution margin. Explain how
a negative contribution
margin can arise, and determine whether product A should
continue to be sold.
4. Discuss the benefits associated with using a break-even
chart.
5. Determine the effect, if any, on the break-even point that
each of the following
events would have:
a. An increase in sales price
b. A decrease in fixed cost
c. An increase in the number of units sold
6. Will a change in a company’s sales mix likely affect the
break-even point? Briefly
explain.
7. What are the limiting assumptions of CVP analysis?
absorption costing A technique by which
all manufacturing costs are deemed to be
product costs and are therefore included in
inventory.
47. break-even chart Used to allow the user
to observe the unit sales volume that is
necessary for a company to break even.
contribution margin At the core of a CVP
analysis, and it represents revenues minus
all variable expenses.
cost–volume–profit (CVP) analysis
The process of providing a foundation for
pricing decisions, product offerings, and
management of an organization’s cost
structure.
high–low method A method of identify-
ing the highest and lowest levels of activity
and where the difference in cost is deemed
to be representative of the variable portion.
margin of safety The amount by which
sales exceed the break-even sales level.
mixed costs A type of cost that entails
a fixed component and a variable
component.
operating leverage Refers to the amount
of increase in income associated with an
increase in sales, based on the differences
in slope between the total revenue line and
the variable cost line.
residual income An internal financial
assessment technique that provides a scale
of business success or failure after adjust-
ing for the presumed cost of capital.
48. targeted income A measuring point for a
company to pinpoint the amount of sales
that will be required to reach financial
goals.
variable (direct) costing A method in
which variable product costs are assigned
to inventory and cost of goods sold. Prod-
uct costs are deemed to include direct
materials, direct labor, and variable manu-
facturing overhead.
Key Terms
waL80281_05_c05_113-140.indd 21 9/25/12 1:03 PM
134
CHAPTER 5Exercises
Exercises
1. High–low method
The following cost data pertain to 20X6 operations of Heritage
Products:
Quarter 1 Quarter 2 Quarter 3 Quarter 4
Shipping costs $58,200 $58,620 $60,125 $59,400
Orders shipped 120 140 175 150
The company uses the high–low method to analyze costs.
49. a. Determine the variable cost per order shipped.
b. Determine the fixed shipping costs per quarter.
c. If present cost behavior patterns continue, determine total
shipping costs for
20X7 if activity amounts to 570 orders.
2. Break-even and other CVP relationships
Delta Gamma Upsilon sorority is in the process of planning its
annual homecoming
dinner and dance. The treasurer anticipates the following costs
for the event, which
will be held at the Regency Hotel:
Room rental $300
Dinner cost (per person) 25
Chartered buses 500
Favors and souvenirs (per person) 5
Band 900
Each person would pay $40 to attend; 200 attendees are
expected.
a. Will the event be profitable for the sorority? Show
computations.
b. How many people must attend for the sorority to break
even?
c. Suppose the sorority encouraged its members to drive to the
hotel and did not
charter the buses. Furthermore, a planned menu change will
50. reduce the cost per
meal by $2. If each member will still be charged $40, compute
the contribution
margin per person.
3. Break-even and other CVP relationships
Cedars Hospital has average revenue of $180 per patient day.
Variable costs are $45
per patient day; fixed costs total $4,320,000 per year.
a. How many patient days does the hospital need to break
even?
b. What level of revenue is needed to earn a target income of
$540,000?
c. If variable costs drop to $36 per patient day, what increase
in fixed costs can be
tolerated without changing the break-even point as determined
in part (a)?
waL80281_05_c05_113-140.indd 22 9/25/12 1:03 PM
135
CHAPTER 5Exercises
4. CVP relationships: Working backward
Determine the missing amounts in each of the independent cases
that follow:
Case Units
sold
Sales Variable
51. costs
Contribution
margin per unit
Fixed
costs
Net
income
A ? $70,000 $ ? $6 $14,000 $10,000
B 7,000 ? 42,000 5 ? 8,000
C 4,000 53,000 ? ? 21,000 (2,000)
D 8,000 92,000 40,000 ? 24,000 ?
5. Direct and absorption inventory costing
Milsap Industries began business on January 1 of the current
year, manufacturing
and selling a single product. Consider the data that follow:
Units Variable cost per unit Fixed costs
Production volume 80,000
Sales volume 72,000
Direct materials $1.30
Direct labor 2.80
Factory overhead 4.40 $540,000
52. Selling expenses 0.20 180,000
a. Compute the cost of the company’s ending inventory by
using direct costing.
b. Compute the cost of the company’s ending inventory by
using absorption costing.
c. Suppose that Milsap’s accountant had accidentally excluded
straight-line depre-
ciation on machinery from the data presented. Determine the
effect of this error
(overstate, understate, or no impact) on the company’s
1) direct costing ending inventory.
2) absorption costing ending inventory.
6. Direct and absorption income computations
Crawford Company began operations on January 1 of the
current year. The follow-
ing information has been gathered from the accounting records:
Variable costs per unit
Manufacturing: $12.50
Selling & administrative: $1.10
Fixed costs
Manufacturing: $120,000
Selling & administrative: $60,000
waL80281_05_c05_113-140.indd 23 9/25/12 1:03 PM
136
CHAPTER 5Problems
53. Production and sales amounted to 80,000 units and 75,000 units,
respectively.
The selling price is $17.
a. Compute net income for the year just ended by using the
direct costing method.
b. Compute net income for the year just ended by using the
absorption costing
method.
Problems
1. Cost behavior and analysis
The chief accountant of Stevenson Corporation is studying
certain costs (direct
labor, plant security, utilities, and maintenance) in an effort to
better control opera-
tions. Normal production activity ranges from 7,500 to 8,000
units per month. In
the past 3 months, the following cost behavior has been
observed:
Month 1 Month 2 Month 3
Production (units) 7,540 7,950 7,680
Direct labor $18,850 $19,875 $19,200
Plant security 14,600 14,600 14,600
Utilities 28,044 29,520 28,548
In addition, maintenance costs have displayed the following
step behavior:
54. Activity range (units) Cost
Up to 7,600 $ 8,000
7,601–7,800 9,500
7,801–8,000 11,000
Stevenson uses the high–low method to analyze cost behavior.
Instructions
a. Production for next month is expected to total 7,850 units.
Calculate the cost of
direct labor, plant security, utilities, and maintenance for this
level of activity.
b. Comment on the cost-effectiveness of producing at a 7,850-
unit level of activity
with respect to maintenance costs. If you believe this is an
ineffective production
level, describe how effectiveness could be improved.
c. There is a high probability that Stevenson’s production
volume will nearly double
in forthcoming months because of a new customer. Can the data
and methods
used in part (a) for predicting the cost of 7,850 units be
employed to estimate total
costs for, say, 17,500 units? Why?
waL80281_05_c05_113-140.indd 24 9/25/12 1:03 PM
55. 137
CHAPTER 5Problems
2. Break-even and other CVP analysis
Hodge and Best manufactures a single product. The information
that follows
relates to current operations:
Sales (80,000 units , $15) $1,200,000
Less: Variable cost $720,000
Fixed cost 360,000 1,080,000
Net income $ 120,000
Instructions
a. The sales outlook for next year is bleak. Calculate the
number of units that must
be sold to break even if current revenue and cost behavior
patterns continue.
b. If Hodge and Best wishes to earn a target income of
$90,000 during the next
accounting period, what level of dollar sales must be generated?
c. Management is studying an increase in the selling price to
$18 per unit. If con-
sumers balk and volume drops, calculate the number of units
that must be sold
to earn the target income of $90,000. Should the change be
implemented? Why?
d. Hodge and Best’s projected break-even point and target
56. income are the result of
interactions of numerous financial events and transactions.
Determine the impact
of the following operating changes by filling in the blanks
below with “increase,”
“decrease,” or “not affect.”
1) An increase in direct labor cost will
_______________________ total
variable costs, _______________________ the contribution
margin, and
_______________________ the break-even point.
2) An increase in plant insurance will
_______________________ the break-even
point and _______________________ the dollar sales level
calculated in part (b).
3. Straightforward CVP analysis
FRB Inc. sells a single product for $40. The following costs and
expenses were
incurred at store No. 504:
Variable costs per unit Annual fixed costs
Invoice cost $24 Salaries $60,000
Sales commission 4 Advertising 14,000
Other 16,000
The company sold 8,200 units during 20X4.
Instructions
a. Compute the 20X4 break-even point in both dollar and unit
sales.
57. b. By how much will sales have to increase in 20X5 over
20X4 levels if management
wishes to earn a target income of $14,400?
waL80281_05_c05_113-140.indd 25 9/25/12 1:03 PM
138
CHAPTER 5Problems
c. At present, how much does each unit provide toward
covering FRB’s fixed costs
and generating income? Assume that management believes this
amount is too
low. What alternatives are available to FRB?
d. What would be the effect on the break-even point if
management reduced salary
costs by $11,600 and increased the $4 sales commission by
20%?
4. Break-even and other CVP analysis
Quebec Inc. manufactures and sells a single product. The
information that follows
relates to the year just ended, when 230,000 units were sold:
Sales price per unit $ 10
Variable cost per unit 4
Fixed costs 930,000
Instructions
58. a. Determine the number of units that Quebec sold in excess of
its break-even point.
b. If current revenue and cost patterns continue, compute the
dollar sales needed
next year to produce a target income of $492,000.
c. Assume that a different compensation plan was in effect
during the current year.
Rather than pay six salespeople an average salary of $36,000
each, management
has proposed that the salespeople receive a $10,000 base salary
and a 6% commis-
sion based on gross sales.
1) Would the company have been better off financially if the
new plan had been
adopted for the year just ended? By how much?
2) What effect might paying a commission have on gross sales?
Briefly explain.
d. In addition to the compensation plan described in part (c),
Quebec is studying
the impact of other operating changes as well. State whether
you agree or dis-
agree with the following findings of a newly hired staff
accountant:
1) A rise in property taxes will increase the break-even point.
2) A decrease in raw material cost will increase the
contribution margin and
decrease total fixed costs.
5. Direct and absorption costing
59. The following information pertains to Turbo Enterprises for the
year ended
December 31, 20X8:
Variable cost per unit:
Direct materials $ 6
Direct labor 4
Factory overhead 9
Selling & administrative expense 3
Total $ 22
waL80281_05_c05_113-140.indd 26 9/25/12 1:03 PM
139
CHAPTER 5Problems
Annual fixed costs:
Factory overhead $600,000
Selling &. administrative expense 115,000
Total $715,000
Other data (units):
Sales 21,000
60. Production 25,000
Inventory, 12/31/X8 11,000
The unit selling price is $62. Assume that costs have been
stable in recent years.
Instructions
a. Compute the number of units in the beginning inventory on
January 1, 20X8.
b. Calculate the cost of the December 31 inventory assuming
use of
1) direct costing.
2) absorption costing.
c. Prepare an income statement for the year ended December
31, 20X8, by using
direct costing.
d. Prepare an income statement for the year ended December
31, 20X8, by using
absorption costing.
6. Direct and absorption costing
The information that follows pertains to Consumer Products for
the year ended
December 31, 20X6:
Inventory, 1/1/X6 24,000 units
Units manufactured 80,000
Units sold 82,000
Inventory, 12/31/X6 ? units
61. Manufacturing costs:
Direct materials $3 per unit
Direct labor $5 per unit
Variable factory overhead $9 per unit
Fixed factory overhead $280,000
Selling & administrative expenses:
Variable $2 per unit
Fixed $136,000
waL80281_05_c05_113-140.indd 27 9/25/12 1:03 PM
140
CHAPTER 5Problems
The unit selling price is $26. Assume that costs have been
stable in recent years.
Instructions
a. Compute the number of units in the ending inventory.
b. Calculate the cost of a unit assuming use of
1) direct costing.
2) absorption costing.
c. Prepare an income statement for the year ended December
62. 31, 20X6, by using
direct costing.
d. Prepare an income statement for the year ended December
31, 20X6, by using
absorption costing.
waL80281_05_c05_113-140.indd 28 9/25/12 1:03 PM
NUR 3870 Informatics in Health Care
Group Informatics Presentations
Directions:
- determine Team Leader (see responsibilities
below); determine assignments
based on rubric; determine due dates, etc.
o As a Group, complete a literature review, then create a
PowerPoint presentation to
be shared
o Be creative!
rubric on the following
63. pages as your guide!
Additional Responsibilities of the Team Leader:
-
Review areas:
o Finished presentation file as a ppt type of file
o A summary page in Word doc
o The reference list in Word doc
NUR 3870 Informatics in Health Care
Group Informatics Presentations
Please Review these Guidelines for Success!
Title Slide
& authors (all active Group members)
Abstract
citations here
-5 keywords)
64. Objectives
able to:
o At least 3 [these need to be clear, concise, and measurable]
Content:
Introduction of the Topic
o Background information on topic
o Define any key terms
o Provide specific information on concepts
o Provide specific examples as appropriate
o Be sure all objective content has been covered
Conclusion
o Restate key concepts
o Review the objectives
o *What do you want your audience to remember or take away
from this project?
Presentation
65. Reference List
file
Summary Page- As a Group….
Team Leader, please compile your Group’s answers into one
Word or pdf document
time?
ord or pdf file
NUR 3870 Informatics in Health Care
Group Informatics Presentations
Grading Rubric!!!
Possible Points
67. chapter 4
Costing Methods
Learning Objectives
• Understand the ethical duty of managerial accountants to
provide proper costing
information.
• Apply concepts and techniques that are used to fairly
measure and report job costs.
• Be able to track job costs, including overhead, through a
typical accounting system.
• Understand alternative costing concepts, such as process
costing and activity-based
costing.
istockphoto
waL80281_04_c04_083-112.indd 1 9/25/12 1:02 PM
84
CHAPTER 4Chapter Outline
Chapter Outline
68. 4.1 Job Costing
Job Costing and the Ledger
Actual Overhead
Differences Between Actual and Applied Overhead
Mandatory Reporting of Overhead
Job Costing Is Not Only for Manufacturing
4.2 Process Costing Environments
Cost of Production Report
Case Study in Process Costing
4.3 Activity-Based Costing
ABC Modeling
ABC Example
What is the cost of producing a product or service? To the
untrained accountant, this question seems simple enough. But,
the more you learn about accounting, the more
difficult this question becomes to answer. How does one
identify all of the necessary ele-
ments that are needed to produce an output? The answer to this
question necessarily
includes direct material and direct labor. But you are also very
familiar with other factory
and nonfactory-related costs that must be incurred before a
product may be produced.
Typically, accountants will devise schemes by which costs are
captured and assigned to
products. When an accountant reports on the cost of a product
or service, he or she is
really reporting on measurements based on systematic processes
for cost assignment.
Accountants should not be flippant in developing their costing
procedures. Key busi-
ness decisions that impact the allocation of business resources,
69. and ultimately peoples’
livelihoods, are at stake. As such, accountants have a high
ethical duty to develop and
correctly deploy fair and defensible models for product costing.
This chapter provides
insight into costing techniques that offer general acceptability
in arriving at an answer to
the all-important question about the cost of a product or service.
Several methods can be used for costing purposes. They are
somewhat dependent on the
nature of the product that is being produced and/or the process
by which production
occurs. One such method is job costing, which is best suited to
those situations in which
goods and services are produced upon receipt of a customer
order, according to customer
specifications, or in separate batches. For example, a home
builder would likely accumulate
costs for each unique house that it produces. Materials and labor
can be readily identified
with each house, and the costing method will accumulate costs
accordingly. In contrast,
process costing captures costs for each process or department. It
is applicable to homog-
enous goods that are produced in batches or continuous
processes. An example is the pro-
duction of candy. Candy might be produced in stages such as
mixing, cutting, and cooking.
Within the mixing department, the cost of all ingredients and
labor is accumulated and
divided across the total pounds of finished goods to find a per-
pound (or other measure)
cost for the mixed material. Similar cost assignment processes
are followed within each
department to arrive at the cost of a final box of candy. The
70. bulk of the remainder of this
chapter will introduce you to the key components in job and
process costing techniques.
waL80281_04_c04_083-112.indd 2 9/25/12 1:02 PM
85
CHAPTER 4Section 4.1 Job Costing
Accountants have long thought about costing methods and have
challenged the basic
assumptions on which costing decisions are made. There is
considerable literature on this
subject, and alternative models have been proposed. One model
that has a strong group
of proponents is activity-based costing. This chapter will close
with a brief introduction
to this alternative approach to answering questions about what a
product or service costs.
4.1 Job Costing
Job costing entails the development of a tracking system or
database by which costs are matched to jobs. This generally
entails specifically identifying the amount of direct
labor and direct material that is used on a specific job. The
other overhead costs are then
assigned to a job by reliance on a predetermined overhead
allocation formula. One com-
mon approach is to take the period’s total anticipated overhead
and divide it by the antici-
pated labor hours to arrive at an amount of overhead that is
expected to be incurred “per
71. labor” (overhead can be applied on other application bases, such
as material usage; the
goal is to try to closely associate overhead to jobs based on
consumption of overhead).
A logical starting point for costing a job is to determine the
amount of direct labor that
is attributable to a specific job. Employees typically complete
reports (via a time card,
electronic clock, spreadsheet, etc.) indicating the amount of
time they worked. From the
employees’ perspective, these time reports are important
because they may be used to
establish how much they are owed (i.e., how many hours they
worked). However, in addi-
tion to hours worked, time reports usually have codes to
identify the work performed.
These codes can be matched to specific tasks on specific jobs,
but they will also include
time spent on travel, breaks, job setups, and other work-related
tasks that do not track to a
specific product that is being produced. By querying the
company’s accounting system, it
then becomes possible to determine all of the direct labor time
that was spent on a specific
job. The indirect labor costs not traced to a specific job become
part of the overhead cost
pool, which is allocated across all jobs using the overhead
application rate.
Direct materials are assigned to jobs in a manner very similar to
direct labor. It is very
important that material that is used on a specific job be matched
to the job. Just as employees
are expected to maintain time records, they should also
complete materials requisition
72. forms. These forms are used to pull raw materials from
inventory and transfer them into
work in process. A very detailed coding system must be
established that allows tracking
of material from inventory into a specific job. Sometimes, a
materials requisition form will
only show inventory by part number and not identify the cost of
the material. When this
is the case, additional systems must be put in place to
subsequently allow the company
to identify the cost of the materials. Great care must always be
taken to match the right
cost to the right item and the right item to the right job. Indirect
materials, such as tape,
screws, and touch-up paint, are not traced to a specific job.
These costs should instead be
contemplated in the overhead cost pool that is allocated among
all jobs.
Previously, it was mentioned that a predetermined overhead rate
is used to assign over-
head to a particular job. It has likely already occurred to you
that there can be differences
between the actual overhead incurred and the amount applied to
production via the pre-
determined overhead application rate. This difference cannot be
ignored indefinitely, and
you will soon see how it is to be processed. For the moment,
let’s not be concerned with
those potential differences and instead focus on a job cost sheet
(Exhibit 4.1) that sum-
marizes direct labor, direct material, and overhead cost that is
applied to a particular job:
waL80281_04_c04_083-112.indd 3 9/25/12 1:02 PM
73. 86
CHAPTER 4Section 4.1 Job Costing
Exhibit 4.1
D
ir
e
ct
L
a
b
o
r
S
o
u
rc
e
C
o
d
e
R
a
te
H
94. O
S
T
S
H
E
E
T
L
a
b
o
r
H
o
u
rs
waL80281_04_c04_083-112.indd 4 9/25/12 1:02 PM
87
CHAPTER 4Section 4.1 Job Costing
Exhibit 4.1 is quite typical. The direct labor hours are drawn
from the employee time cards
and associated with each employee’s wage rate. The direct
materials are drawn from the
95. materials requisition forms (or similar documents) and
associated with the cost of specific
inventory items, and the overhead is applied based on the
predetermined rates.
Be aware that technology can greatly facilitate preparation of
job cost sheets. For instance,
materials can be automatically tracked to jobs by scanners and
radio frequency identifica-
tion chips. Furthermore, the job cost sheet is really just a
compilation of data into a use-
ful report format. The data may be mined from within a
sophisticated database. Beyond
this summarized data, you also need to recognize that
information must be captured by
a company’s general ledger system and lead to the preparation
of aggregated data for
reporting purposes.
Job Costing and the Ledger
The data, which are foundational for the preceding job cost
sheet, must also be transferred
to a company’s general ledger system. A robust information
system will do this quite
easily and automatically. However, it is necessary for you to see
the debit/credit process
to fully comprehend the cost flow through an accounting system
and into the resulting
financial statements.
Let’s begin by considering the cost flows for the various factors
of production. The typical
sequence of steps for direct materials entails the purchase of
raw materials from a sup-
plier, a transfer of raw materials into work in process as
96. production occurs, the transfer
of the cost of completed goods into finished goods inventory,
and finally the transfer of
inventory to cost of goods sold when products are sold and
delivered to a customer. Direct
labor is slightly simpler because the first step is essentially not
applicable. As wages are
incurred, those costs are accumulated straight into Work in
Process. Upon completion,
the labor cost is transferred to Finished Goods Inventory and
then on to Cost of Goods
Sold at the time of sale. The factory overhead items, such as
factory depreciation, main-
tenance, supplies, indirect labor, and indirect material, are not
directly added to Work in
Process. Instead, these costs are introduced into Work in
Process based on the predeter-
mined application base; if overhead is applied based on labor
hours, it may well be that
overhead is attached concurrent with direct labor costs. The
following entries illustrate
the full process for assigning job costs. Carefully review each
entry, taking special note of
the related journal entry description:
10-1-X2 Raw Materials Inventory 965
Accounts Payable 965
To record purchase of materials, placing costs into raw
materials inventory
10-15-X2 Work in Process Inventory 1,947
Raw Materials Inventory 965
97. Salaries Payable 564
Factory Overhead 418
To transfer raw materials to production, record direct labor
costs on job, and apply overhead
at the predetermined rate of $11 per direct labor hour
waL80281_04_c04_083-112.indd 5 9/25/12 1:02 PM
88
CHAPTER 4Section 4.1 Job Costing
10-24-X2 Finished Goods Inventory 1,947
Work in Process Inventory 1,947
To transfer total cost of a completed unit to finished goods
inventory
10-28-X2 Accounts Receivable 2,500
Sales 2,500
To record sale of finished for $2,500
Cost of Goods Sold 1,947
Finished Goods Inventory 1,947
To remove cost of sold unit from the finished goods inventory
Actual Overhead
98. Students are sometimes slightly confused by their first exposure
to the accounting for
factory overhead. In previous chapters, you saw how salaries,
utilities, depreciation, the
consumption of supplies, and similar costs were charged (i.e.,
debited) directly to vari-
ous expense accounts. The accounting for these types of costs in
a manufacturing envi-
ronment now gets a slight twist. In the preceding entries, we
credited an account titled
“Factory Overhead” for the allocated amount of overhead cost.
What is the nature of this
overhead account? It clearly is not Cash, Accounts Payable, or
some other familiar account
that would ordinarily be related to an expenditure. Instead, it is
a unique account that is
used to accumulate and allocate the actual overhead costs. The
credit you witnessed was
the allocation effect. The accumulation of the actual costs
results in a debit to Factory
Overhead as follows:
10-XX-X2 Factory Overhead 450
Salaries Payable 150
Supplies 75
Accumulated Depreciation 100
Utilities Payable 125
To record actual factory overhead costs
The previous credits are those customarily associated with
99. incurring salaries, using sup-
plies, recording depreciation, and utilizing utilities. However,
instead of debiting the cus-
tomary expense accounts, the costs are charged to Factory
Overhead. The net result of this
process is to debit Factory Overhead for the actual costs
incurred and credit Factory Over-
head as these costs are allocated to Work in Process (which
eventually gets transferred to
expense as Cost of Goods Sold as shown via the preceding
entries). You may be wonder-
ing what happens if the amount of overhead actually incurred
differs from the amount
allocated, and that question is answered in the following
discussion.
waL80281_04_c04_083-112.indd 6 9/25/12 1:03 PM
89
CHAPTER 4Section 4.1 Job Costing
Differences Between Actual and Applied Overhead
An actual company would, of course, have many jobs in
process, so the preceding journal
entries for only one job present a very simple picture of costs
flows within the organiza-
tion. Nevertheless, it is a realistic portrait. Notice that assigned
costs totaled $1,947 (pro-
ducing a $553 profit: $2,500 sales price 2 $1,947 of goods
sold), including allocated over-
head of $418. However, the actual overhead was $450. The fact
that actual overhead was
100. more than the amount assigned to production represents
underapplied overhead. This
is indicative of an unfavorable outcome. More was actually
spent than was anticipated
based on the application rate. This amount cannot be ignored.
Based on the previous
journal entries, the Factory Overhead account contains a net
debit of $32 ($450 in debits
and $418 in credits). Accountants dispose of this balance by one
of several processes. A
popular approach is to adjust cost of goods sold as follows:
10-31-X2 Cost of Goods Sold 32
Factory Overhead 32
To transfer underapplied overhead to cost of goods sold
This entry causes an increase in cost of goods sold for the
excess overhead spending.
Alternative methods for clearing the Factory Overhead account
are usually covered in
advanced accounting classes. What is most important for you to
note at this time is that
the Factory Overhead is indeed zeroed out. It is not a financial
statement account. Rather,
it is a temporary account for accumulating and transferring
overhead costs into produc-
tion. If applied overhead had exceeded the actual amount,
overhead would have been
overapplied. Overapplied overhead would be cleared in just the
opposite manner of that
illustrated for underapplied overhead.
Mandatory Reporting of Overhead
101. Although managerial accounting information is generally
viewed as for internal use only,
be mindful that many manufacturing companies do prepare
external financial statements.
Also, generally accepted accounting principles (GAAP) dictate
the form and content of
those reports. GAAP requires that underapplied overhead
relating to idle facilities, wasted
material, the allocation of fixed production overhead, and so
forth be charged to current
period income by means similar to those just illustrated.
Job Costing Is Not Only for Manufacturing
Most textbook illustrations tend to demonstrate job costing in
the context of a product-
manufacturing scenario. However, at least in the United States,
most employees now work
in the service sector. This includes the fields of accounting,
sales, law, food service, elec-
tronic information, and transportation. In addition, the not-for-
profit and governmental
sectors are significant components of the economy. Activities
relate to education, health
care, fire protection, law enforcement, transportation, human
services, and the like. The
idea of a “job” can easily be expanded from a tangible product
to a particular activity. In
health care, a job could be a surgical procedure. In accounting,
a job could be preparation
waL80281_04_c04_083-112.indd 7 9/25/12 1:03 PM
90
102. CHAPTER 4Section 4.2 Process Costing Environments
of a tax return. In education, a job could be a particular course.
Measuring the cost of
this output is equally important, and the job costing techniques
remain fully applicable.
For example, an architectural firm would likely track time
(direct labor) devoted to each
design. Direct materials can relate to printing of blueprints.
Overhead allocations can
become substantial, including the office costs, computers,
software, and so forth. Success-
ful management of a service-related entity requires careful
attention to costing informa-
tion. As you can imagine, it is easy to underestimate the full
cost of providing services
to customers; it is ultimately necessary to recover not only
direct labor but also the other
significant costs of operations.
4.2 Process Costing Environments
Sometimes job costing techniques simply do not apply.
Production may instead involve a continuous flow of raw
materials through production departments. The output is
not identifiable as discrete jobs. Rather, output consists of a
homogenous product. Paint,
petroleum distillates, paper products, steel, glass, and many
other products display such
attributes. It becomes virtually impossible to match direct labor
and direct material to a
particular gallon, pound, square foot, or other measure of final
output. Nevertheless, it is
vitally important for management to be able to assess the cost of
production. Companies
103. facing this challenge often turn to process costing. Process
costing allocates the total cost
of production across all units of output. This usually entails
accumulation of costs for
each stage (or department) of production and assigning those
costs to all output from
that stage.
Process costing has certain attributes in common with job
costing. Material, labor, and fac-
tory overhead are all still assigned to work in process, and they
are eventually transferred
on to finished goods and then to cost of goods sold. In this
respect, the journal entries are
quite like those applicable to job costing. The main difference
between job costing and
process costing is that process costing captures costs by process
or department rather
than by specific job. If you consider a candy factory, three
departments define the basic
processes: mixing ingredients, cutting the ingredients into bite-
sized pieces, and cooking.
A separate Work in Process account will likely be used for each
department.
The Work in Process account for the mixing department will
capture (i.e., be debited) the
aggregate amount of direct material, direct labor, and allocated
factory overhead incurred
during a period. The accounts utilized in this entry would
appear like the October 15
entry that was used for the job costing illustration. Assuming a
weighted-average cost
assumption (in contrast to FIFO or some other technique), the
total dollar amount accu-
mulated in this account would be divided by the total
104. production (this could be pounds or
some other measure) to find per-unit cost (e.g., dollars per
pound). The per-unit cost can
then be used to allocate cost between goods still in process and
those that were completed
and transferred to the cutting department. The journal entry to
reflect a transfer out of cost
from the mixing department to the cutting department would
appear as follows:
waL80281_04_c04_083-112.indd 8 9/25/12 1:03 PM
91
CHAPTER 4Section 4.2 Process Costing Environments
10-30-X2 Work in Process Inventory 2 Cutting 50,000
Work in Process Inv. 2 Mixing 50,000
To transfer cost assigned to completed pounds of mixed candy
to the cutting
department
The cutting department’s Work in Process account would
therefore include the direct
material, direct labor, and factory overhead generated directly
within that department
and also the carried forward cost from the preceding mixing
department. A similar pro-
cess would be used to transfer work completed by the cutting
department to the cooking
department. At the end of the production process, the Work in
Process account of the final
105. stage (cooking) would be cleared of the accumulated costs by a
transfer of those costs to
finished goods inventory. This entry would be just as the
October 24 entry for the job cost-
ing example. By carefully following this approach, the finished
goods inventory will have
completely captured the costs of production generated within
each department.
Cost of Production Report
When process costing methods are used, management of each
department will likely
receive a cost of production report for each period. This report
is very similar in
purpose to a job cost sheet. It details the amount of direct
material, direct labor, and
factory overhead incurred by the department (rather than by job
as with a job cost
sheet). It then shows how those costs were allocated to total
production and provides
supporting documentation for the journal entries that were used
to transfer costs to
successive departments.
To understand a cost of production report requires the
introduction of one new dimen-
sion, that of equivalent units. An equivalent unit is a physical
unit expressed in terms
of a finished unit. This is a relatively simple concept. As an
example, assume that
100 pounds of candy was 40% complete within a particular
department. This is assumed
to be equivalent to the production of 40 pounds (100 pounds 3
40% complete). Although
none of the 100 pounds is complete, we can abstractly say that
106. we produced the equiva-
lent of 40 pounds.
The concept of equivalent units is exceedingly important to
grasp. It is rare that a com-
pany will not have goods in production at the end of an
accounting period. Accounting
periods end on regular intervals, but there is no compelling
business reason to cease pro-
duction with the flip of a page on a calendar. Indeed, many
production processes are dif-
ficult to stop and restart effectively (e.g., heating a kiln). It is
better to keep the production
flow going. Thus, it is frequently necessary for managerial
accountants to estimate the
equivalent units under production. As you examine the example
cost of production report
that follows, you will see how this concept comes into play.
The following example shows a simplified cost of production
report for one department
for 1 month. As you inspect this report, take special note that
the ending work in process
was assumed to be 40% complete. This report shows that of the
total cost of $1,500,000,
$1,250,000 was transferred to the next department, and
$250,000 remained in work in pro-
cess at the end of the month.
waL80281_04_c04_083-112.indd 9 9/25/12 1:03 PM
92
CHAPTER 4Section 4.2 Process Costing Environments
107. SWEET CANDY COMPANY
Cost of Production Report for Mixing Department
for the Month of October 20XX
Total
Pounds
Percent
Complete
Equivalent
Units
Transferred to Cutting Department 500,000 100% 500,000
In production at end of month 250,000 40% 100,000
Total equivalent units for the
month
600,000
Cost
Calculations
Cost of beginning inventory $ 400,000
Additional costs during the month 1,100,000
Total costs to account for $1,500,000
Equivalent units from above ÷ 600,000
Per unit cost $ 2.50
108. Equivalent
Units
Per Unit
Cost
Cost
Assignment
Total pounds transferred to Cutting
Department
500,000 $2.50 $1,250,000
Equivalent units in ending work in
process
100,000 $2.50 250,000
600,000 $1,500,000
The preceding cost of production report was simplified by an
assumption that materials,
labor, and overhead were all introduced into production
uniformly. If you study more
advanced cost accounting courses, you will learn how to
account for scenarios where that
assumption is violated. Essentially, it becomes necessary to
separate the cost of materials,
labor, and overhead so that you derive separate costs per
equivalent for each component.
waL80281_04_c04_083-112.indd 10 9/25/12 1:03 PM
109. 93
CHAPTER 4Section 4.2 Process Costing Environments
Case Study in Process Costing
To further illustrate process costing, let’s focus on a
comprehensive case study. Yum Gum
produces chewing gum in a three-step process consisting of (a)
blending ingredients,
(b) cooking, and (c) cutting and packing. Each process involves
a uniform incurrence and
introduction of materials, labor, and overhead. Following are
cost of production reports
for each of the three departments for August. The amounts are
all assumed, but do take
note of how costs transferred out of one department are received
into the next department.
YUM GUM
Cost of Production Report for Blending Department
for the Month of August
Total
Pounds
Percent
Complete
Equivalent
Units
Transferred to Cooking
Department
110. 300,000 100% 300,000
In production at end of month 100,000 25% 25,000
Total equivalent units for the
month
325,000
Cost
Calculations
Cost of beginning inventory $ 80,000
Additional costs during the month 570,000
Total costs to account for $650,000
Equivalent units from above ÷ 325,000
Per unit cost $2.00
Equivalent
Units
Per Unit
Cost
Cost
Assignment
Total pounds transferred to Cooking
Department
300,000 $ 2.00 $600,000
111. Equivalent units in ending work in
process
25,000 $ 2.00 50,000
325,000 $ 650,000
waL80281_04_c04_083-112.indd 11 9/25/12 1:03 PM
94
CHAPTER 4Section 4.2 Process Costing Environments
YUM GUM
Cost of Production Report for Cooking Department
for the Month of August
Total
Pounds
Percent
Complete
Equivalent
Units
Transferred to Cutting Department 250,000 100% 250,000
In production at end of month 60,000 30% 18,000
Total equivalent units for the
month
112. 268,000
Cost
Calculations
Cost of beginning inventory $ 35,000
Costs transferred in from Blending
Department
600,000
Additional costs during the month 236,000
Total costs to account for $ 871,000
Equivalent units from above ÷ 268,000
Per unit cost $ 3.25
Equivalent
Units
Per Unit
Cost
Cost
Assignment
Total pounds transferred to Cutting
Department
250,000 $3.25 $812,500
Equivalent units in ending work in
113. process
18,000 $3.25 58,500
268,000 $871,000
waL80281_04_c04_083-112.indd 12 9/25/12 1:03 PM
95
CHAPTER 4Section 4.2 Process Costing Environments
YUM GUM
Cost of Production Report for Cutting Department
for the Month of August
Total
Pounds
Percent
Complete
Equivalent
Units
Transferred to Finished Goods 275,000 100% 275,000
In production at end of month 40,000 60% 24,000
Total equivalent units for the
month
299,000
114. Cost
Calculations
Cost of beginning inventory $ 260,000
Additional costs during the month 123,500
Costs transferred in from Cooking
Department
812,500
Total costs to account for $1,196,000
Equivalent units from above ÷ 299,000
Per unit cost $ 4.00
Equivalent
Units
Per Unit
Cost
Cost
Assignment
Total pounds transferred to
Finished Goods
275,000 $4.00 $1,100,000
Equivalent units in ending work in
process
115. 24,000 $4.00 96,000
299,000 $1,196,000
The cost of production report for each department triggers
information necessary to sup-
port the following journal entries. Be sure to observe the unique
entries where costs are
handed off from one department to the next.
waL80281_04_c04_083-112.indd 13 9/25/12 1:03 PM
96
CHAPTER 4Section 4.2 Process Costing Environments
Journal entries related to blending:
8-31-XX Work in Process Inventory 2 Blending 570,000
Raw Materials Inventory 190,000
Salaries Payable 190,000
Factory Overhead 190,000
To transfer raw materials to production, record direct labor
costs for blending, and
apply overhead at the predetermined rate
8-31-XX Work in Process Inventory 2 Cooking 600,000
Work in Process Inventory 2 Blending 600,000
116. To transfer cost assigned to completed pounds of blended gum
to cooking department
Journal entries related to cooking:
8-31-XX Work in Process Inventory 2 Cooking 236,000
Raw Materials Inventory 78,667
Salaries Payable 78,667
Factory Overhead 78,666
To transfer raw materials to production, record direct labor
costs for cooking, and
apply overhead at the predetermined rate
8-31-XX Work in Process Inventory 2 Cutting 812,500
Work in Process Inventory 2 Cooking 812,500
To transfer cost assigned to completed pounds of cooked gum to
cutting department
Journal entries related to cutting:
8-31-XX Work in Process Inventory 2 Cutting 123,500
Raw Materials Inventory 41,167
Salaries Payable 41,167
Factory Overhead 41,166
To transfer raw materials to production, record direct labor
costs for cutting, and apply
117. overhead at the predetermined rate
8-31-XX Finished Goods Inventory 1,100,000
Work in Process Inventory 2 Cutting 1,100,000
To transfer cost assigned to completed pounds of cut gum to
finished goods
waL80281_04_c04_083-112.indd 14 9/25/12 1:03 PM
97
CHAPTER 4Section 4.3 Activity-Based Costing
This comprehensive example shows how costs are monitored,
accumulated, and assigned
to finished goods. Bear in mind that the comingling of
ingredients and involvement of
numerous steps makes it exceedingly difficult to have an
intuitive awareness of costs for
goods that are produced via continuous processes. Process
costing is essential for con-
trolling costs and setting pricing in such environments.
4.3 Activity-Based Costing
Both job costing and process costing methods divide costs
between product and period costs. As you know, period costs
are charged against income as they occur, and they
generally relate to selling, general, and administrative (SG&A)
activities. In contrast,
direct materials, direct labor, and factory overhead are assigned
to inventory. One concep-
118. tual shortcoming is that it becomes difficult to fully
contemplate the true cost of a finished
product. Arguably, the cost of producing a product should
sometimes take into account
a portion of the organization’s SG&A. For instance, buying raw
materials is an adminis-
trative task: Why is the cost of this activity not assigned to
inventory? Conversely, lawn
maintenance for a factory is usually part of factory overhead:
Why does the cost of that
activity become assigned to inventory when the cost will be
incurred no matter how many
units are produced?
Activity-based costing (ABC) attempts to overcome deficiencies
such as those cited in
the preceding paragraph. ABC requires a new mind-set as
compared to traditional cost-
ing methods. Some companies have embraced ABC, and others
see it as too radical of a
departure from traditional costing methods. Indeed, ABC is not
acceptable for external
reporting under GAAP. Thus, companies that implement aspects
of ABC typically do so
to supplement traditional costing information. ABC is normally
for internal use only and
is intended to facilitate internal decision-making processes by
pinpointing actual (full)
production costs more precisely.
ABC requires one to abandon attempts to distinguish product
and period costs. Instead,
ABC is a costing model that divides production into core cost
objects and activities, defines
the costs for each, and then allocates activity costs to cost
objects based on how much of a
119. particular activity is consumed by the cost object. This results
in products absorbing costs
of manufacturing and nonmanufacturing activities alike.
Conversely, some manufactur-
ing costs may not attach to any products. The driving principle
of ABC is that a product’s
cost is based only on the cost of capacity utilized in producing
the product. Unused capac-
ity is not assessed or allocated to production.
Remember that traditional costing approaches usually allocate
all manufacturing costs
(via the overhead application rate), whether related to excess
capacity or not, to the inven-
tory actually produced. This has the potential to distort the
measured cost of production,
thereby limiting a manager’s ability to make decisions about
pricing and production. As
you might suspect, important business decisions are based on
assessment of product prof-
itability. To the extent a product’s sales price is set by market
conditions, and profit is seen
as the sales price minus product cost, the determination of a
product’s cost becomes criti-
cal in deciding on its fate.
waL80281_04_c04_083-112.indd 15 9/25/12 1:03 PM
98
CHAPTER 4Section 4.3 Activity-Based Costing
ABC Modeling
120. If you think about traditional costing, you will quickly conclude
that the cost object is
normally a product or service. With ABC, the concept of a cost
object is far more expan-
sive. Cost objects expand to also include customers, markets,
and similarly identifiable
items or events that require activity to support. For example, a
customer may receive a
quarterly visit from a sales representative, no matter the level of
purchasing activity. The
customer would be a cost object, and activities to support the
customer might include
an airline ticket, hotel bill, and so forth. These activities have a
clear cost that is traceable
to the customer (i.e., the cost object) rather than the products
produced/sold or period
incurred. A business is apt to have many cost objects and
hundreds of activities in sup-
port thereof. Therefore, the first step in ABC implementation
entails a detailed study of
processes and costs. This study is usually supported by
flowcharts and diagrams, and
it may resemble something that looks more like it was
developed by an engineer than a
managerial accountant.
In linking activities to cost objects, it is important to consider
that activities occur at many
levels. Some activities occur at the unit level. There is a one-to-
one correspondence with a
unit of output. Final inspection of each car for an automobile
manufacturer is an example.
Other activities occur at a batch level. Global shipping of
containers is an example; the
same amount of effort must be expended to clear customs,
regardless of the quantity of
121. individual products within a container. Thus, shipping a
container would be a batch-level
activity. Other activities occur at much higher levels. Product-
level activities include
designing a new product. Customer-level activities include
developing catalogs and
sales calls; in other words, the amount of activity is dependent
on the number of custom-
ers. Some businesses even identify market-level activities (Asia,
Europe, North America,
etc.). At the highest level are entity-sustaining activities, such
as the cost of a corporate
audit. The identification of activities is unique to each
company, and considerable study
and thought is needed to properly map a company’s activities.
Once all activities and cost objects have been identified, it next
becomes necessary to
study how the organization’s costs align with activities and
objects. Basically, each
cost is identified as one of three types. First, some costs are
directly traceable to a specific
cost object. Direct material is a clear example of a cost that is
attributable to the “product”
cost object. You are quite familiar with this concept because
this piece is the same under
traditional costing and ABC. Moving to a less familiar concept,
the cost of printing a cata-
log would be traced to a “customer” cost object. Once all costs
that can be directly traced
are determined, the second step is to attempt to allocate
remaining costs to specific activi-
ties. For some costs, this is very logical. The cost of a new
product design team would be
allocated to the product-level design activity. At other times,
considerable judgment must
122. be applied to make the allocation. Consider the light bill for the
office space; perhaps 10%
of this amount is for electricity usage within the design
department’s space. You can see
that ABC quickly entails a degree of complexity. Finally, some
costs do not seem to match
with any cost object or activity. This third grouping of costs is
not assigned to any activity
or cost object. The fact that a cost is not assigned to a cost
object or activity does not mean
that it is to be ignored; it is expensed but should be closely
monitored by management.
The final step in ABC requires that the cost of activities be
allocated to cost objects. For
example, the accumulated cost of the design activity must
finally be allocated to cost
objects. If three new products were developed, it might be
appropriate that the design
activity’s total cost be shared one-third by each new product.
waL80281_04_c04_083-112.indd 16 9/25/12 1:03 PM
99
CHAPTER 4Section 4.3 Activity-Based Costing
Exhibit 4.2 is an attempt to recap the overall design of an ABC
system:
Exhibit 4.2
ABC Example
123. Because of its complexity, it is easy to quickly lose sight of the
purpose of ABC. ABC is
intended to improve measures of cost. By introducing activity
cost pools as an interme-
diate step for selected costs (rather than allocating every cost
directly to a product or
period), we are much better able to allocate the costs to end
objects (products, customers,
etc.). Without activity cost pools, it becomes difficult to
connect each cost with final cost
objects. A simplified example should prove quite helpful in
clarifying how ABC works.
Hong sells three products. Each product generates exactly
$1,750,000 in total sales. Two
products (A and B) are manufactured internally, and one (C) is
outsourced. A and C are sold
via direct sales efforts, and B is sold only via a website. For
simplicity, assume Hong has
only four identifiable activities: manufacturing, direct sales,
administration, and web sup-
port. The cost of manufacturing ($1,000,000, excluding direct
materials and direct labor) is
allocated 50% to A and 50% to B. The study of the cost of
direct sales ($800,000) revealed
that it is attributable 70% to A and 30% to C. Administrative
activities ($1,200,000) are
found to be consumed 20% by A, 30% by B, and 50% by C.
Finally, web support ($100,000)
is 100% attributable to B. Let’s assume that there are no costs
that cannot be traced to a
particular cost object or activity.
ASSIGN COSTS TO
ACTIVITIES WHEN NOT
TRACEABLE TO COST
124. OBJECT
ADOPT ALLOCATION
SCHEME TO TRANSFER
ACTIVITY COSTS TO
COST OBJECTS
CHARGED TO EXPENSE
BUT MONITORED
CLOSELY AS PART OF
OVERALL FINANCIAL
MANAGEMENT
FINAL COST
DETERMINATION FOR
COST OBJECTS
DETERMINE
COSTS
STUDY COSTS AND
PROCESSES
TRACE COSTS TO COST
OBJECTS WHEN POSSIBLE
COSTS THAT ARE NOT
TRACEABLE OR ASSIGNABLE
waL80281_04_c04_083-112.indd 17 9/25/12 1:03 PM
125. 100
CHAPTER 4Section 4.3 Activity-Based Costing
Table 4.1 reveals the ABC approach to assessing costs for each
final product.
Table 4.1: The ABC approach to assessing costs
Product A Product B Product C
Direct materials and labor (traceable) $500,000 $750,000
Purchase of outsourced product (traceable) $900,000
Manufacturing activity (allocated activity) 500,000 500,000
Direct sales (allocated activity) 560,000 240,000
Administration (allocated activity) 240,000 360,000 600,000
Web support (allocated activity) - 100,000
-
Total cost assignment $1,800,000 $1,710,000 $1,740,000
The costs in the preceding table were either directly traceable to
cost object A, B, and C
or allocated based on the given percentages. The resulting total
cost assignment shows
that only products B and C are profitable (remember that each
product had total sales of
$1,750,000). A traditional costing model would not pinpoint
these facts nearly so precisely.