CHAPTER 3 NationalIncome
CHAPTER 1 The Science of Macroeconomics
CHAPTER 2 The Data of Macroeconomics
IN THIS CHAPTER, YOU WILL LEARN:
. . . the meaning and
measurement of the
most important
macroeconomic statistics:
• gross domestic product
(GDP)
• the consumer price index
(CPI)
• the unemployment rate
3.
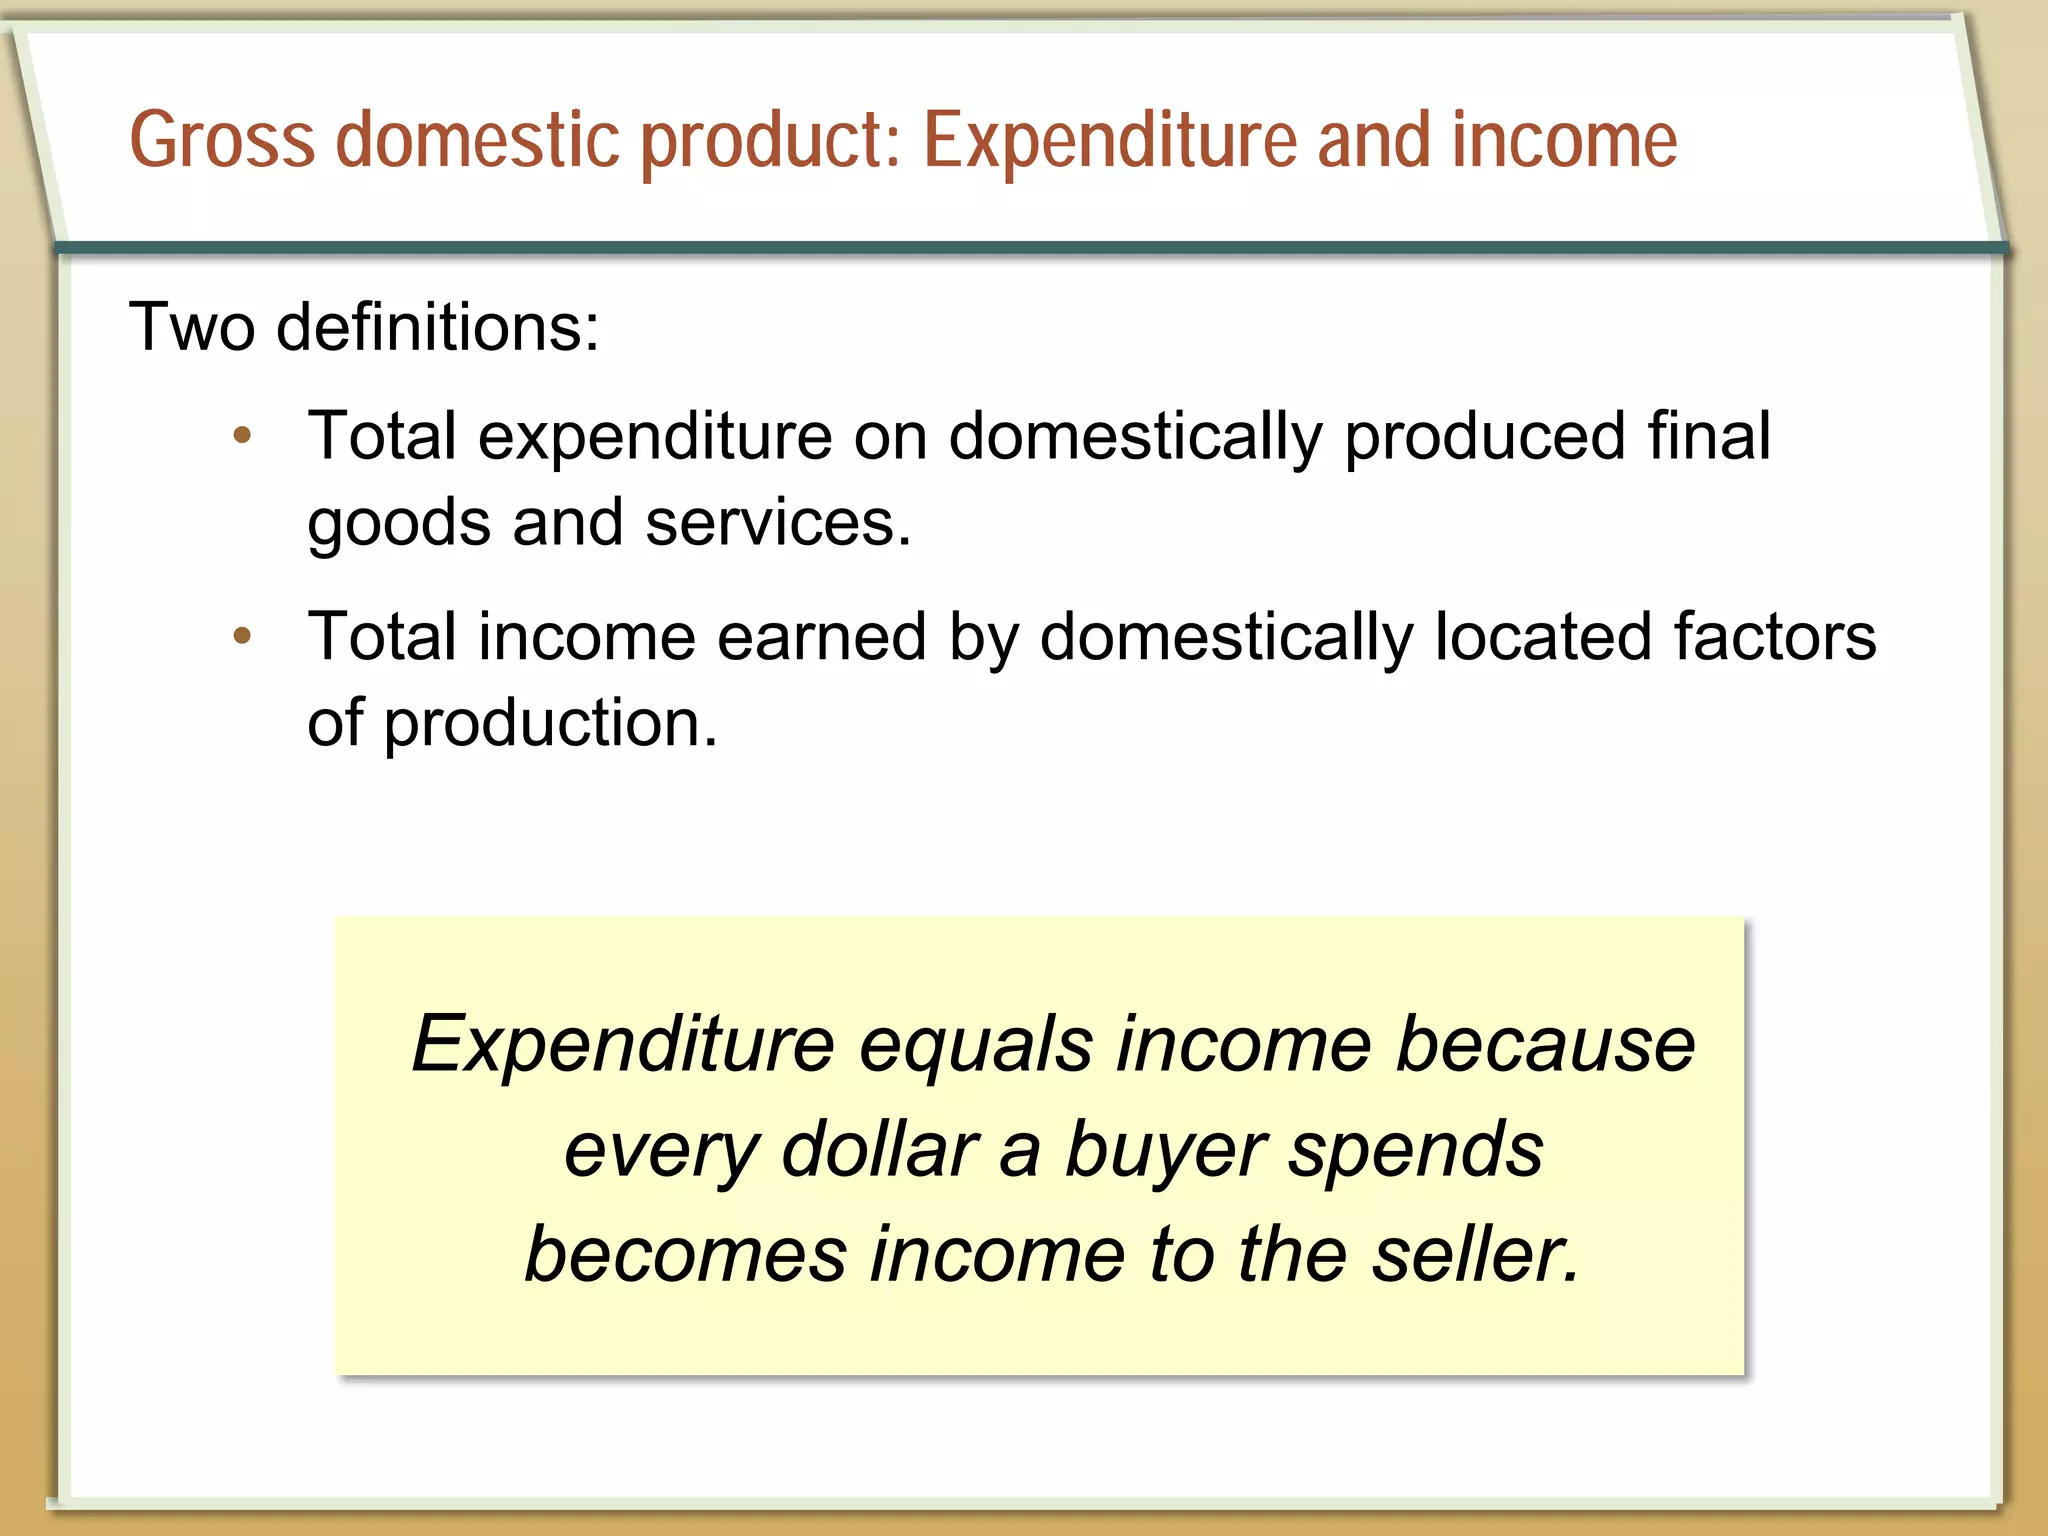
Gross domestic product:Expenditure and income
Two definitions:
• Total expenditure on domestically produced final
goods and services.
• Total income earned by domestically located factors
of production.
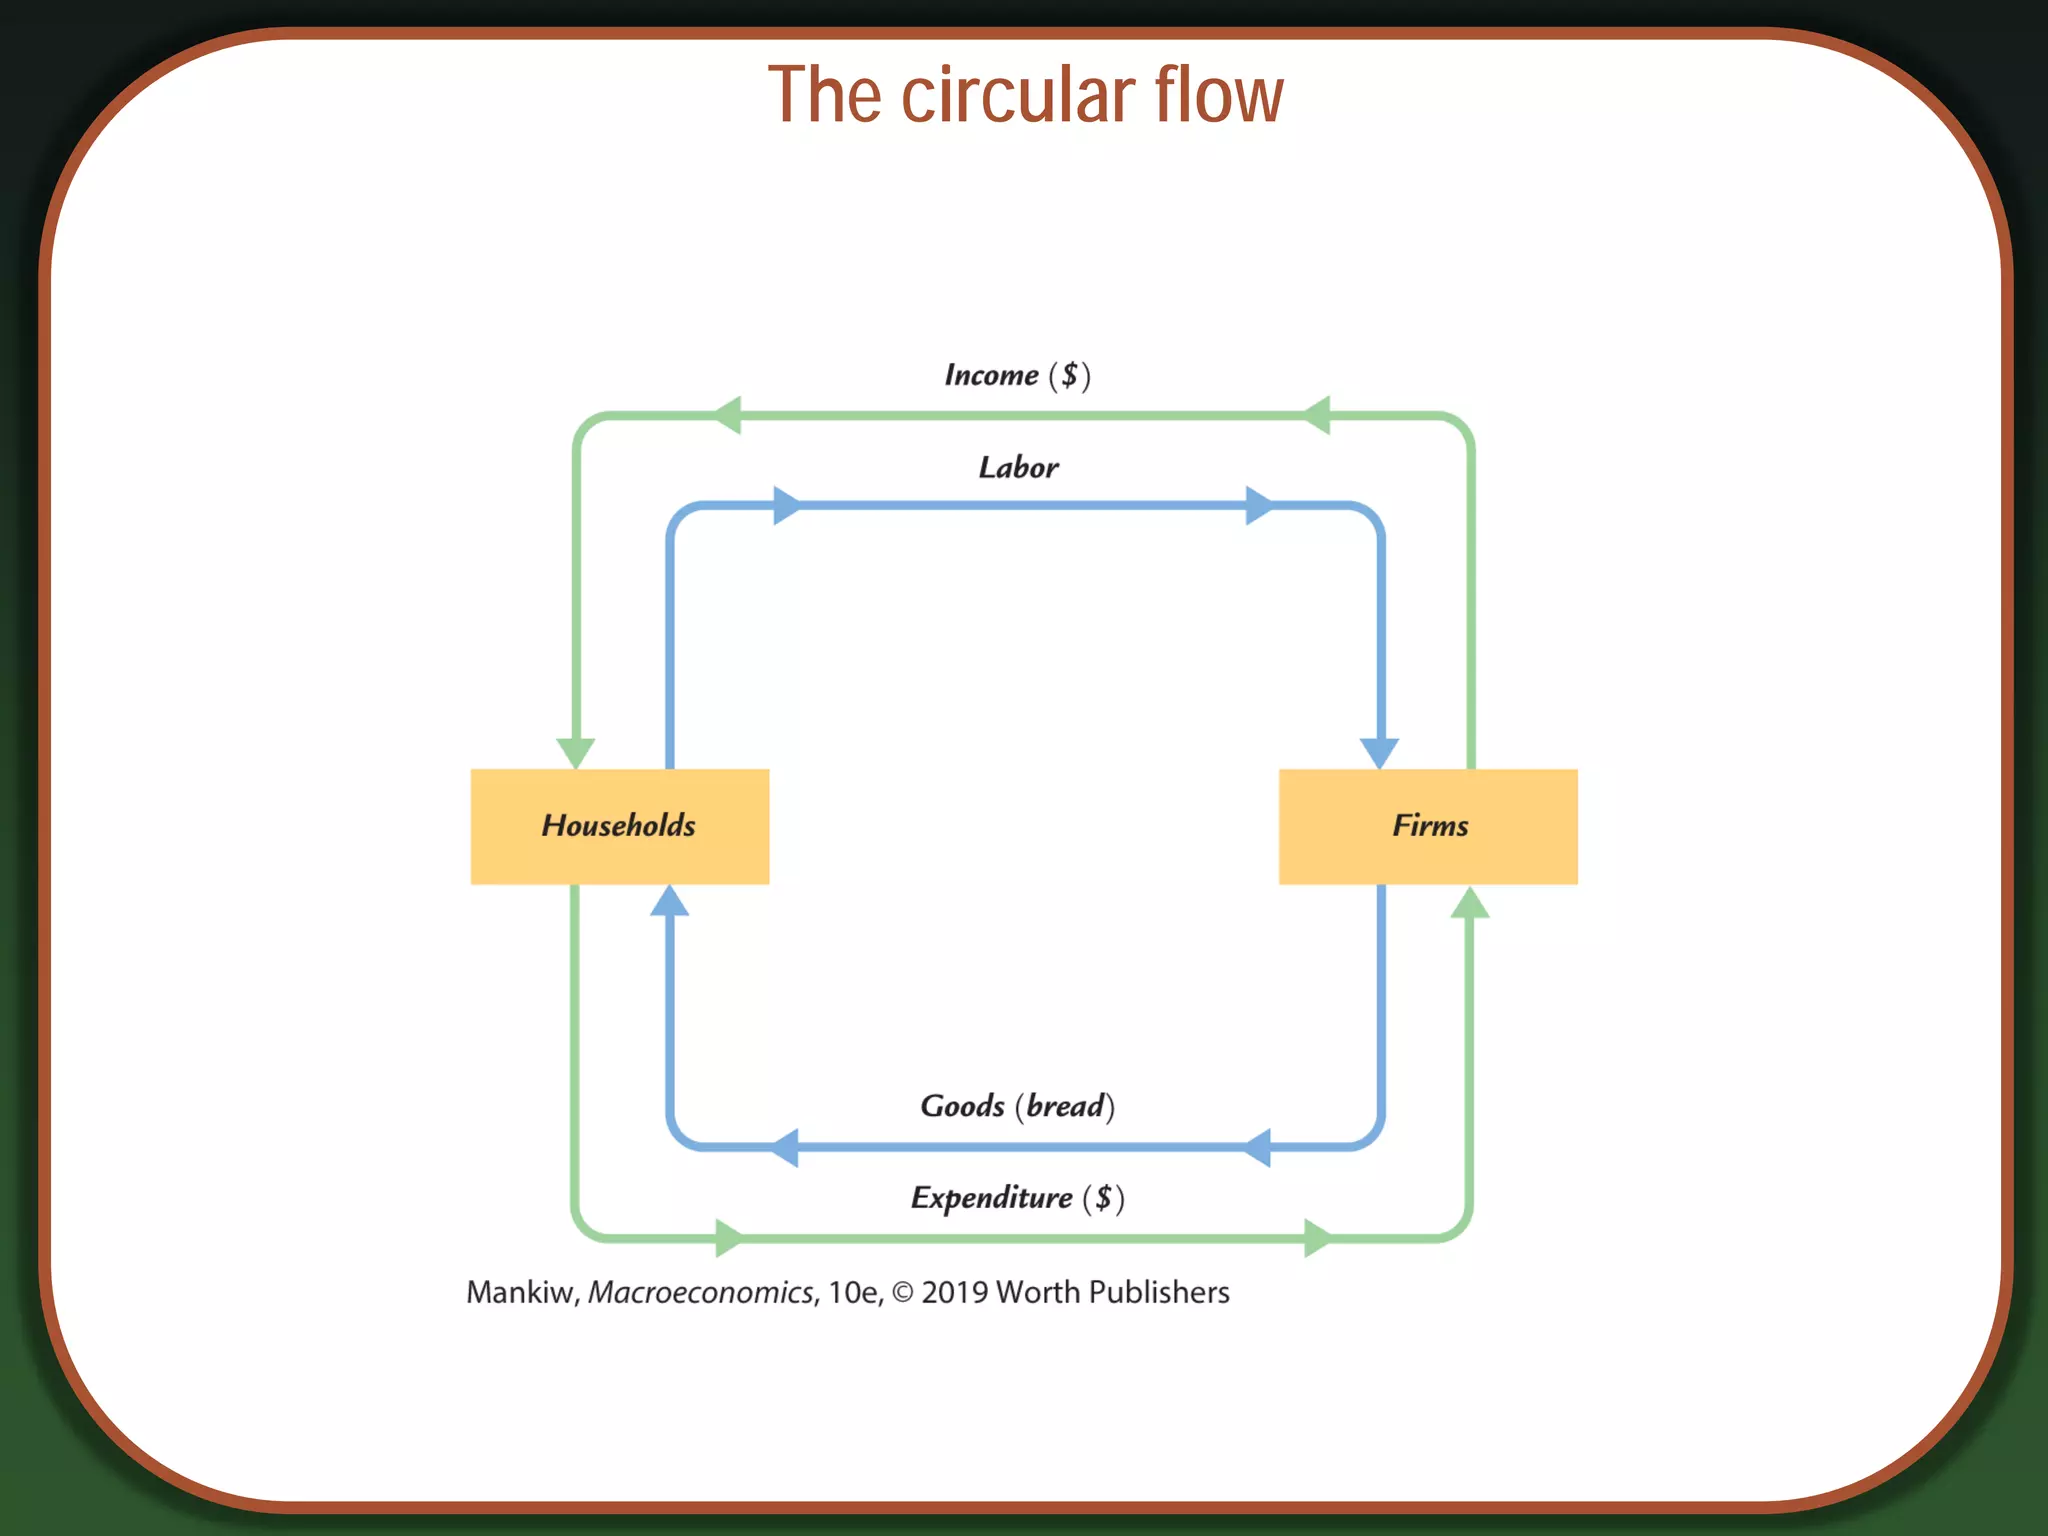
Expenditure equals income because
every dollar a buyer spends
becomes income to the seller.
Value added
Value addedis the value of output minus the value of the
intermediate goods used to produce that output
6.
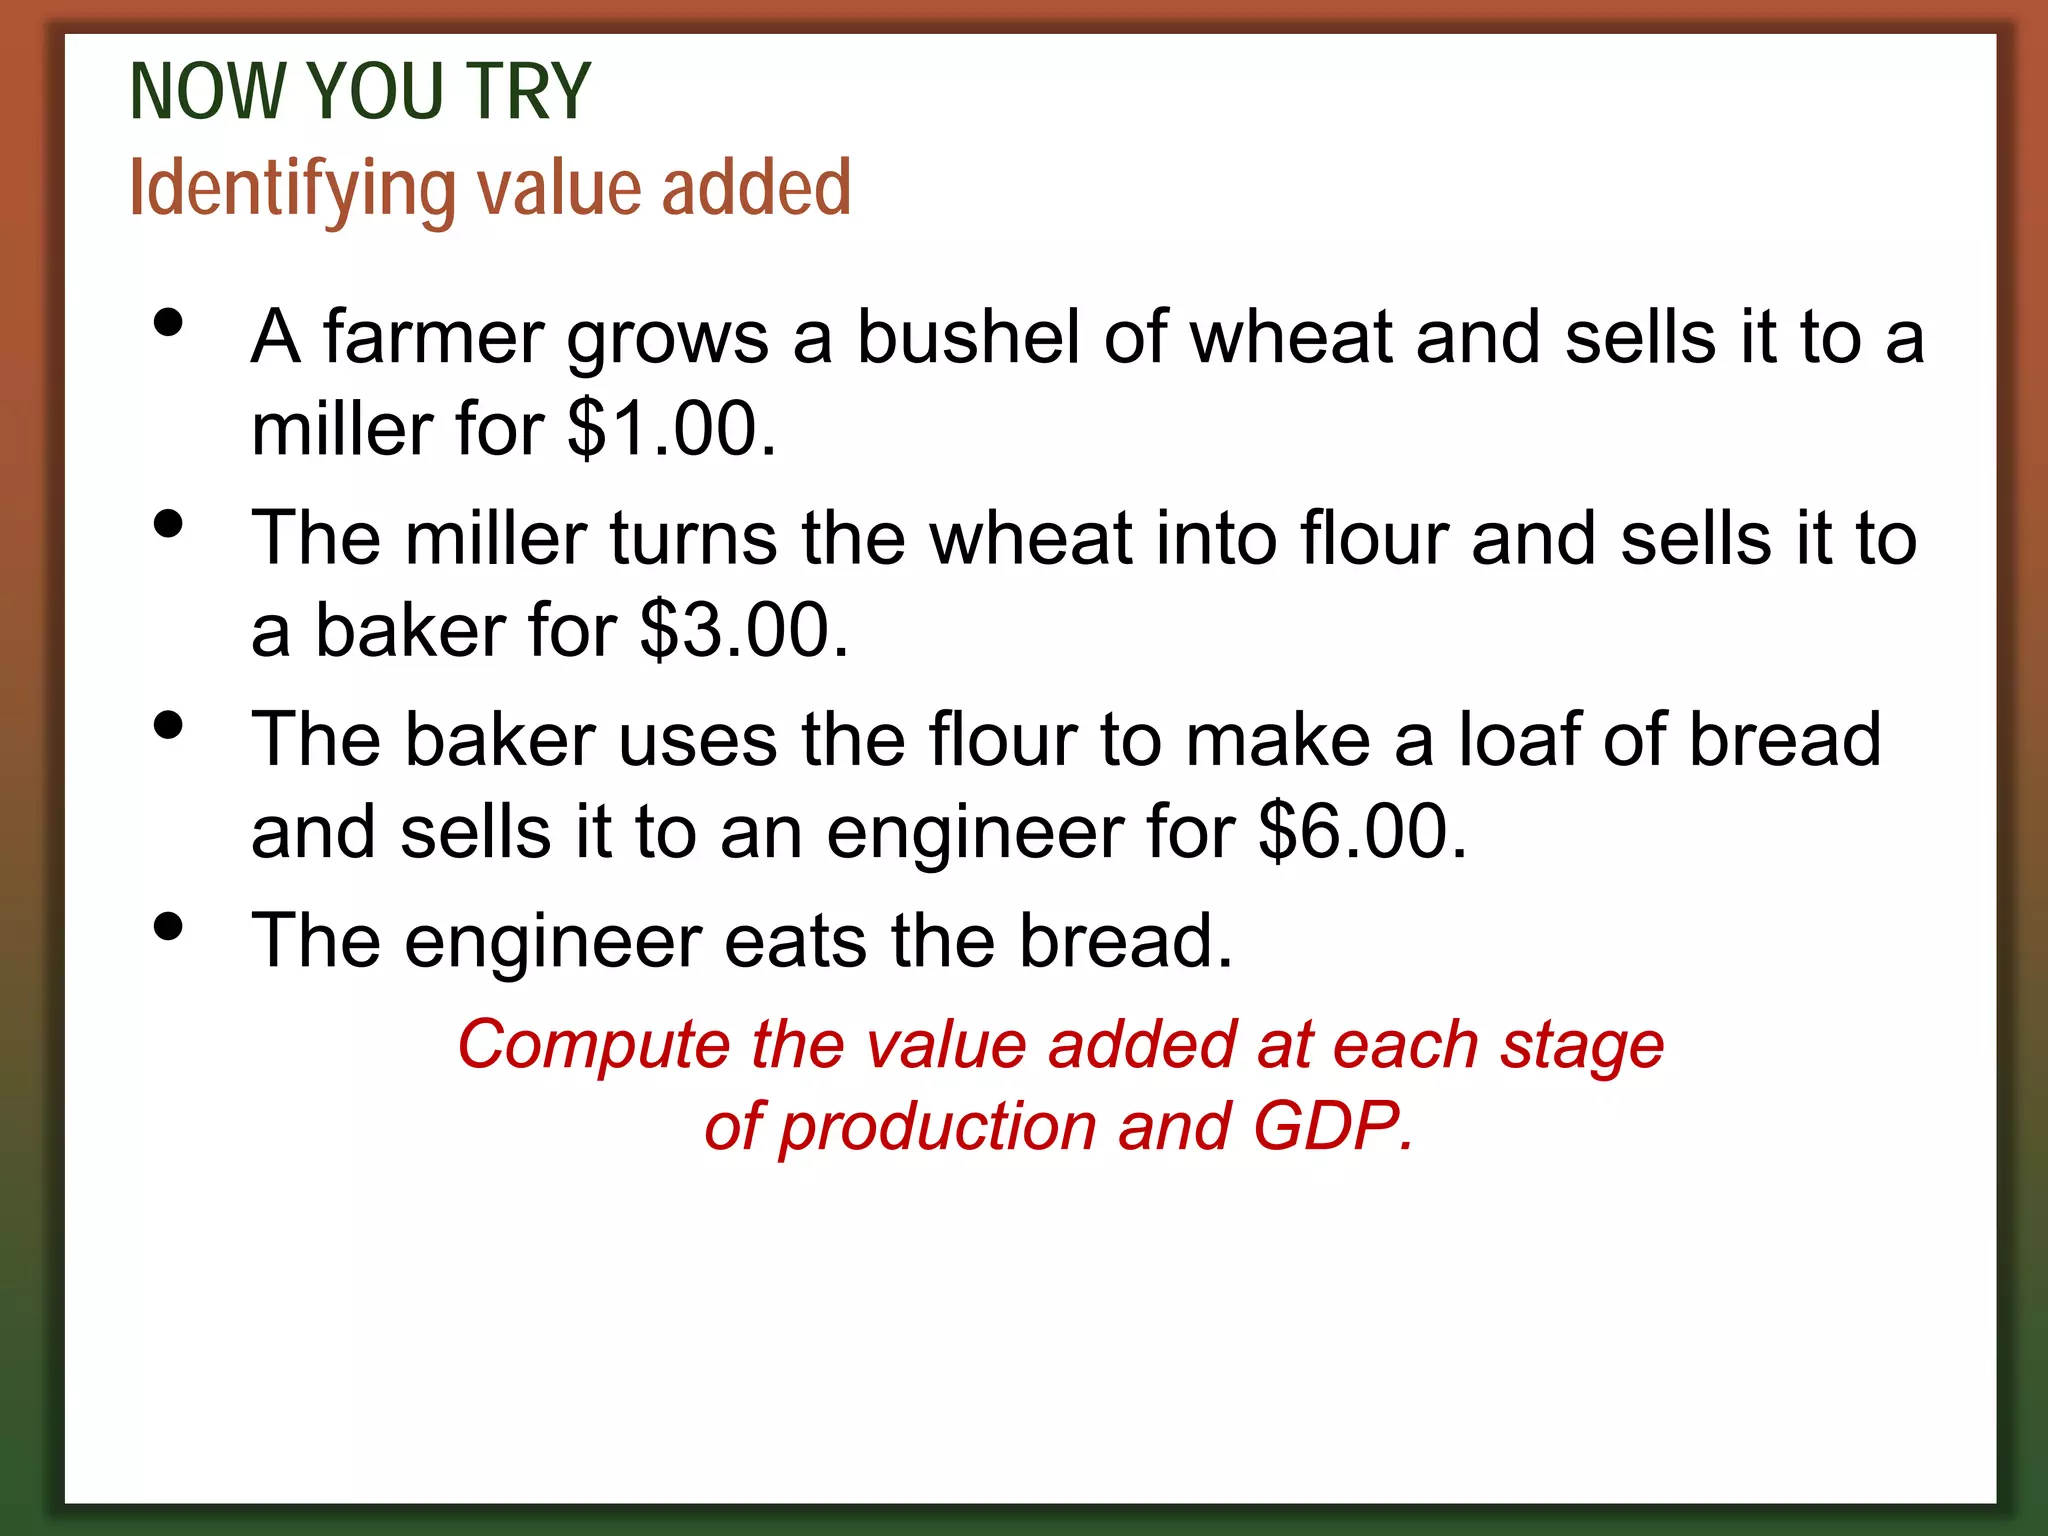
NOW YOU TRY
Identifyingvalue added
• A farmer grows a bushel of wheat and sells it to a
miller for $1.00.
• The miller turns the wheat into flour and sells it to
a baker for $3.00.
• The baker uses the flour to make a loaf of bread
and sells it to an engineer for $6.00.
• The engineer eats the bread.
Compute the value added at each stage
of production and GDP.
7.
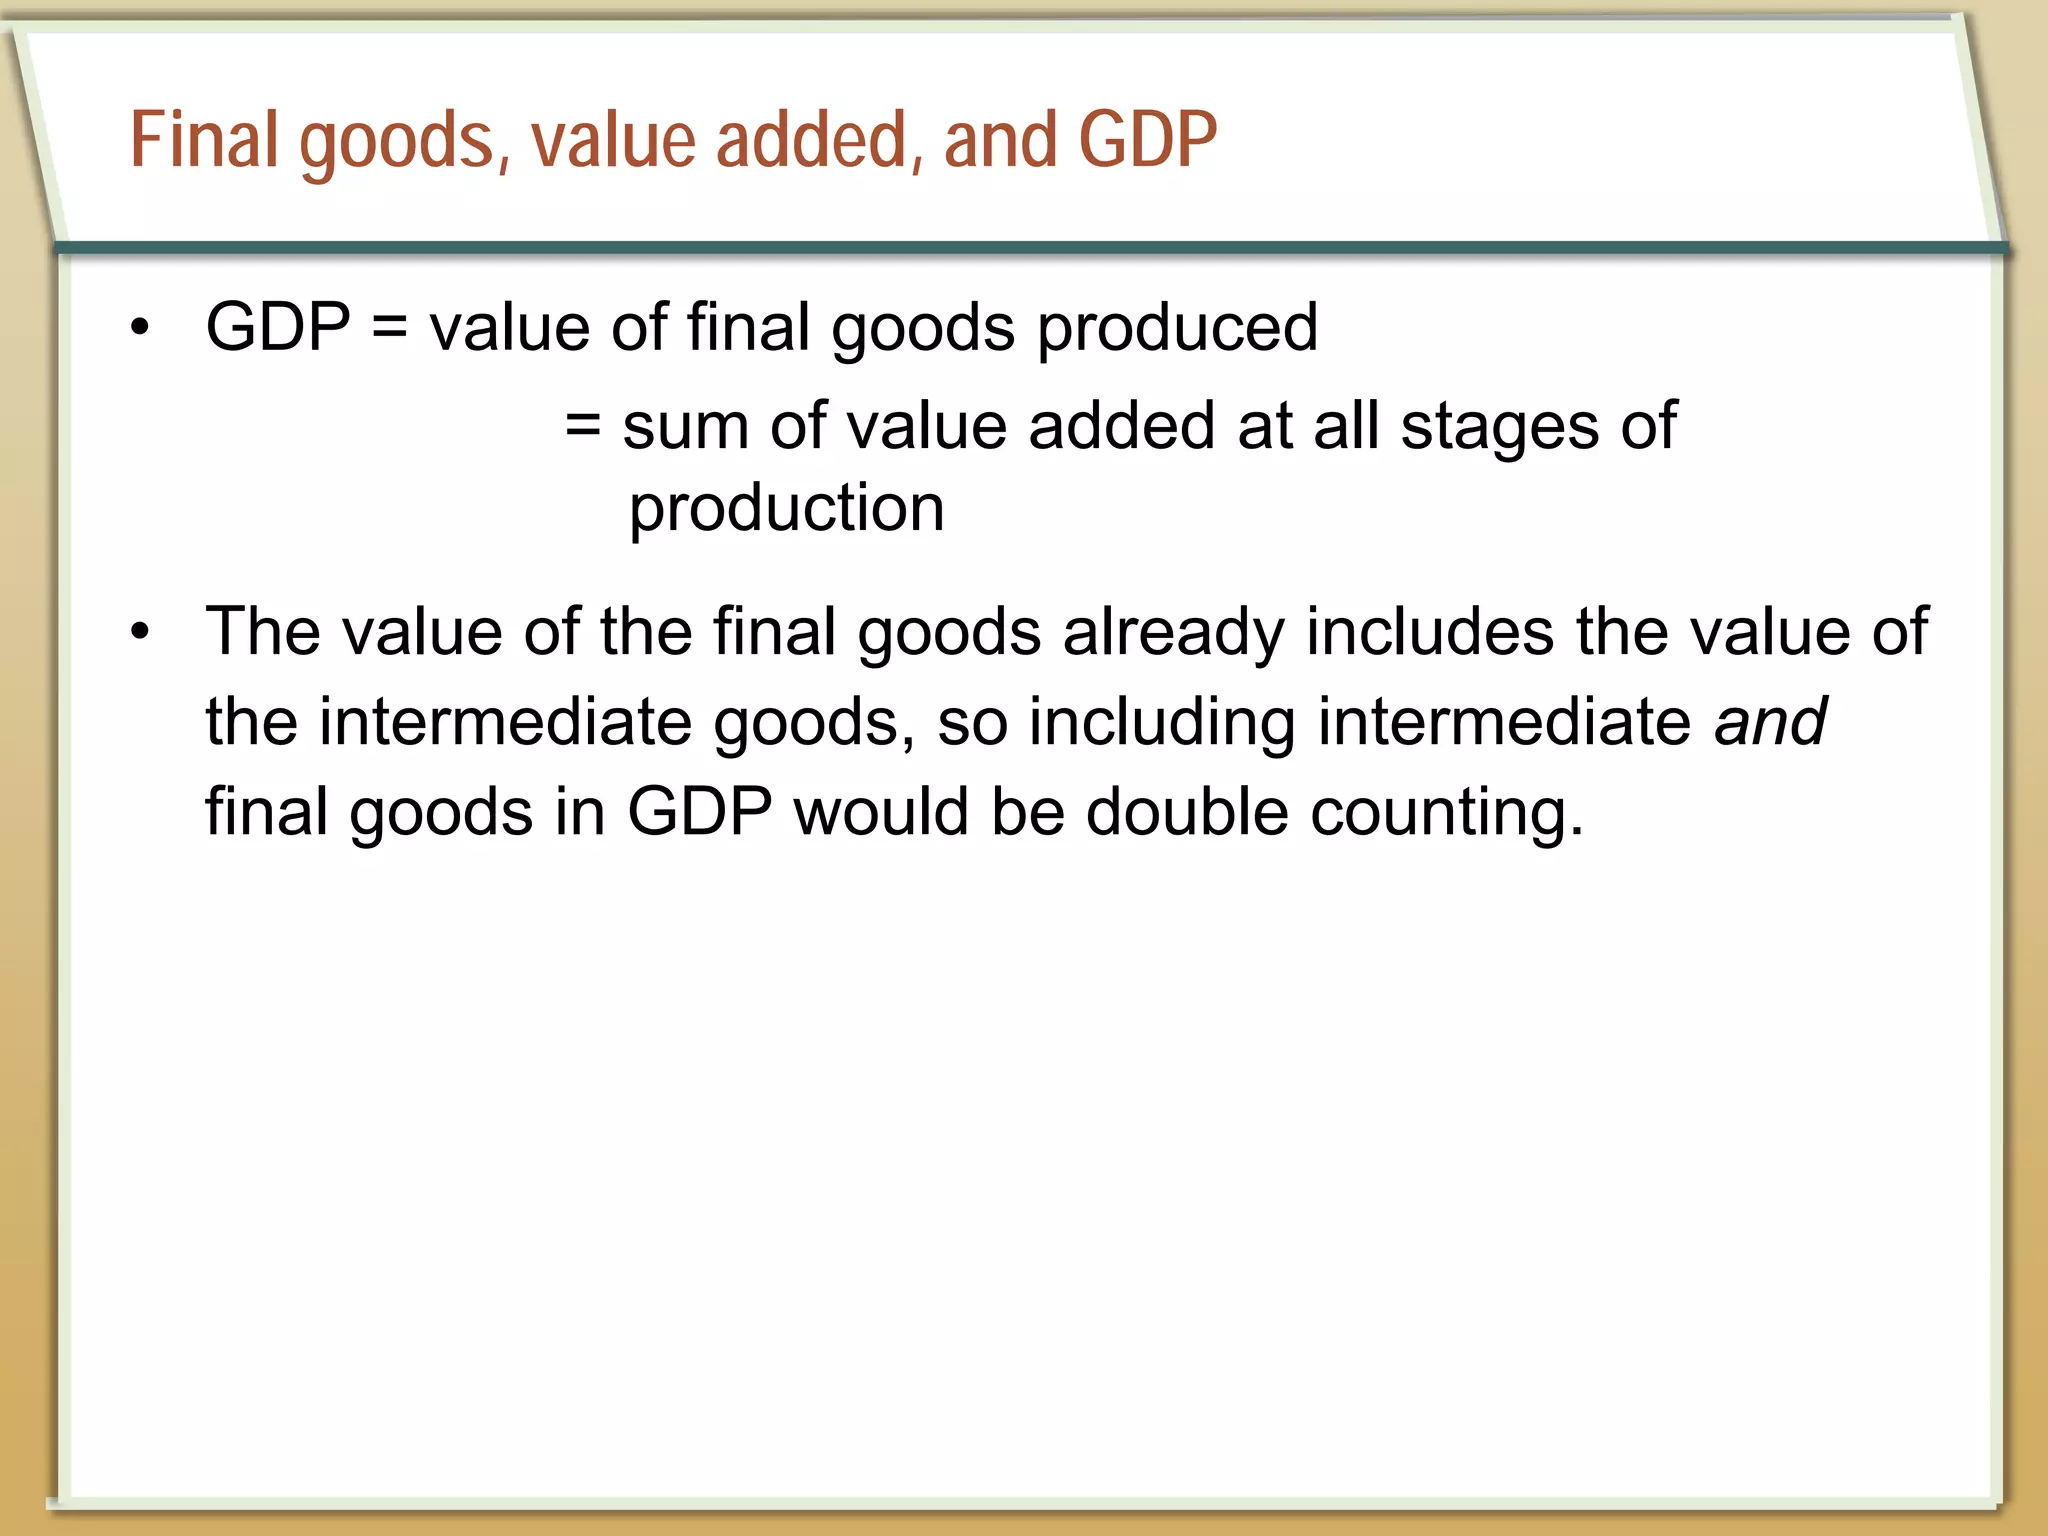
Final goods, valueadded, and GDP
• GDP = value of final goods produced
= sum of value added at all stages of
production
• The value of the final goods already includes the value of
the intermediate goods, so including intermediate and
final goods in GDP would be double counting.
8.
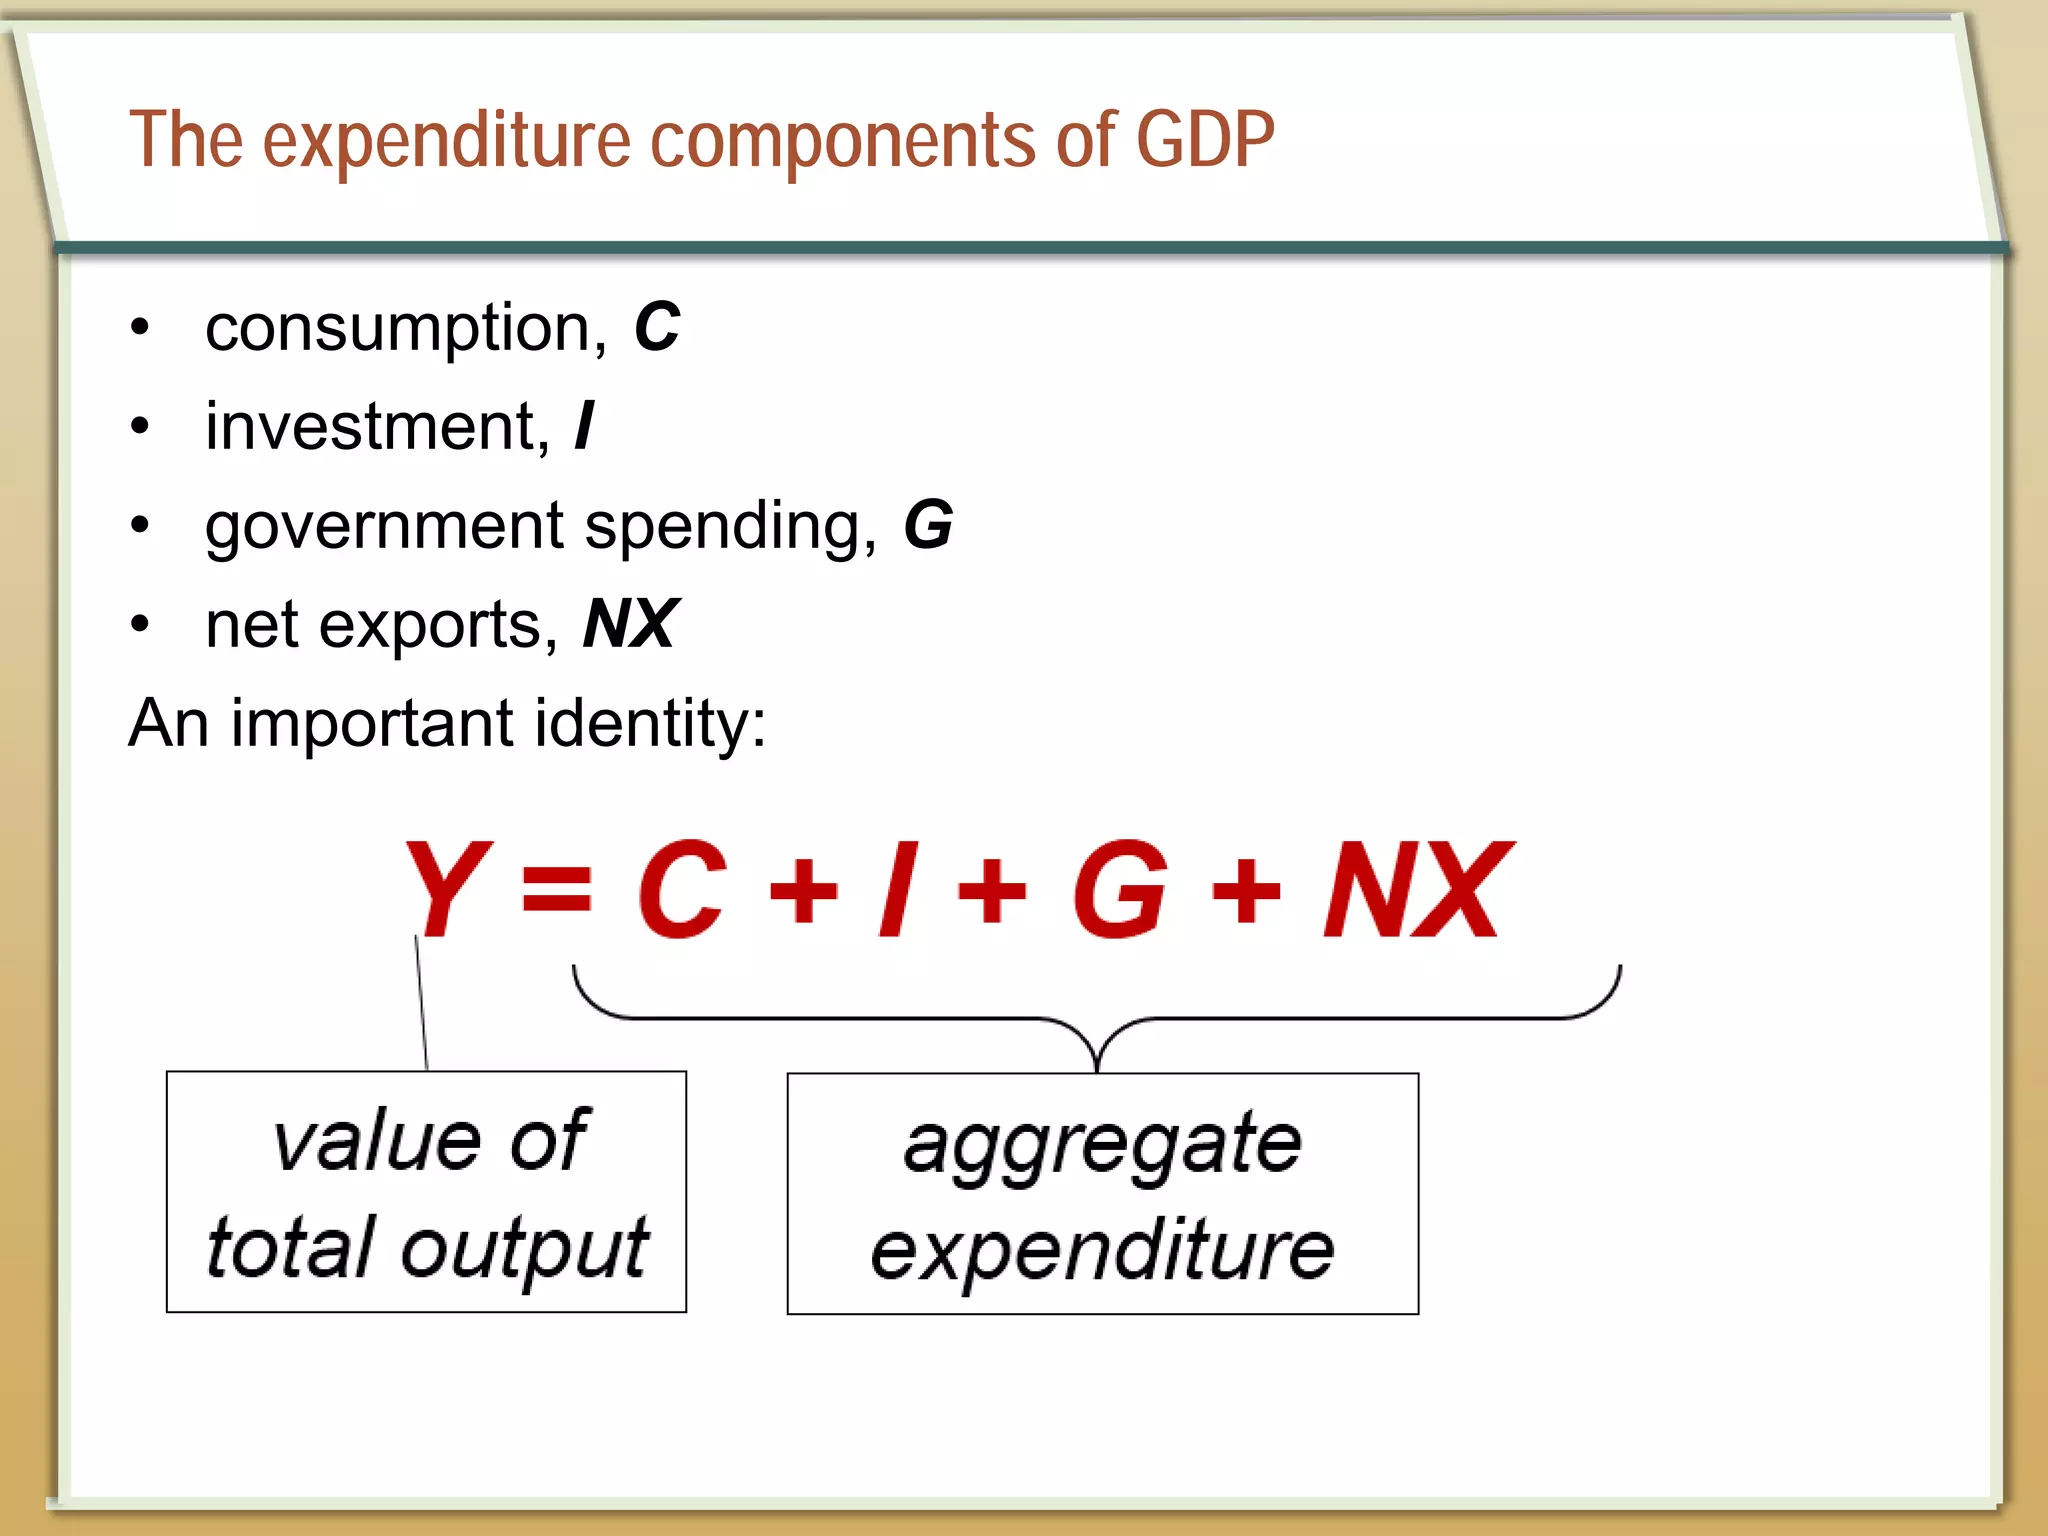
The expenditure componentsof GDP
• consumption, C
• investment, I
• government spending, G
• net exports, NX
An important identity:
9.
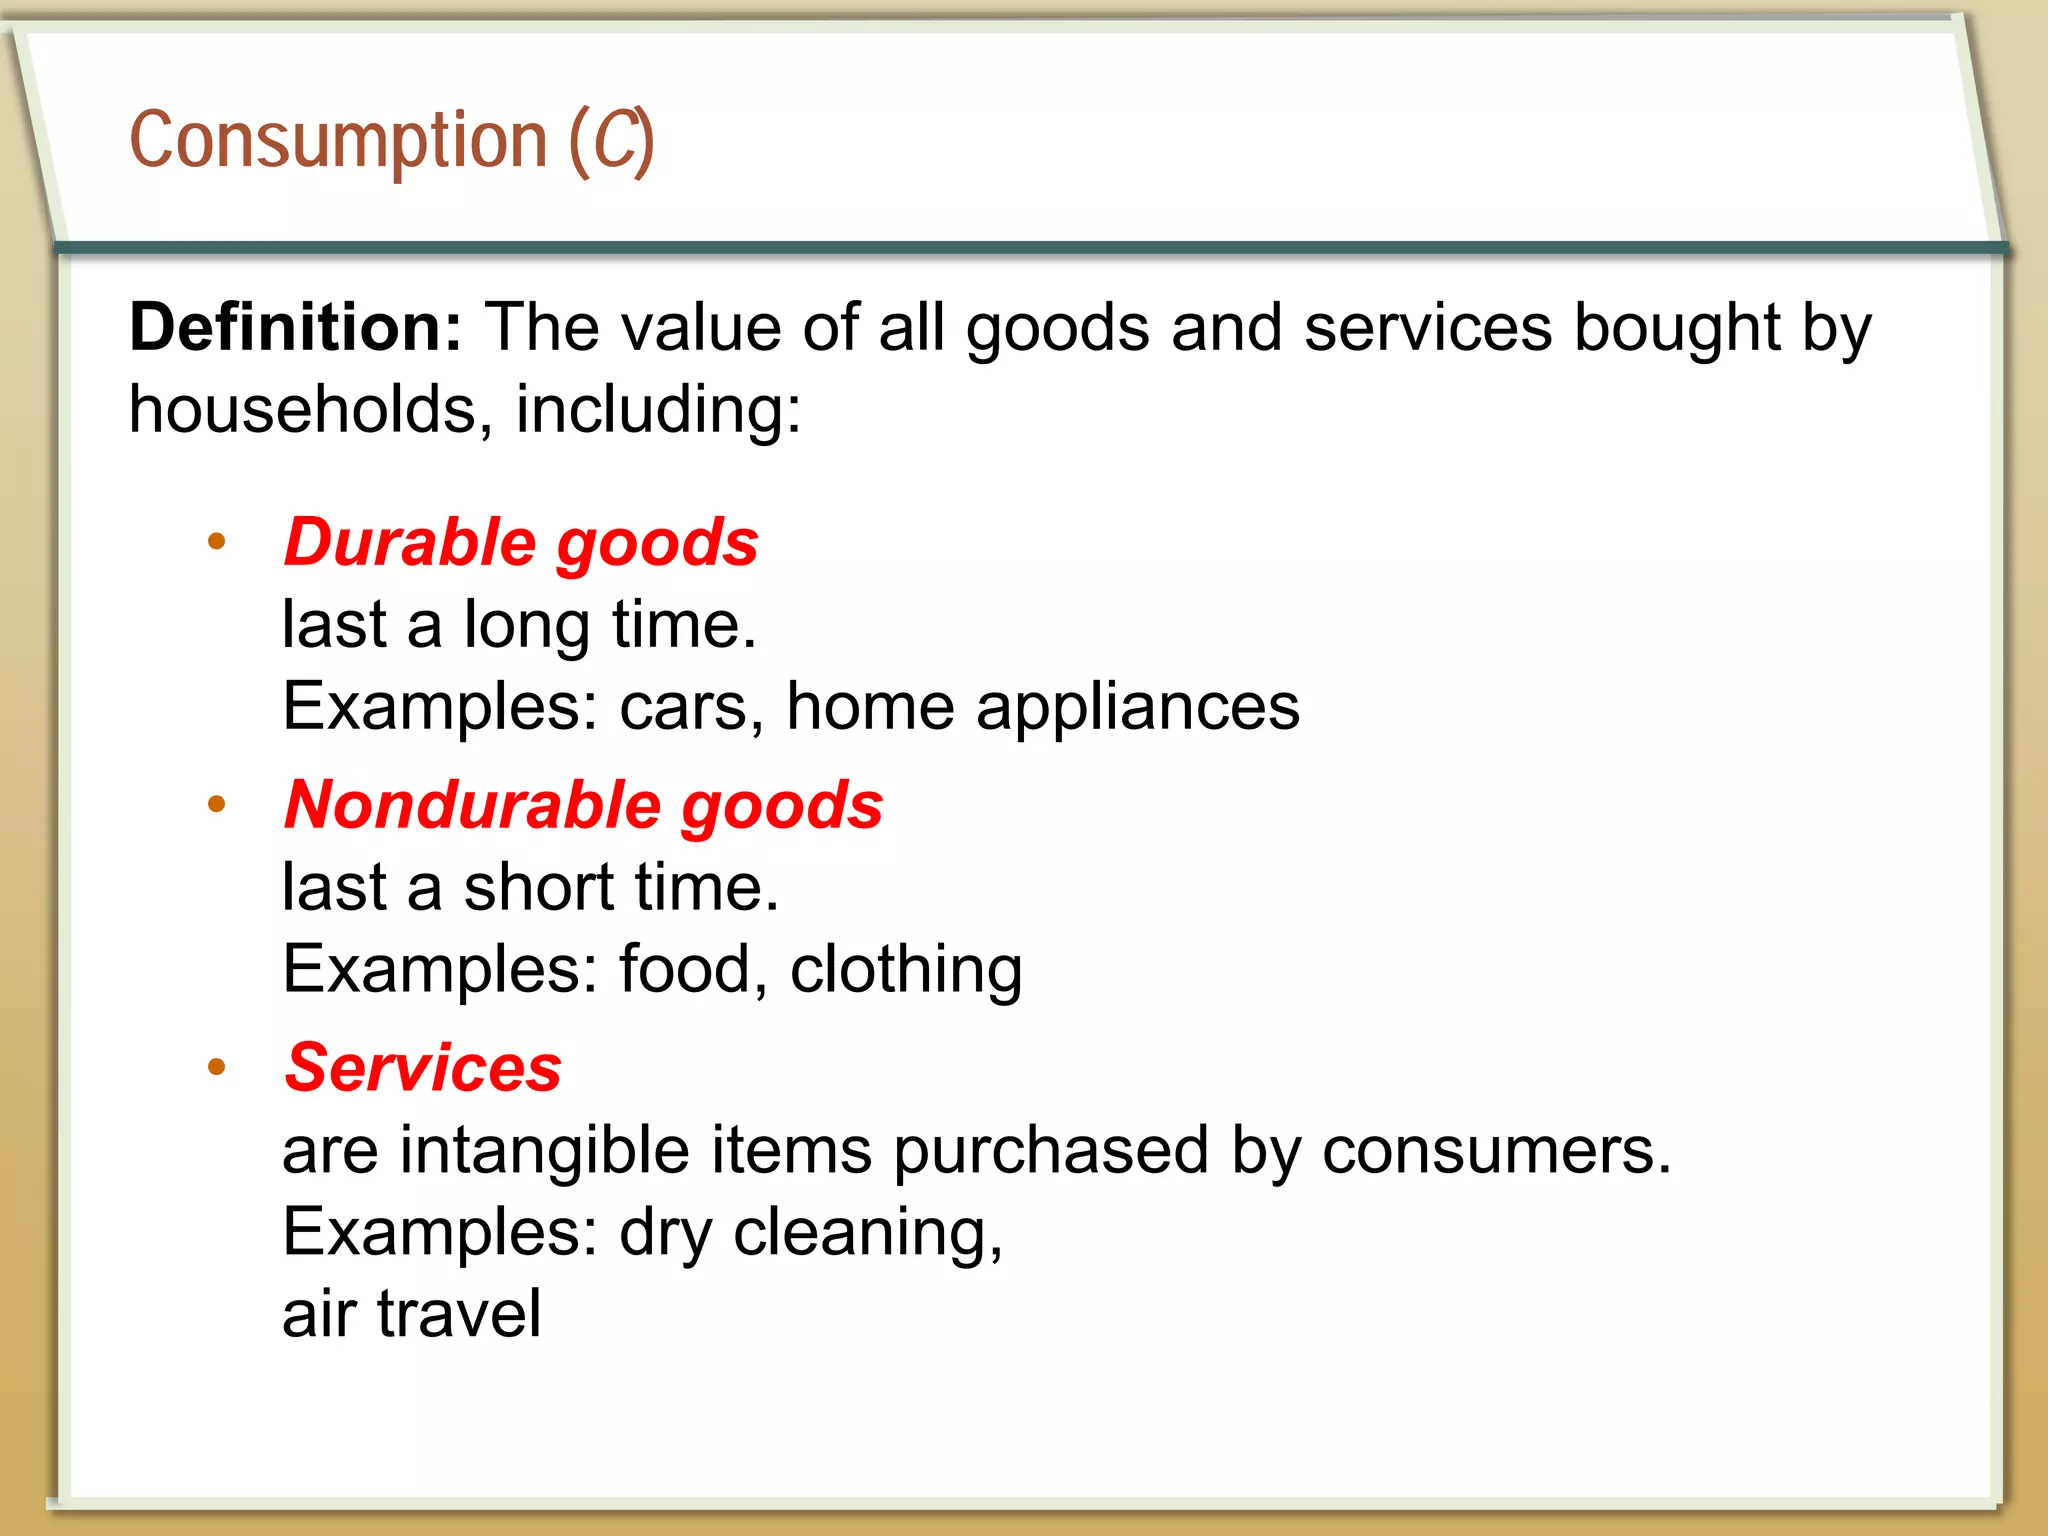
Consumption (C)
Definition: Thevalue of all goods and services bought by
households, including:
• Durable goods
last a long time.
Examples: cars, home appliances
• Nondurable goods
last a short time.
Examples: food, clothing
• Services
are intangible items purchased by consumers.
Examples: dry cleaning,
air travel
10.
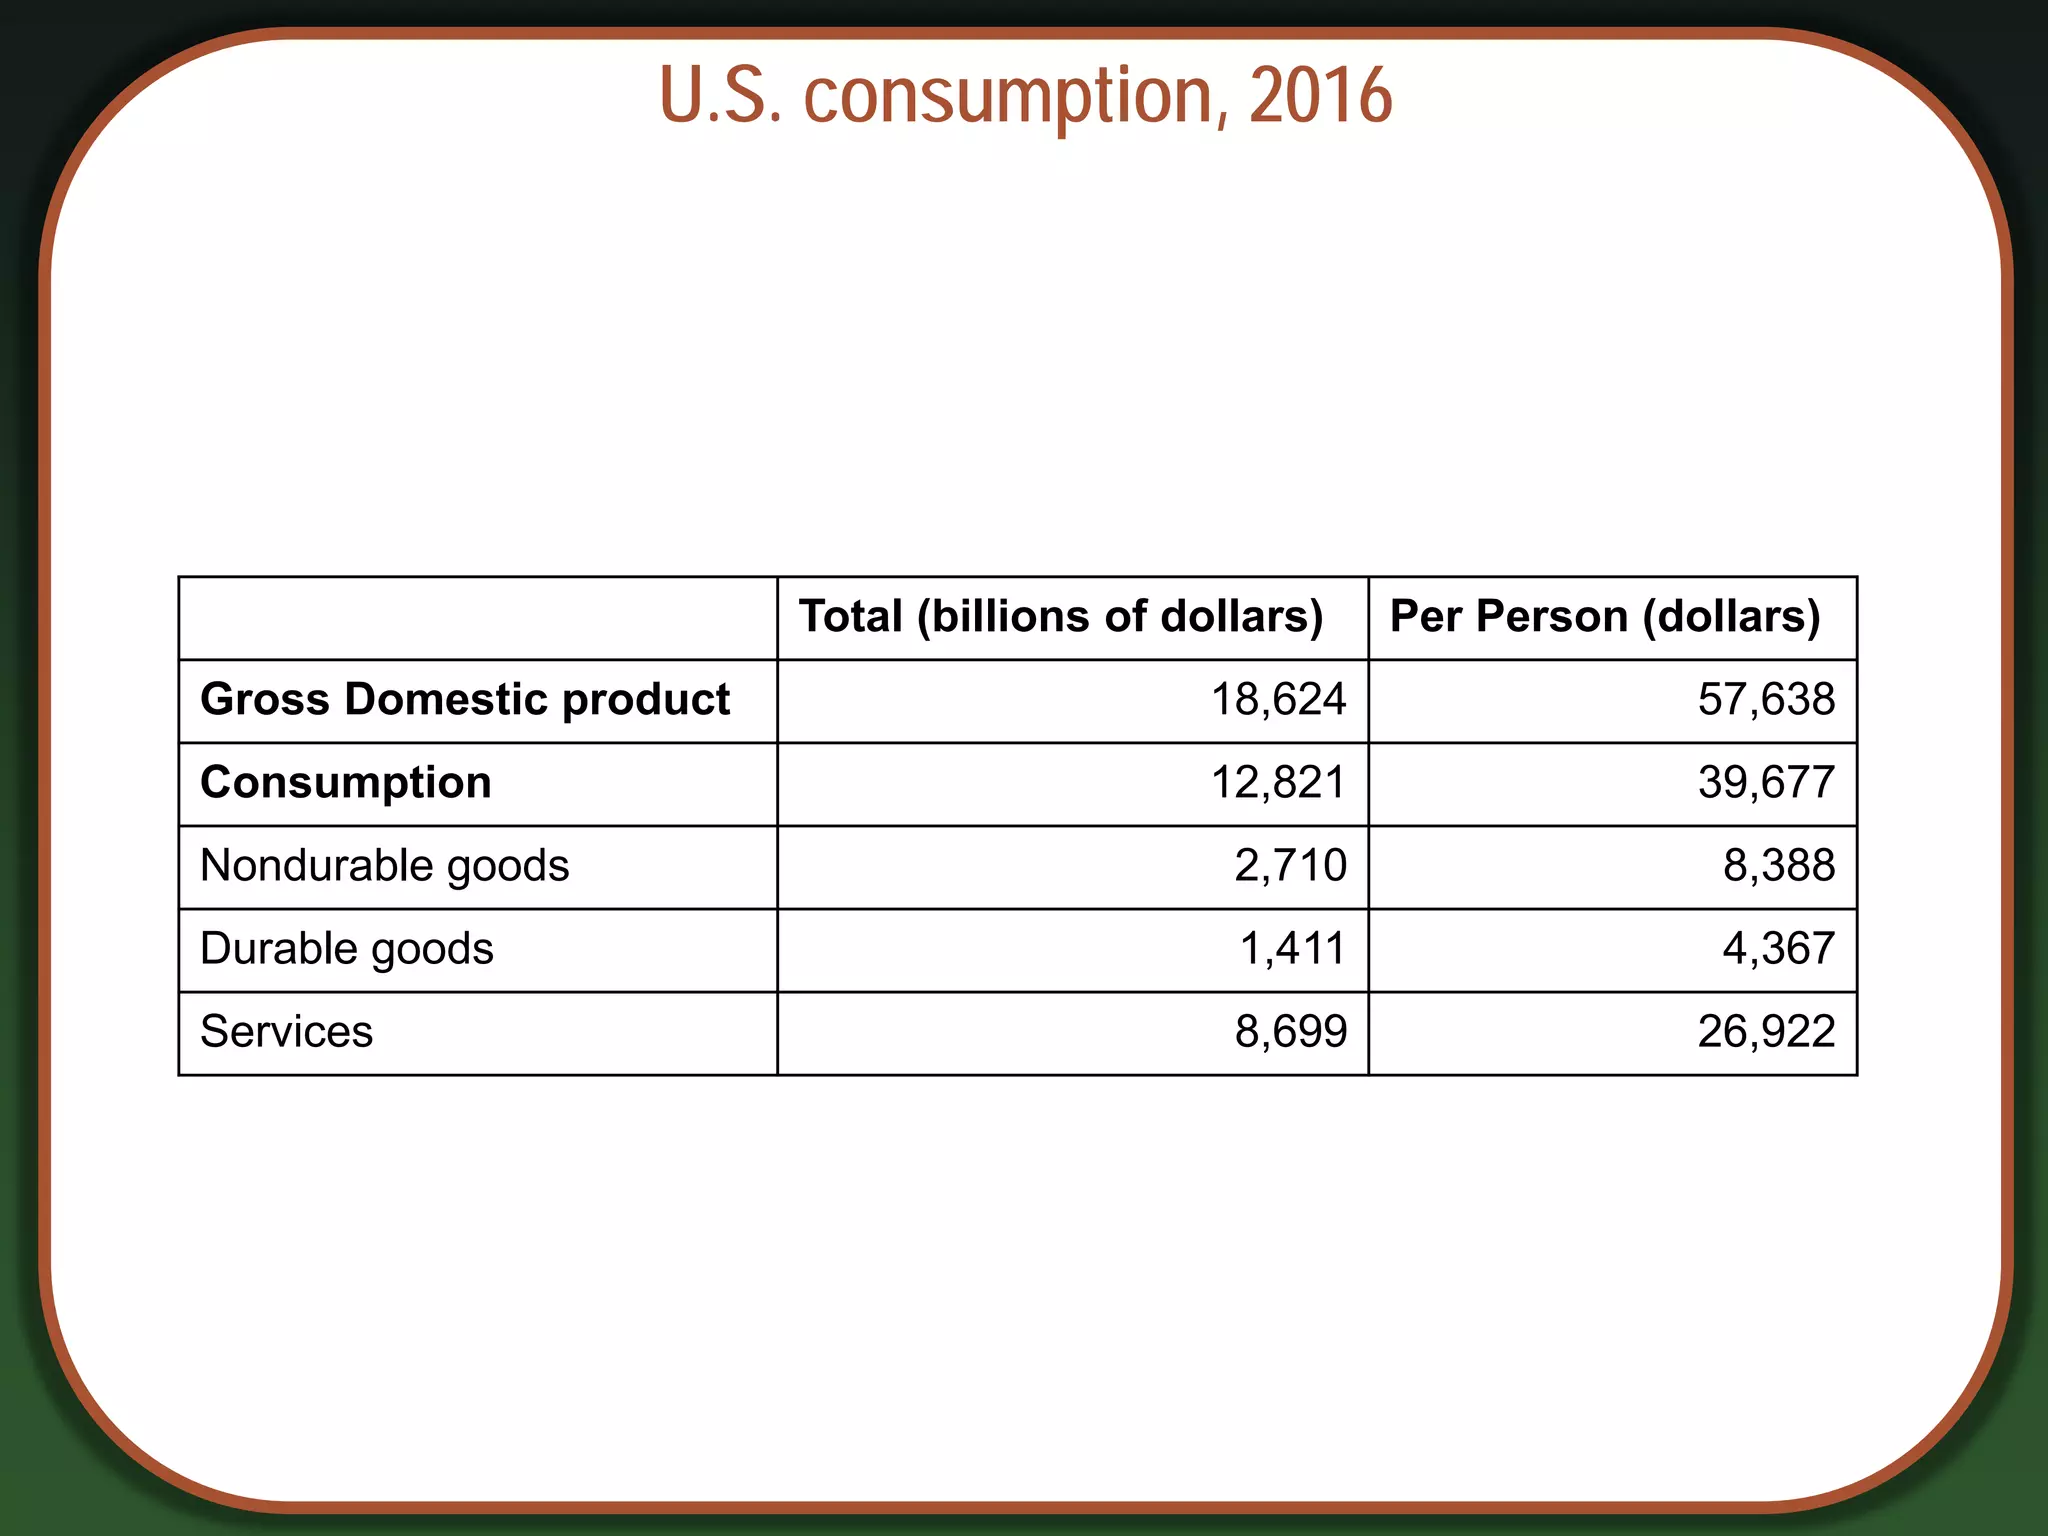
U.S. consumption, 2016
Total(billions of dollars) Per Person (dollars)
Gross Domestic product 18,624 57,638
Consumption 12,821 39,677
Nondurable goods 2,710 8,388
Durable goods 1,411 4,367
Services 8,699 26,922
11.
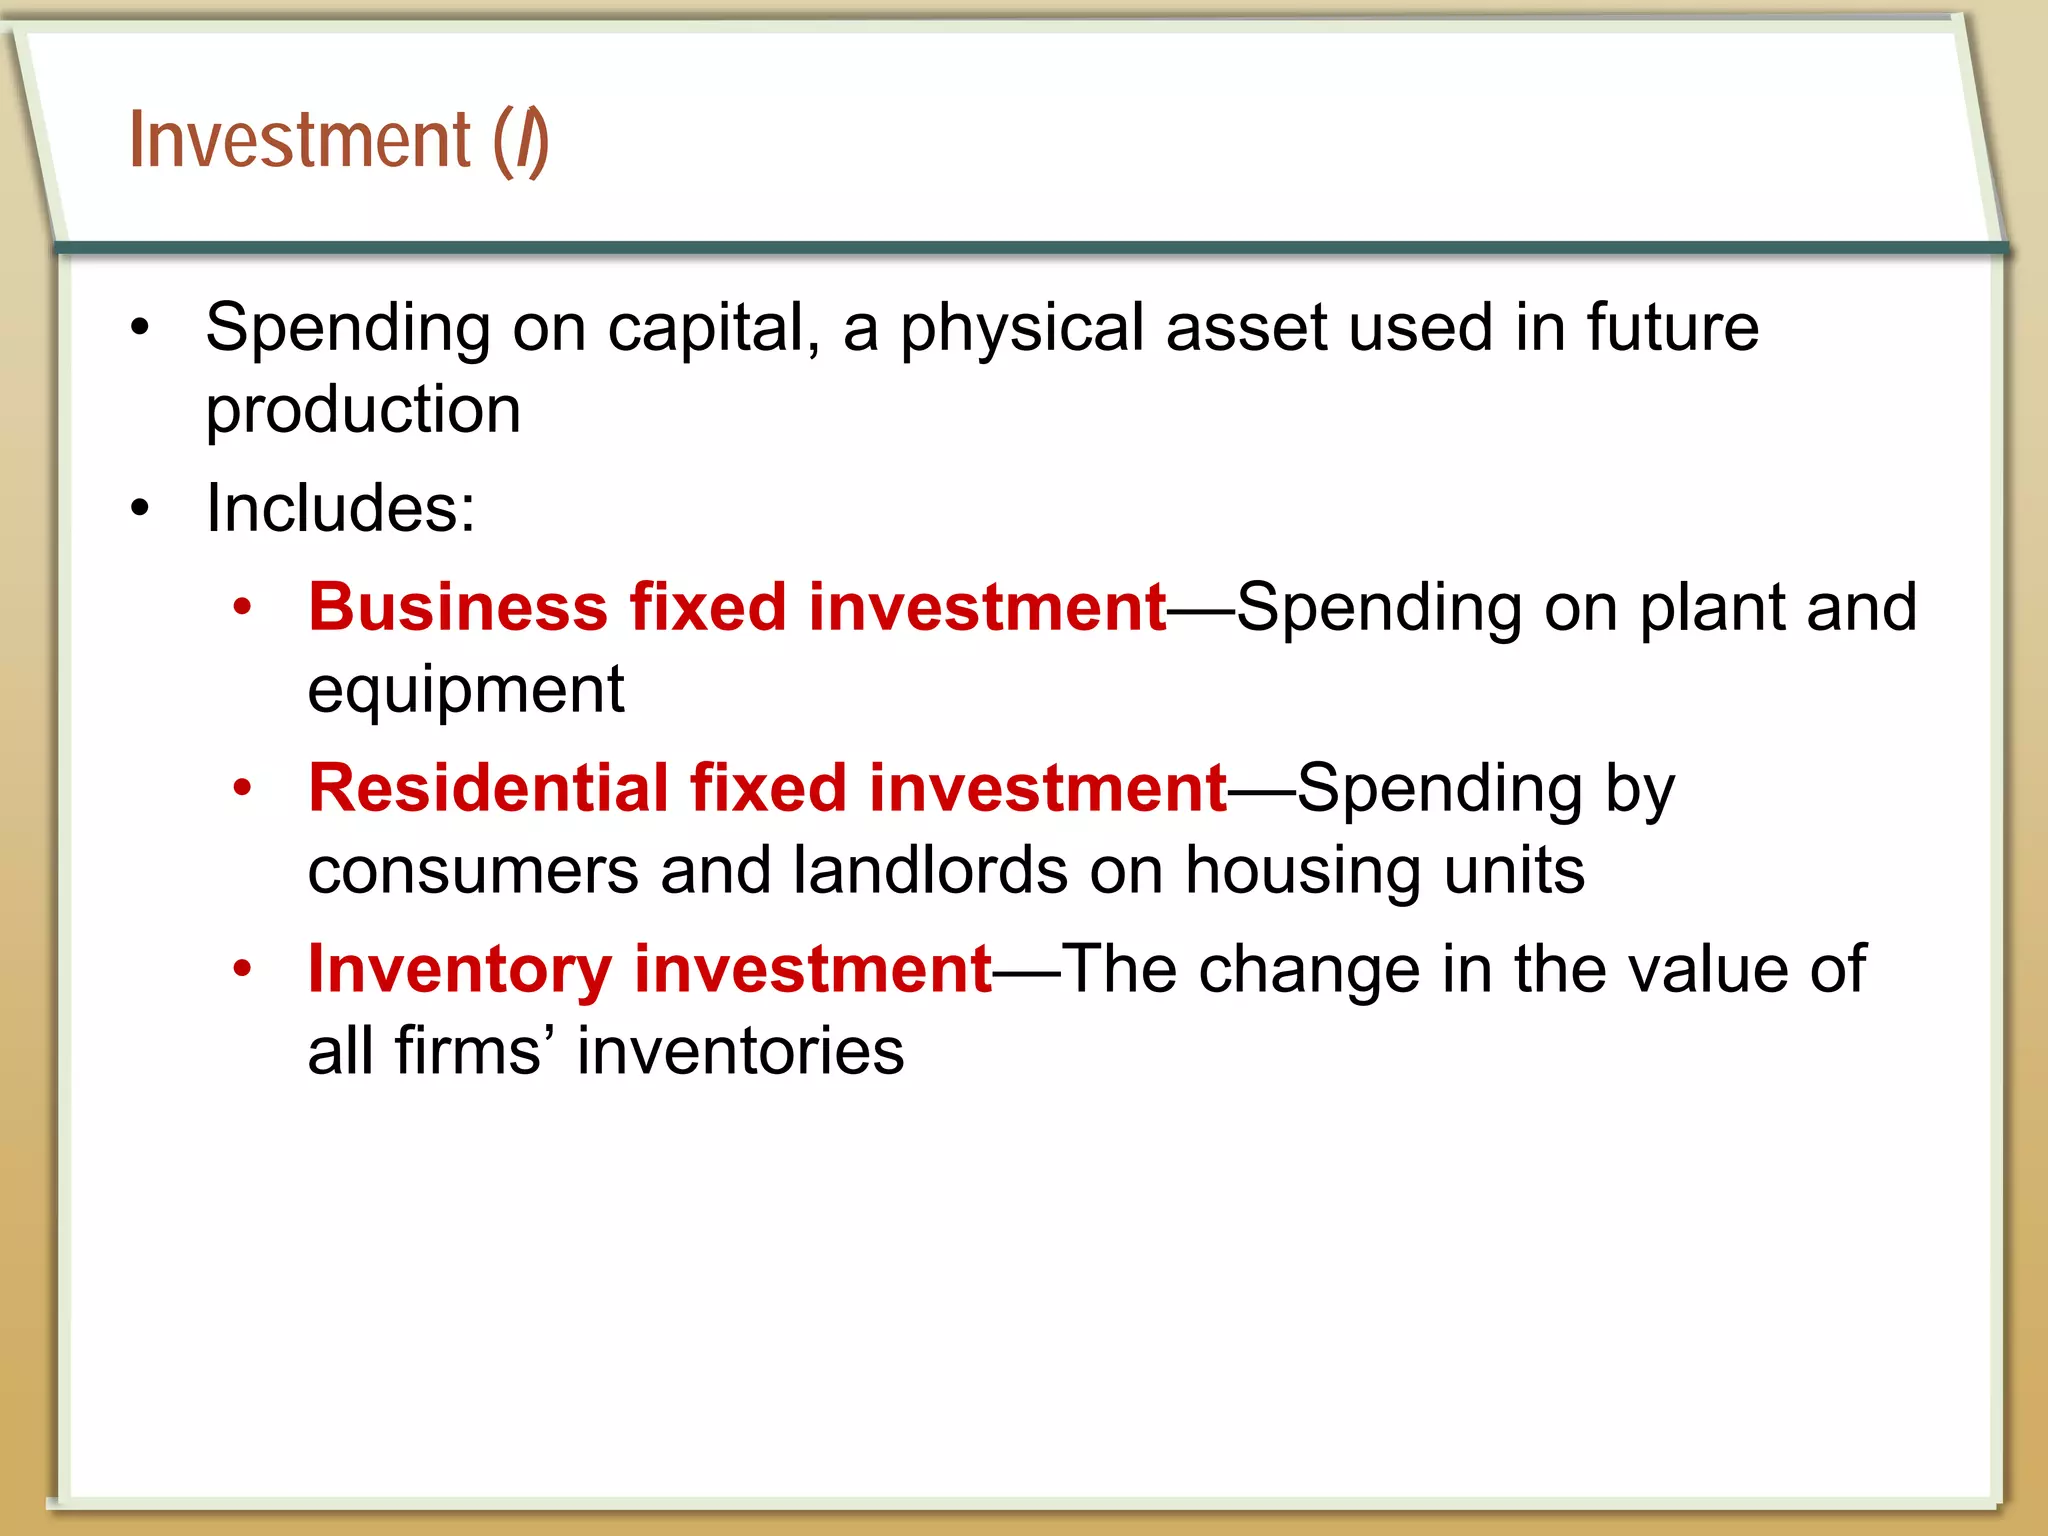
Investment (I)
• Spendingon capital, a physical asset used in future
production
• Includes:
• Business fixed investment—Spending on plant and
equipment
• Residential fixed investment—Spending by
consumers and landlords on housing units
• Inventory investment—The change in the value of
all firms’ inventories
12.
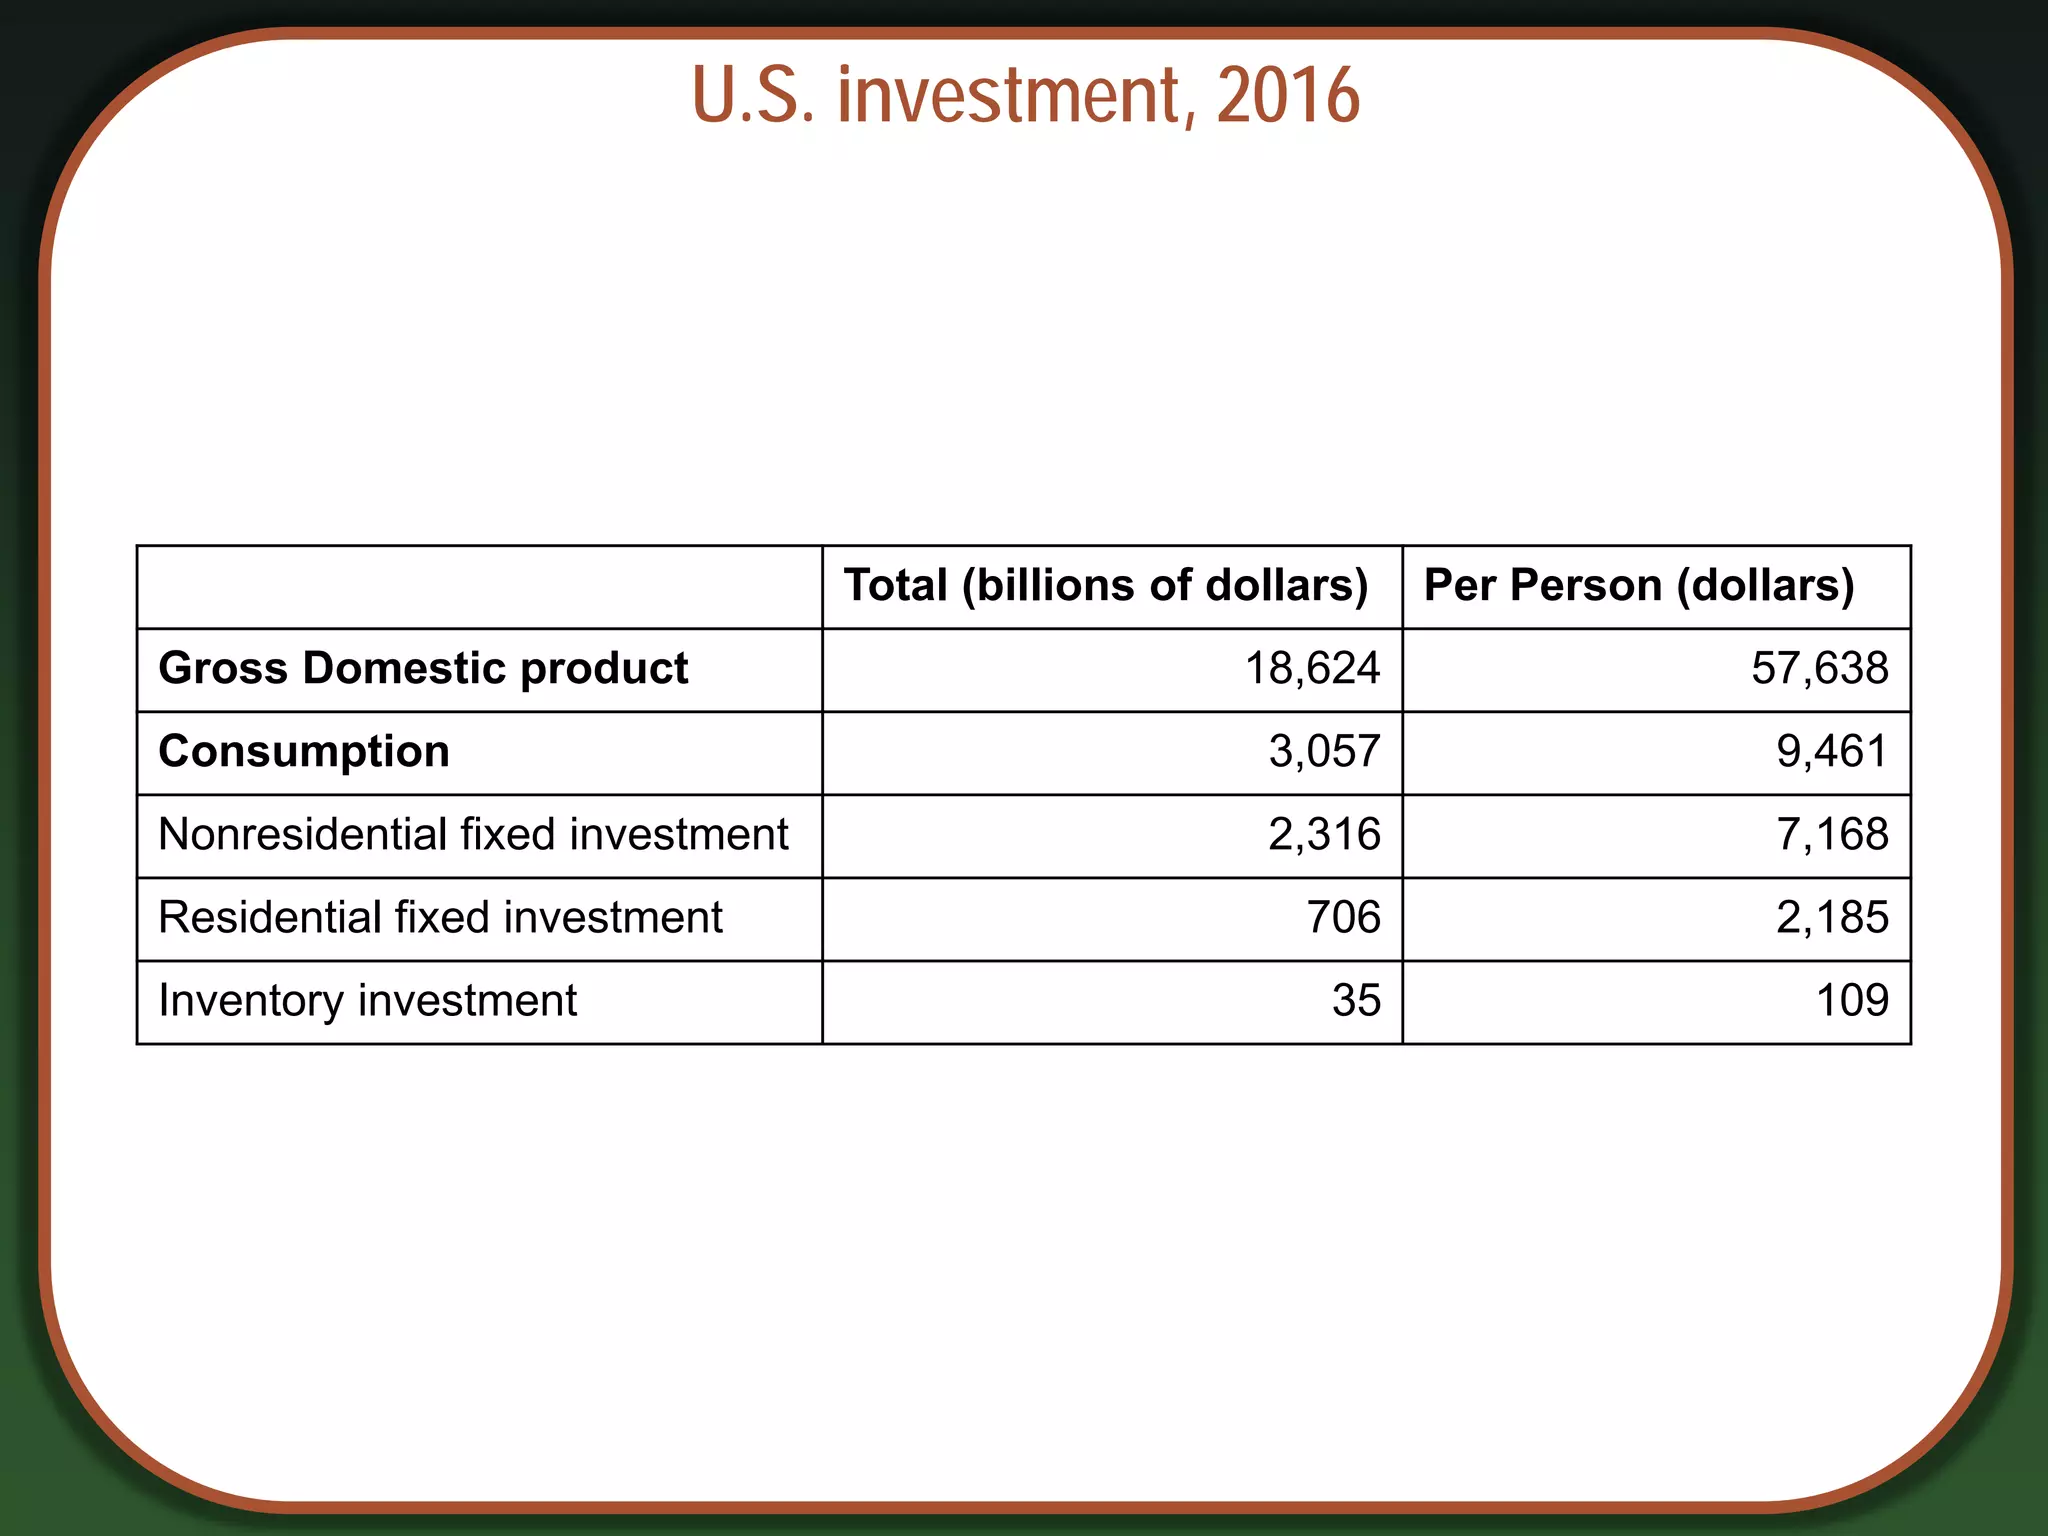
U.S. investment, 2016
Total(billions of dollars) Per Person (dollars)
Gross Domestic product 18,624 57,638
Consumption 3,057 9,461
Nonresidential fixed investment 2,316 7,168
Residential fixed investment 706 2,185
Inventory investment 35 109
13.
Government Spending (G)
•G includes all government spending on goods and
services.
• G excludes transfer payments
(e.g., unemployment insurance payments) because they
do not represent spending on goods and services.
14.
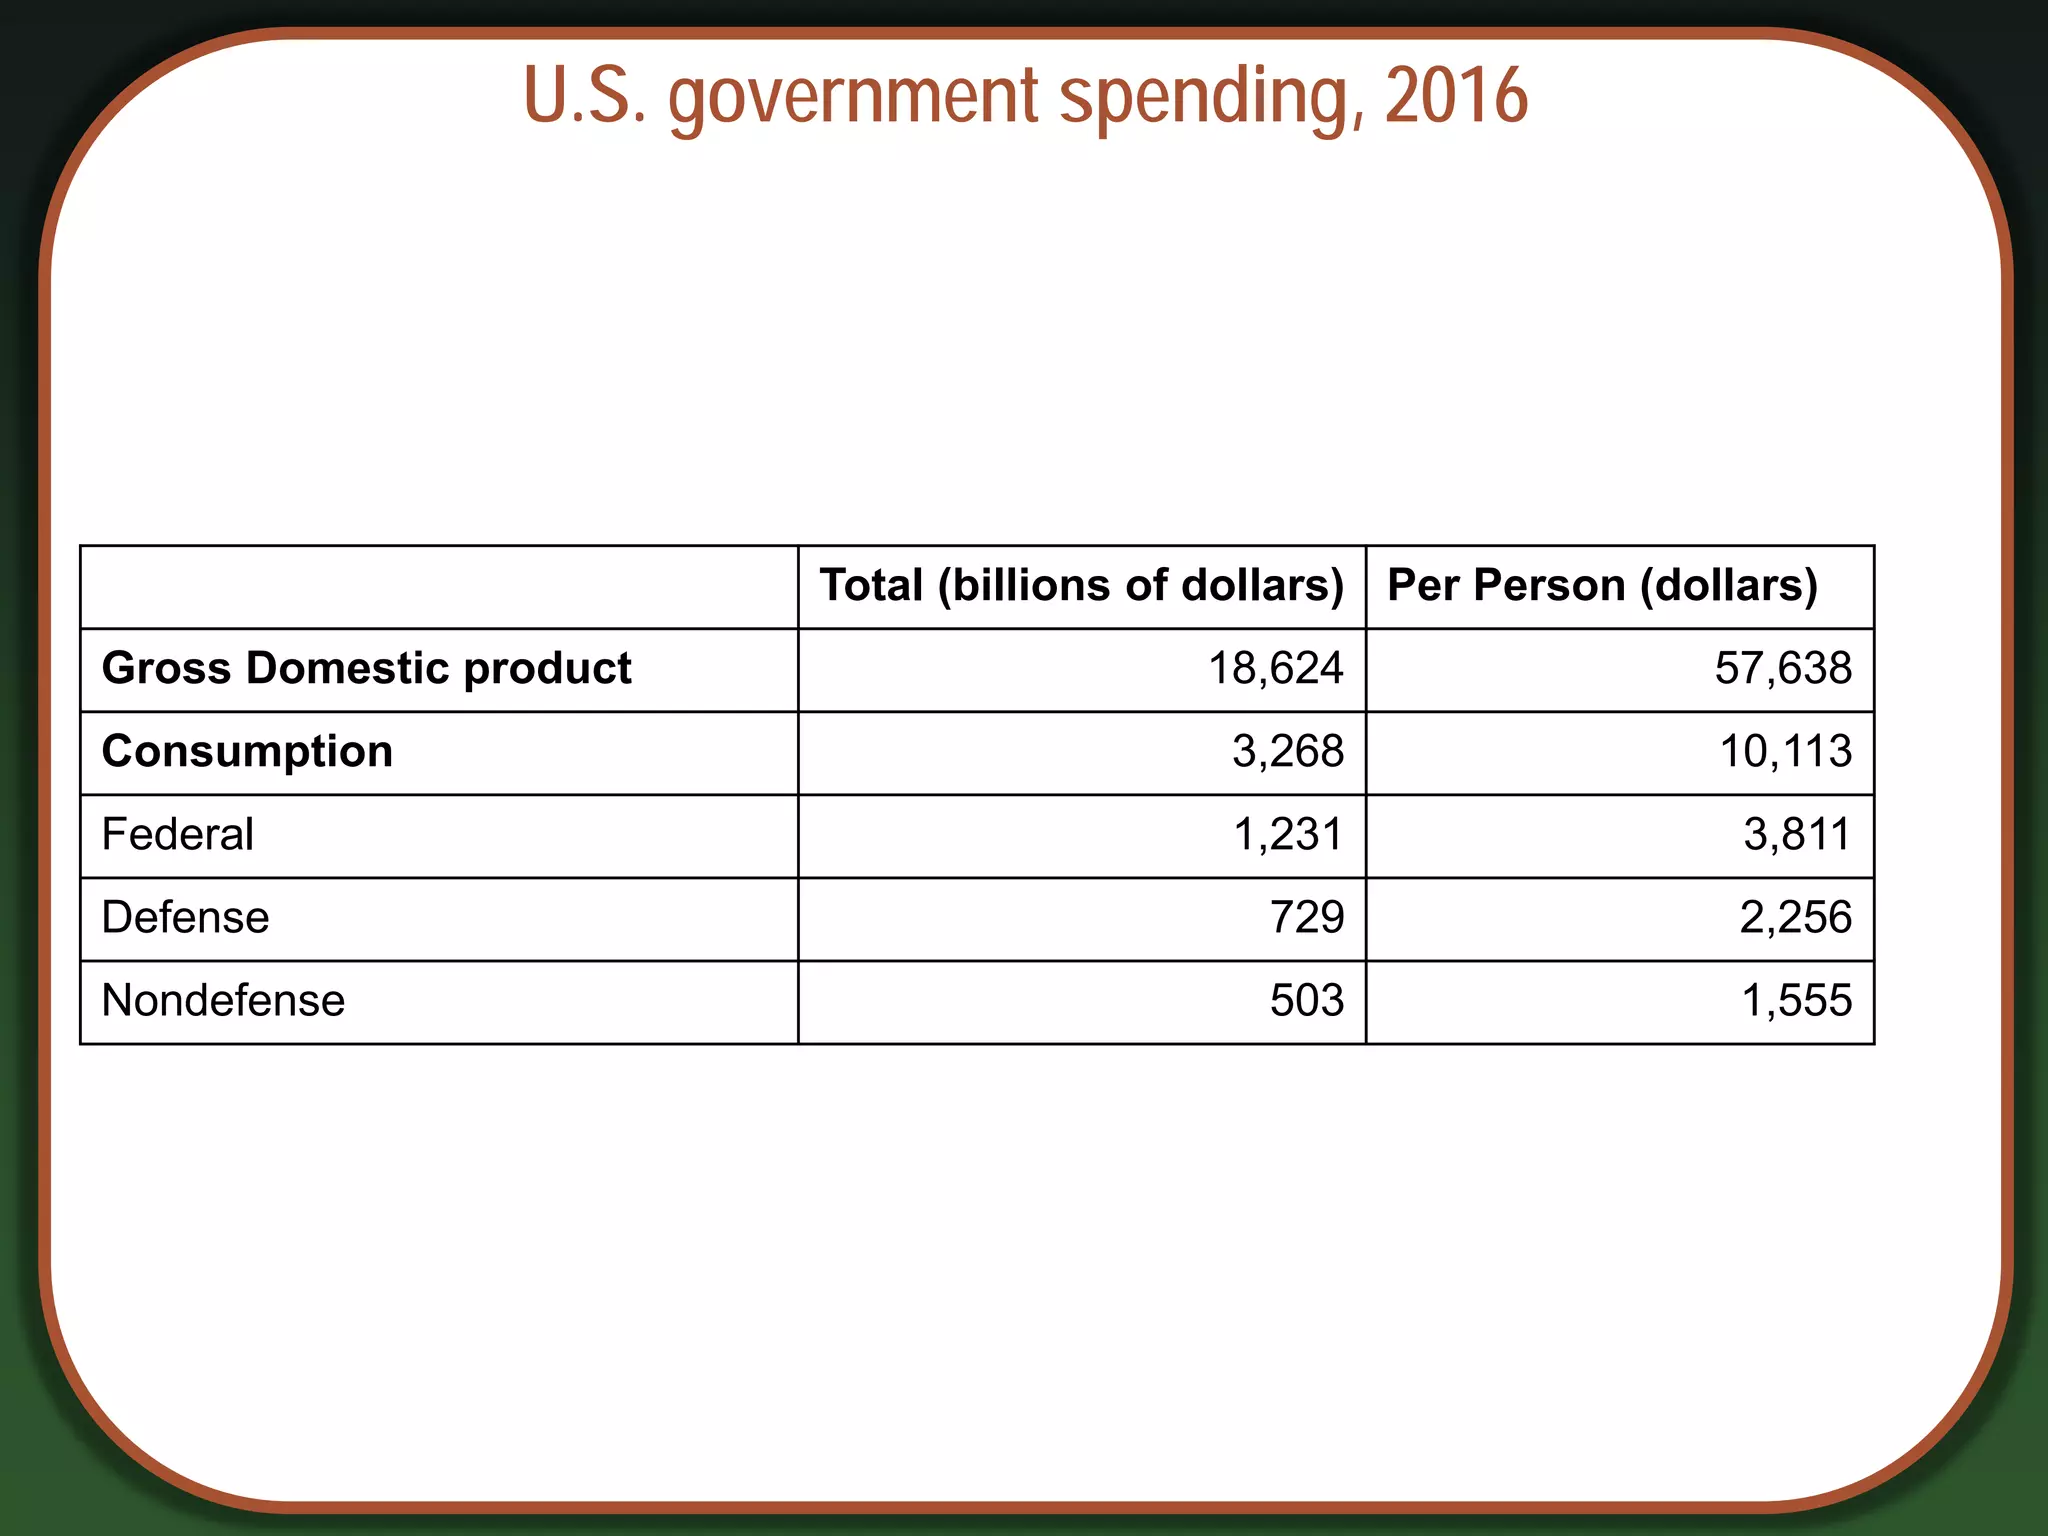
U.S. government spending,2016
Total (billions of dollars) Per Person (dollars)
Gross Domestic product 18,624 57,638
Consumption 3,268 10,113
Federal 1,231 3,811
Defense 729 2,256
Nondefense 503 1,555
15.
Net Exports (NX)
•NX = exports – imports
• Exports: the value of g&s (goods and services) sold
to other countries
• Imports: the value of g&s purchased from other
countries
• Hence, NX equals net spending from abroad on our g&s.
16.
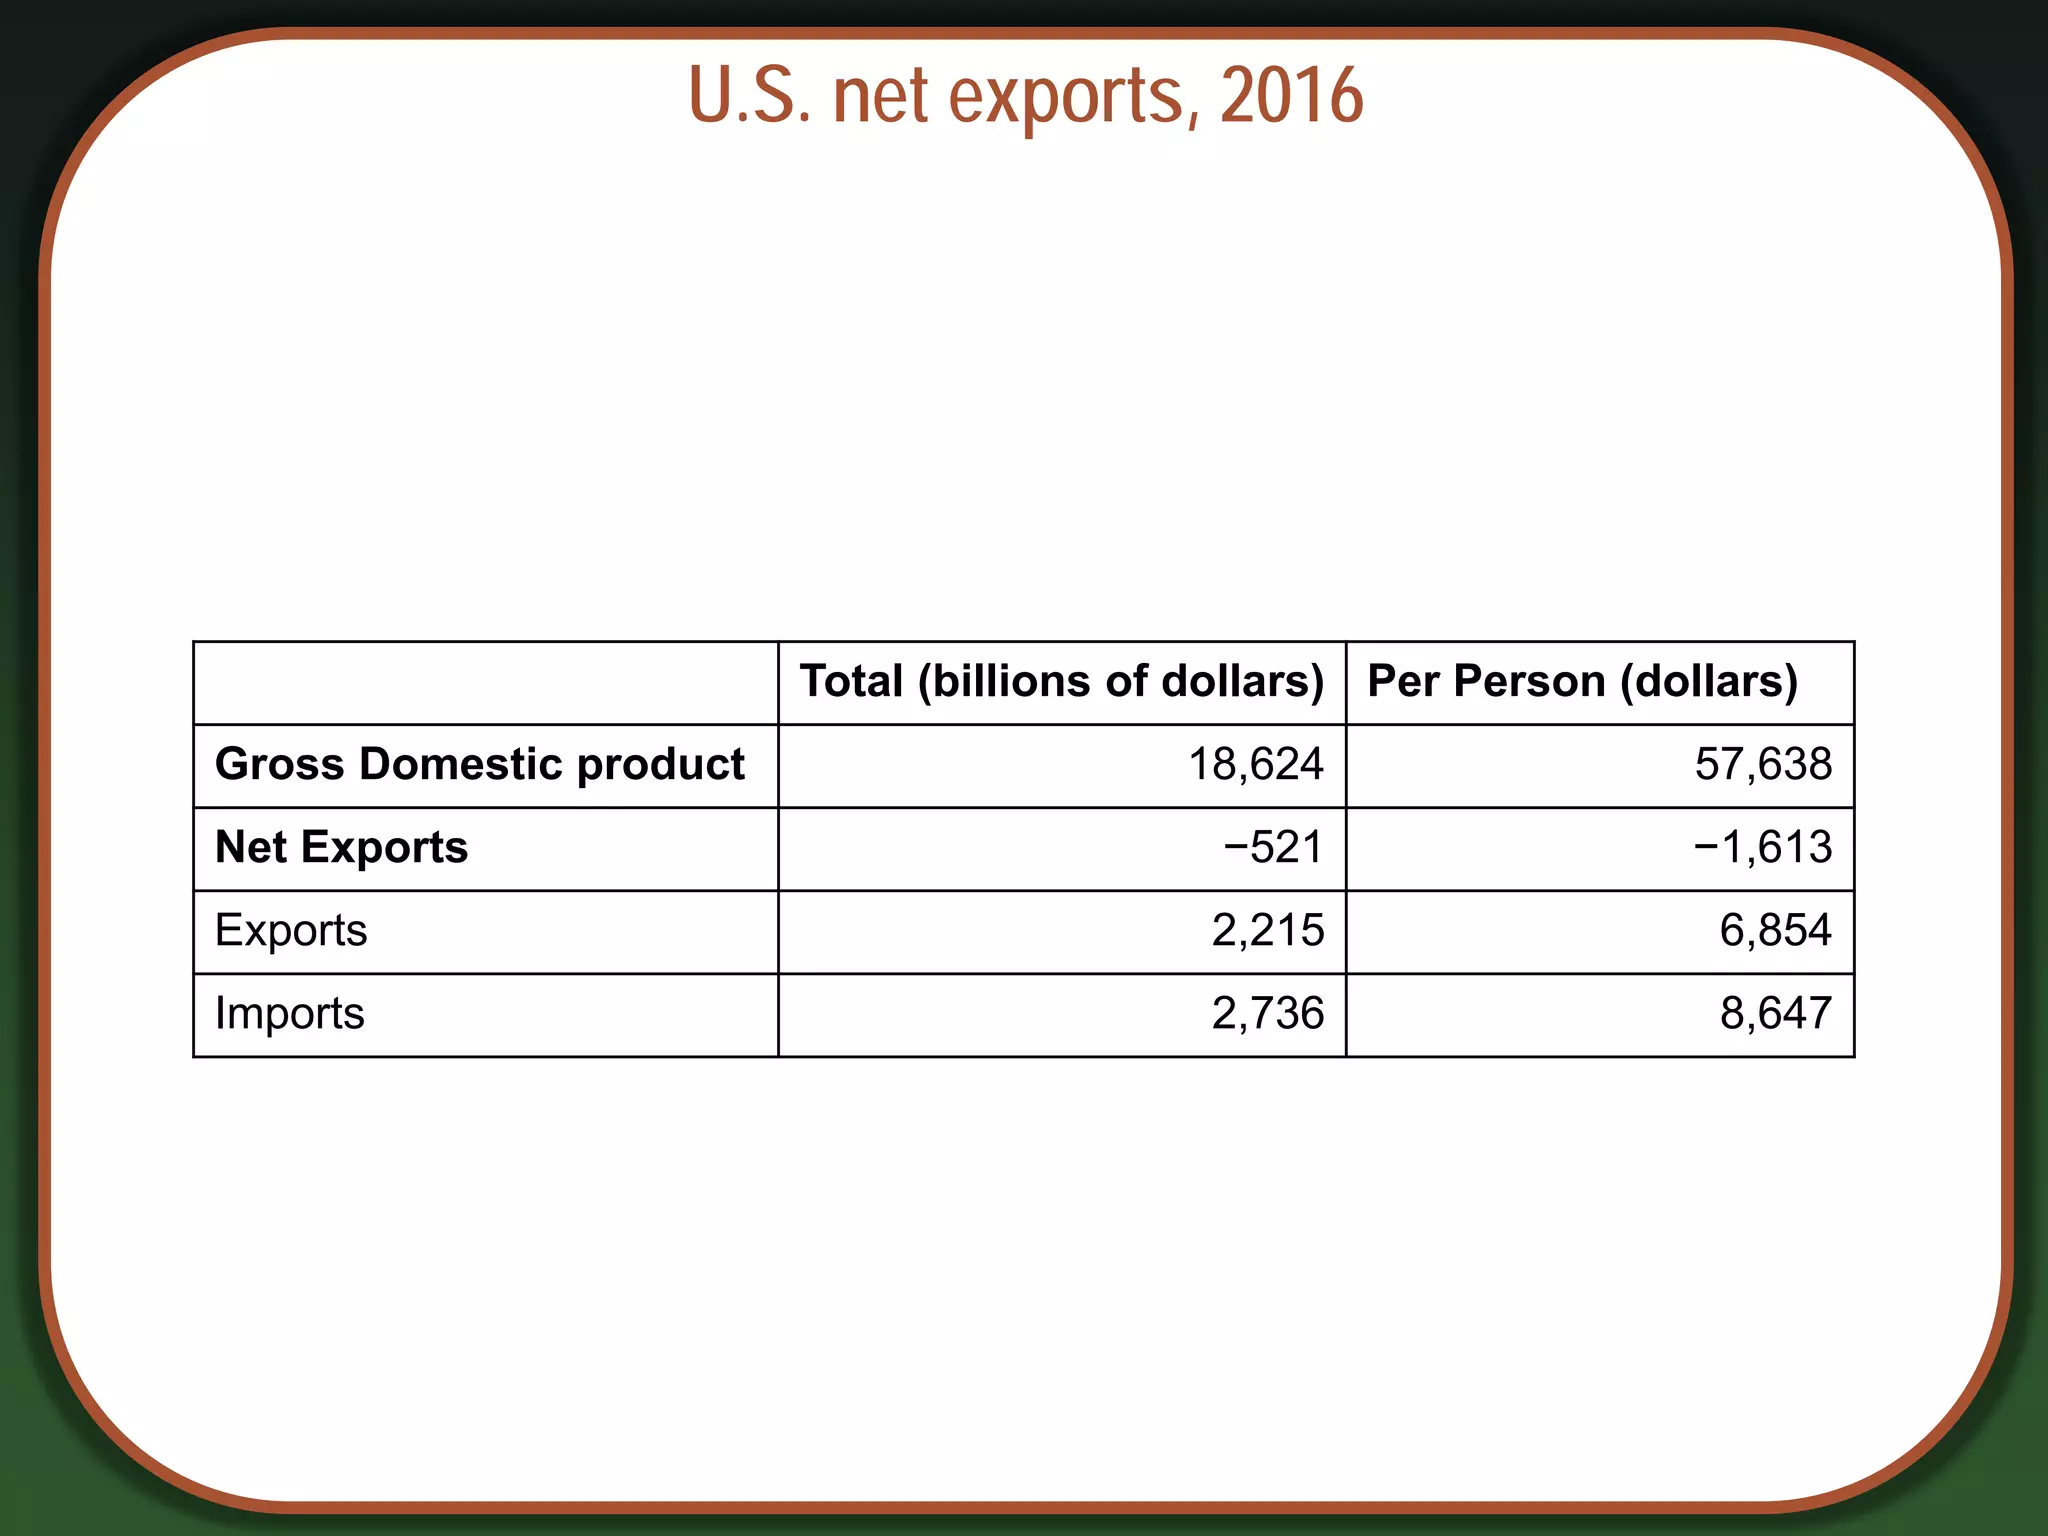
U.S. net exports,2016
Total (billions of dollars) Per Person (dollars)
Gross Domestic product 18,624 57,638
Net Exports −521 −1,613
Exports 2,215 6,854
Imports 2,736 8,647
17.
NOW YOU TRY
Anexpenditure-output puzzle?
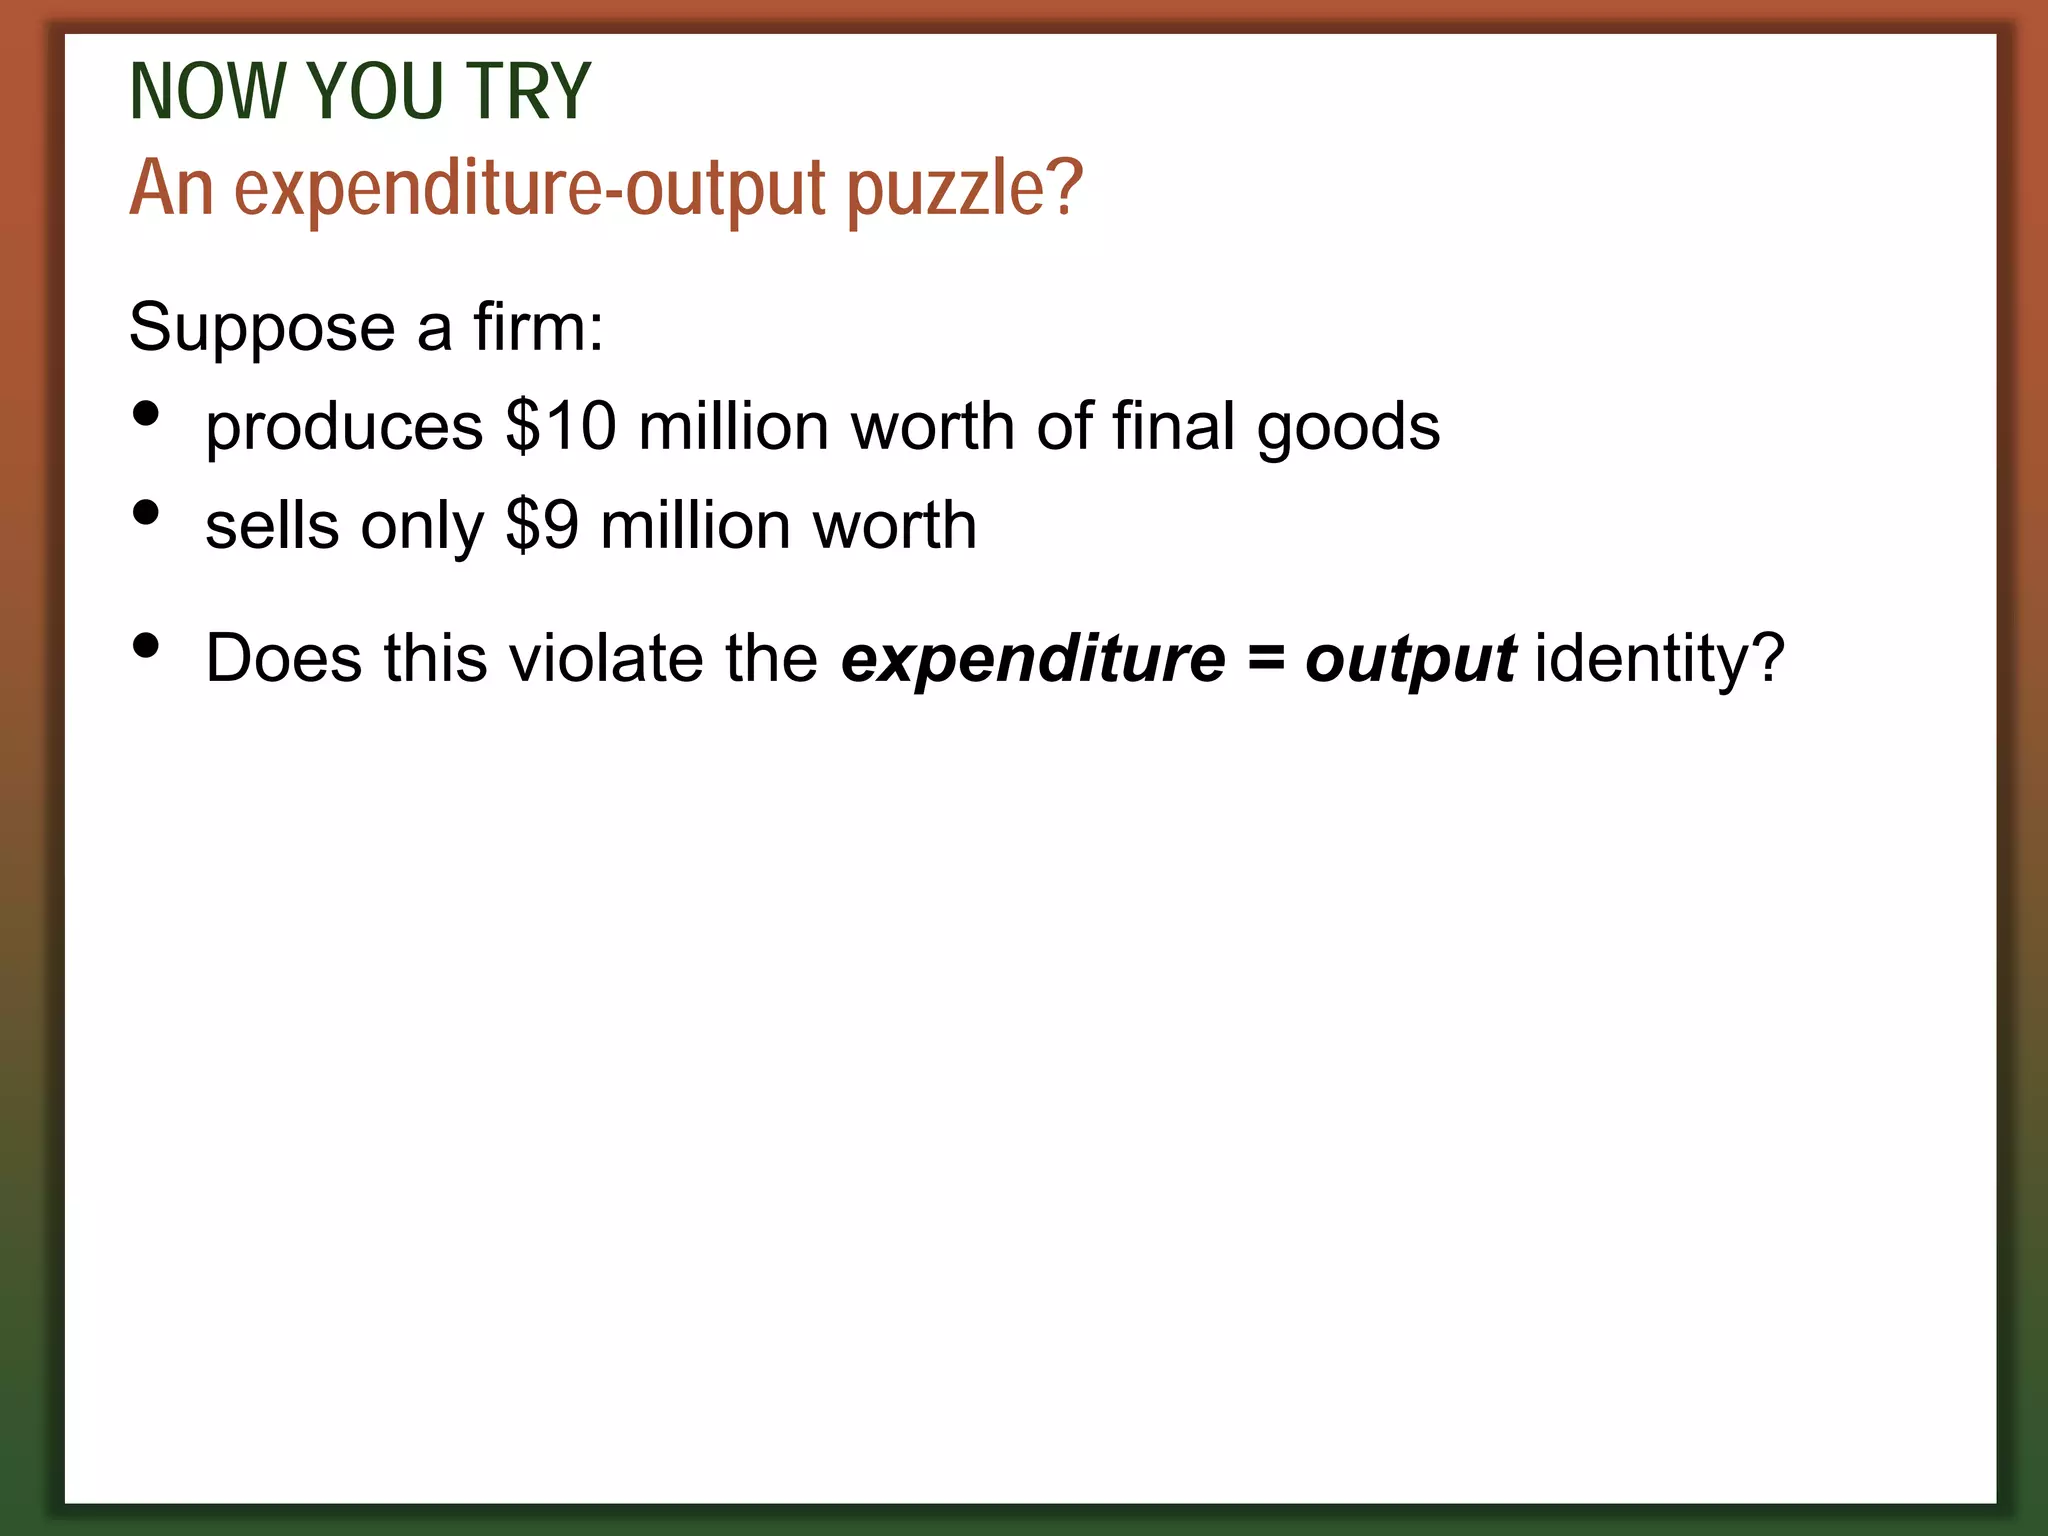
Suppose a firm:
• produces $10 million worth of final goods
• sells only $9 million worth
• Does this violate the expenditure = output identity?
18.
Why output =expenditure
• Unsold output goes into inventory and is counted as
“inventory investment” . . . whether or not the inventory
buildup was intentional.
• In effect, we are assuming that firms purchase their
unsold output.
19.
Stocks vs. flows
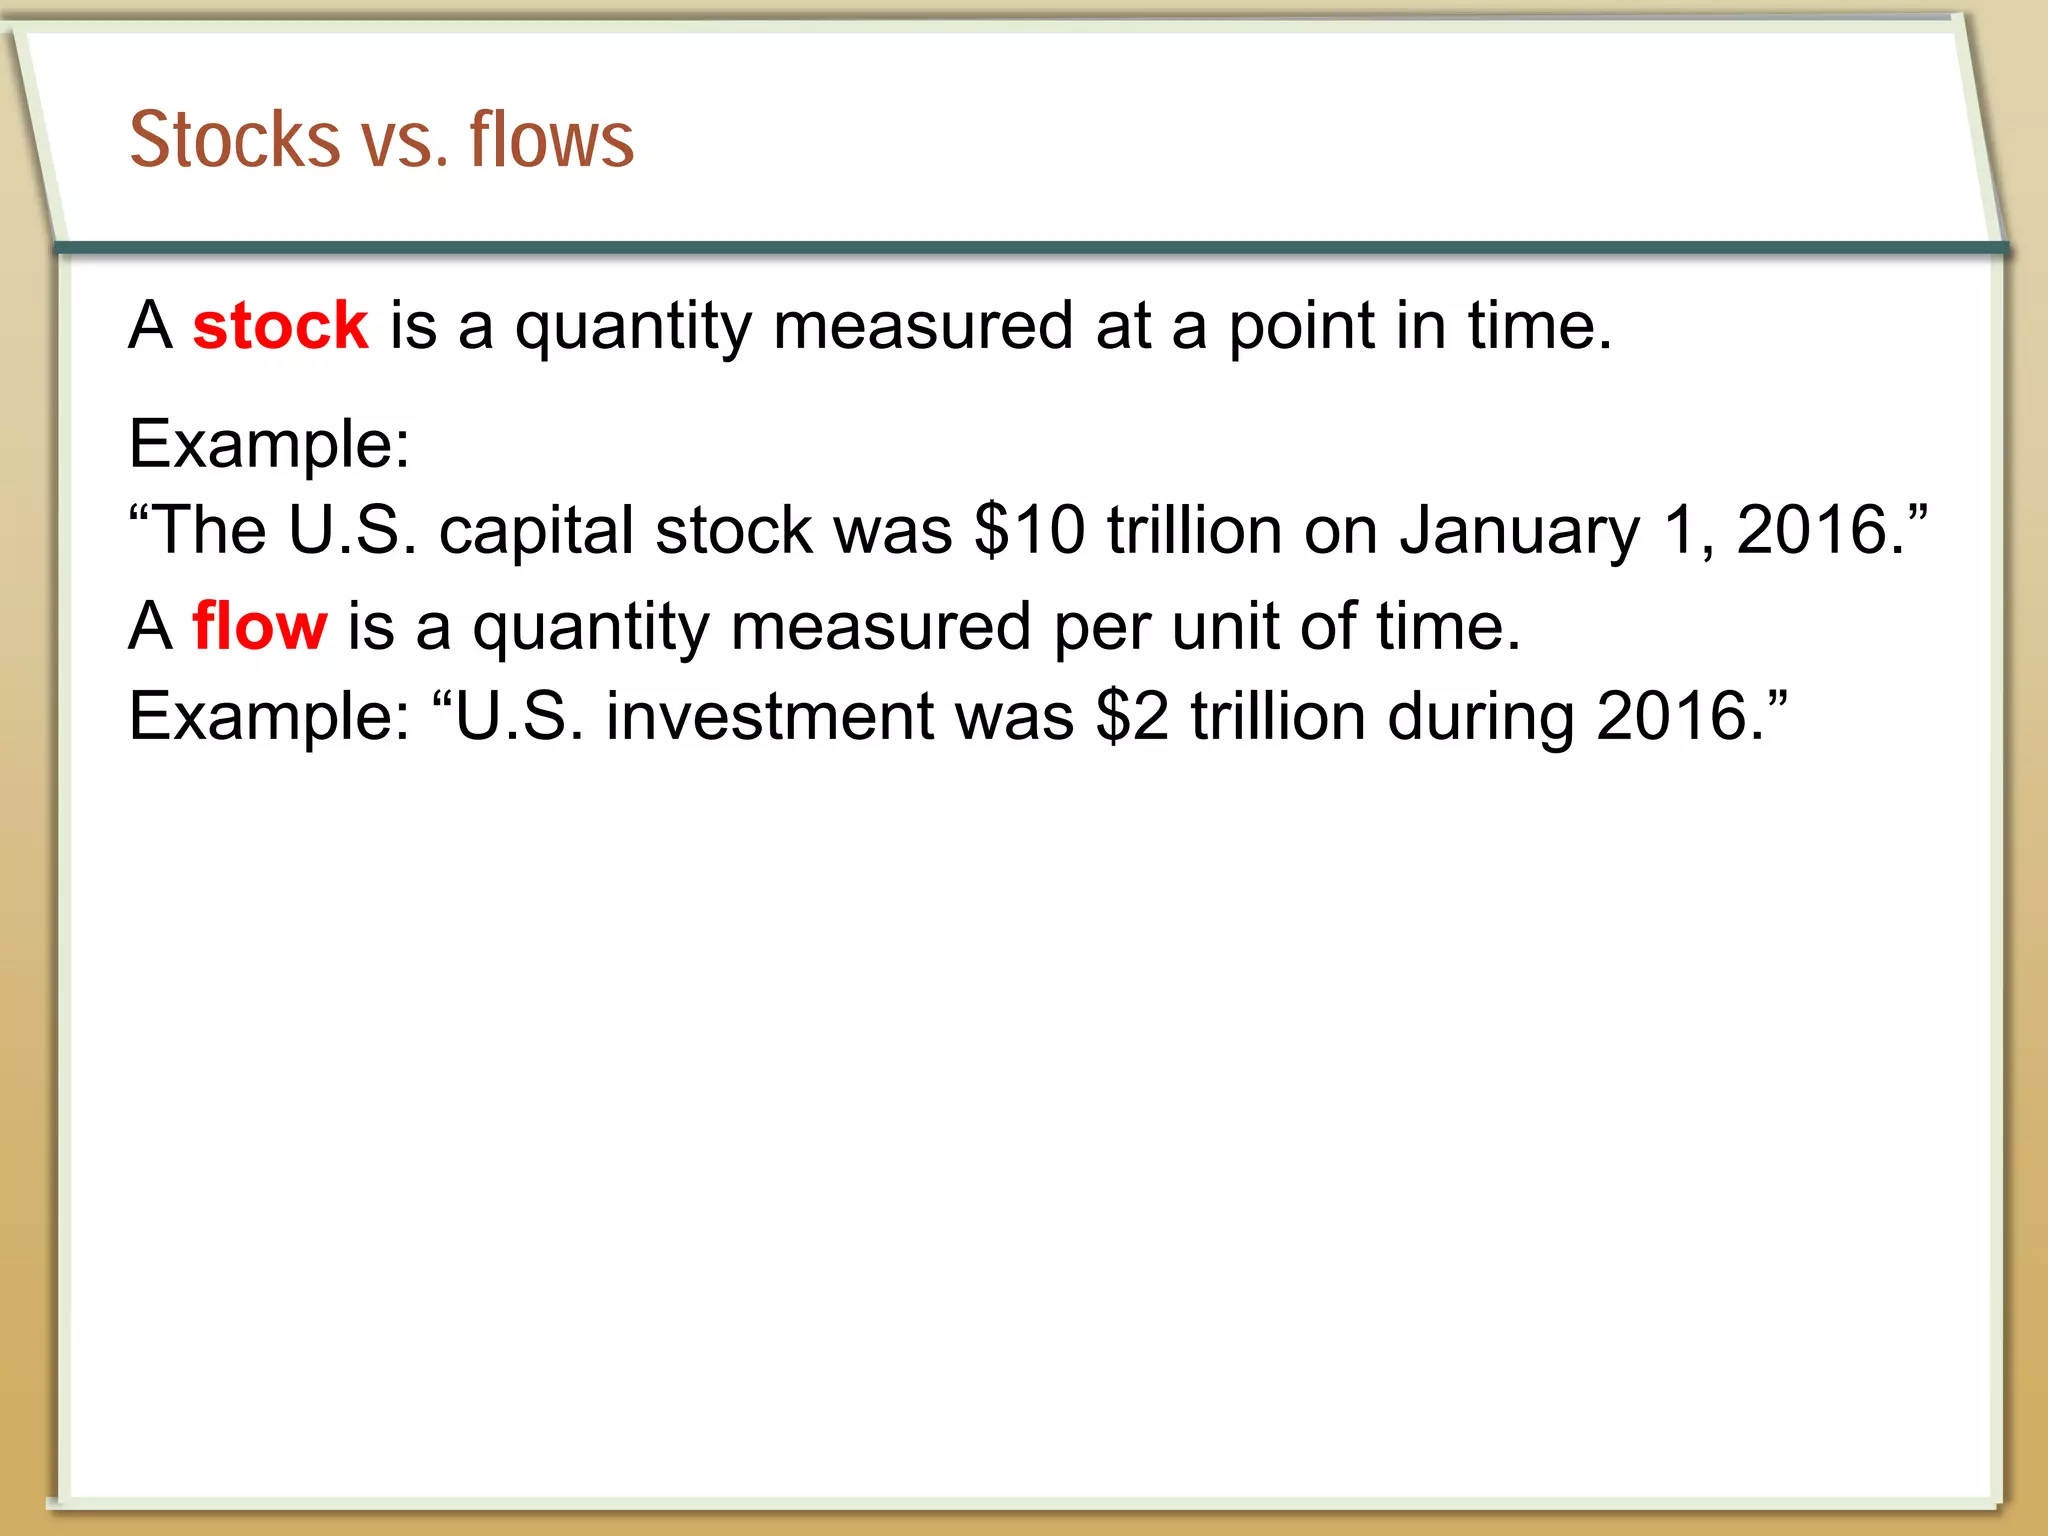
Astock is a quantity measured at a point in time.
Example:
“The U.S. capital stock was $10 trillion on January 1, 2016.”
A flow is a quantity measured per unit of time.
Example: “U.S. investment was $2 trillion during 2016.”
20.
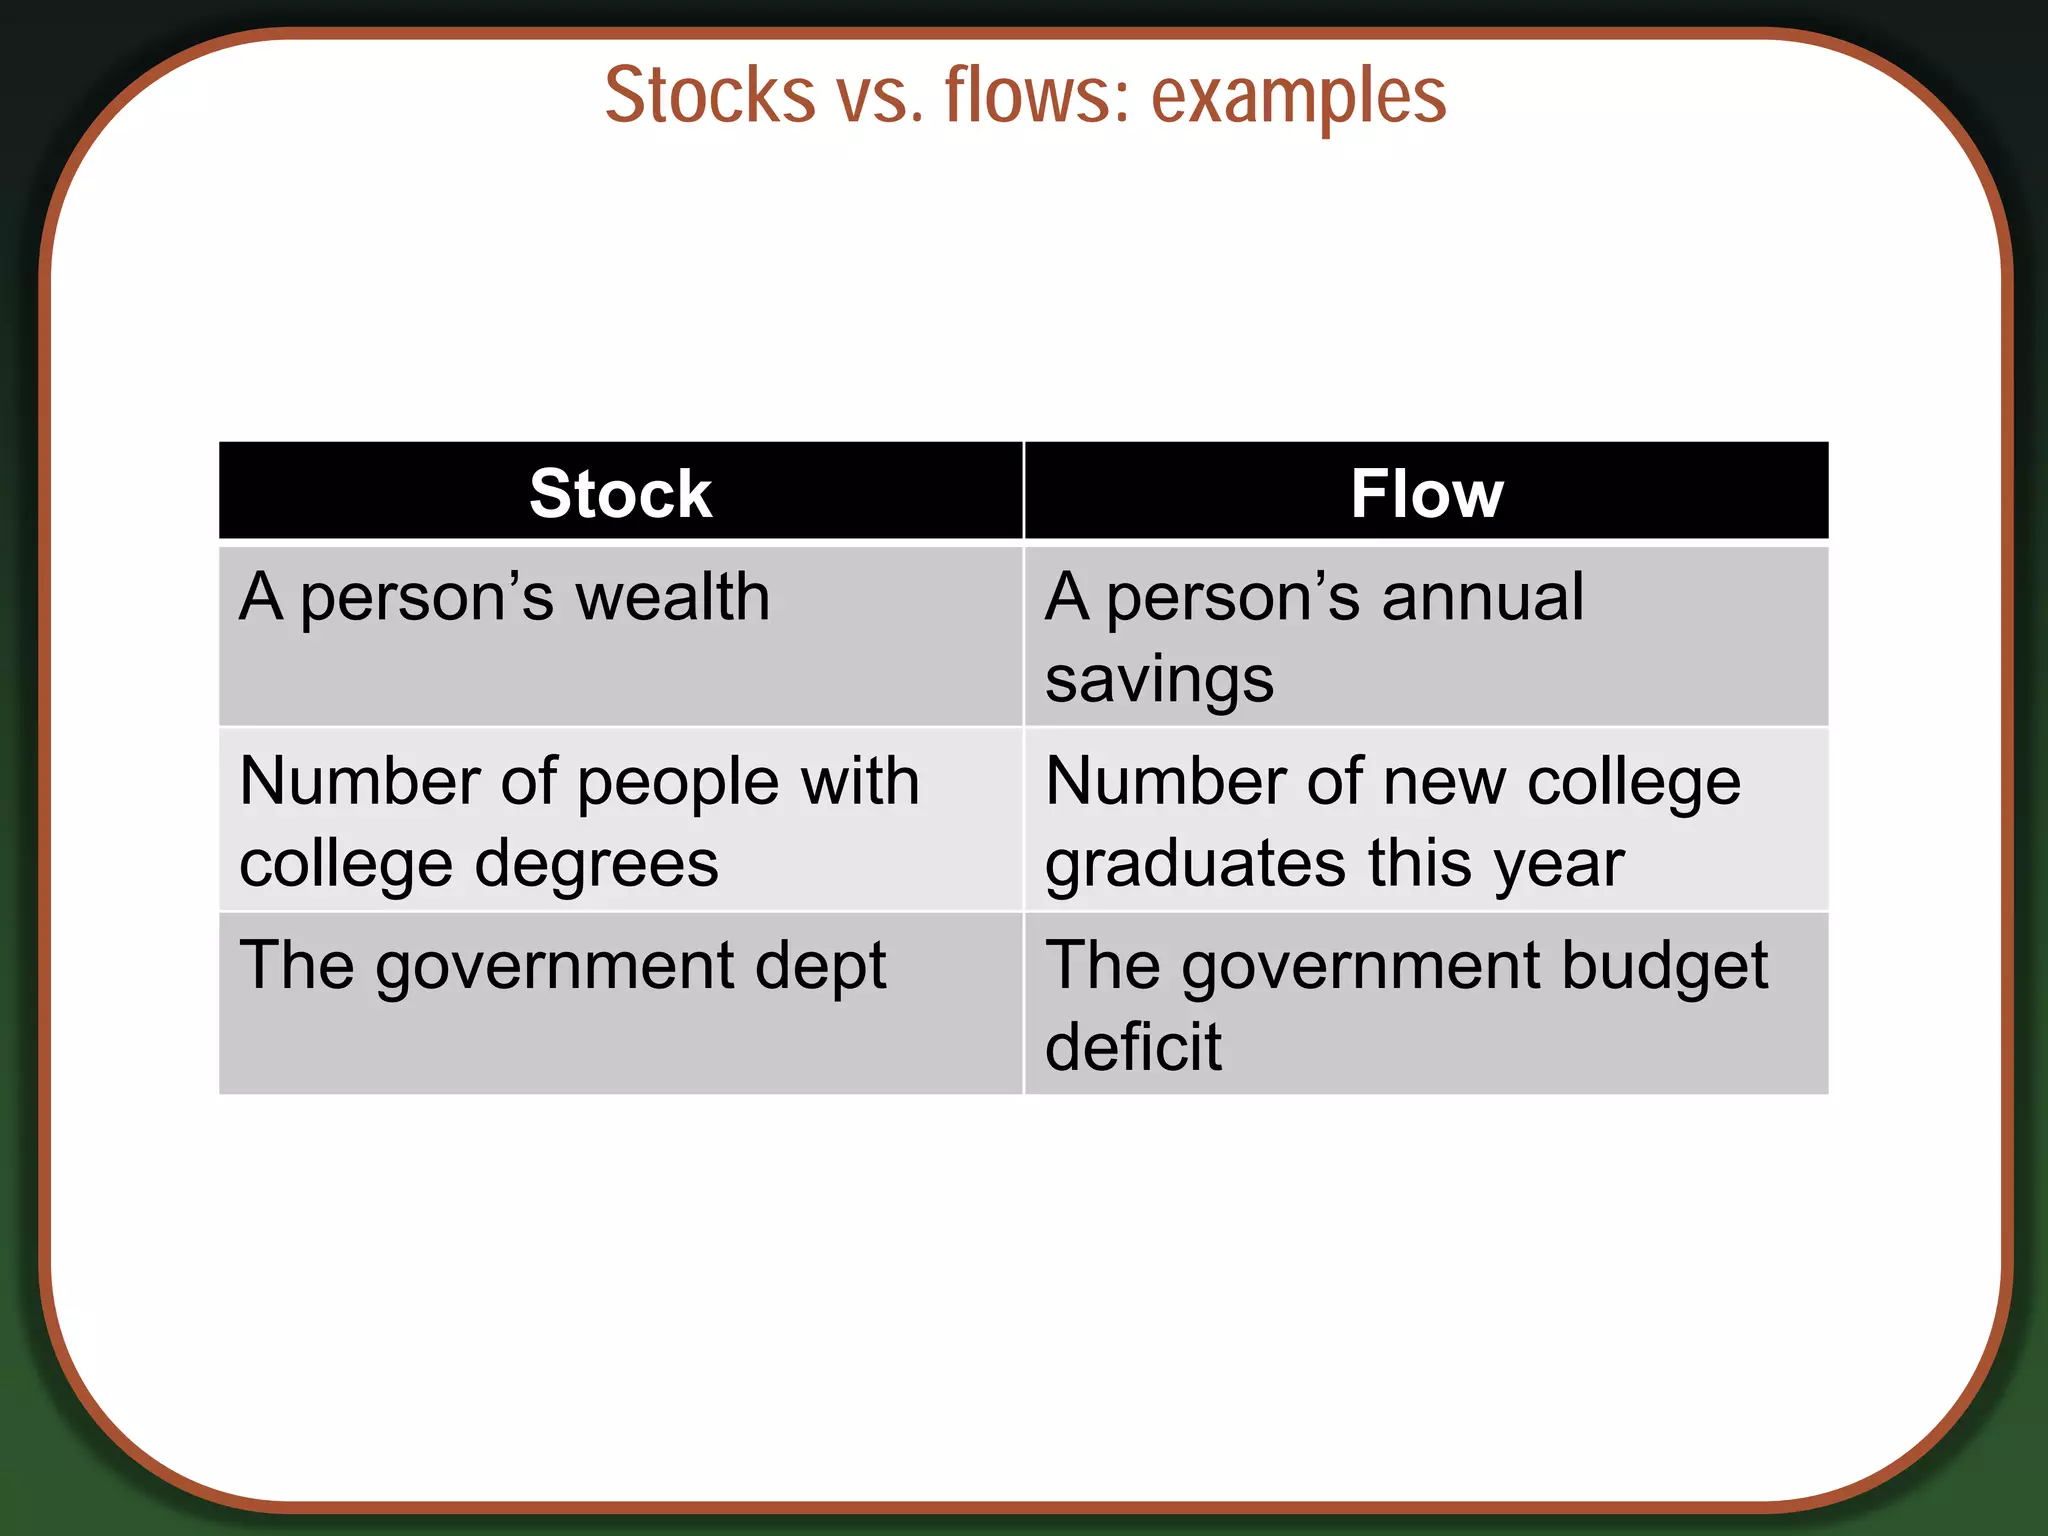
Stocks vs. flows:examples
Stock Flow
A person’s wealth A person’s annual
savings
Number of people with
college degrees
Number of new college
graduates this year
The government dept The government budget
deficit
21.
Investment vs. capital
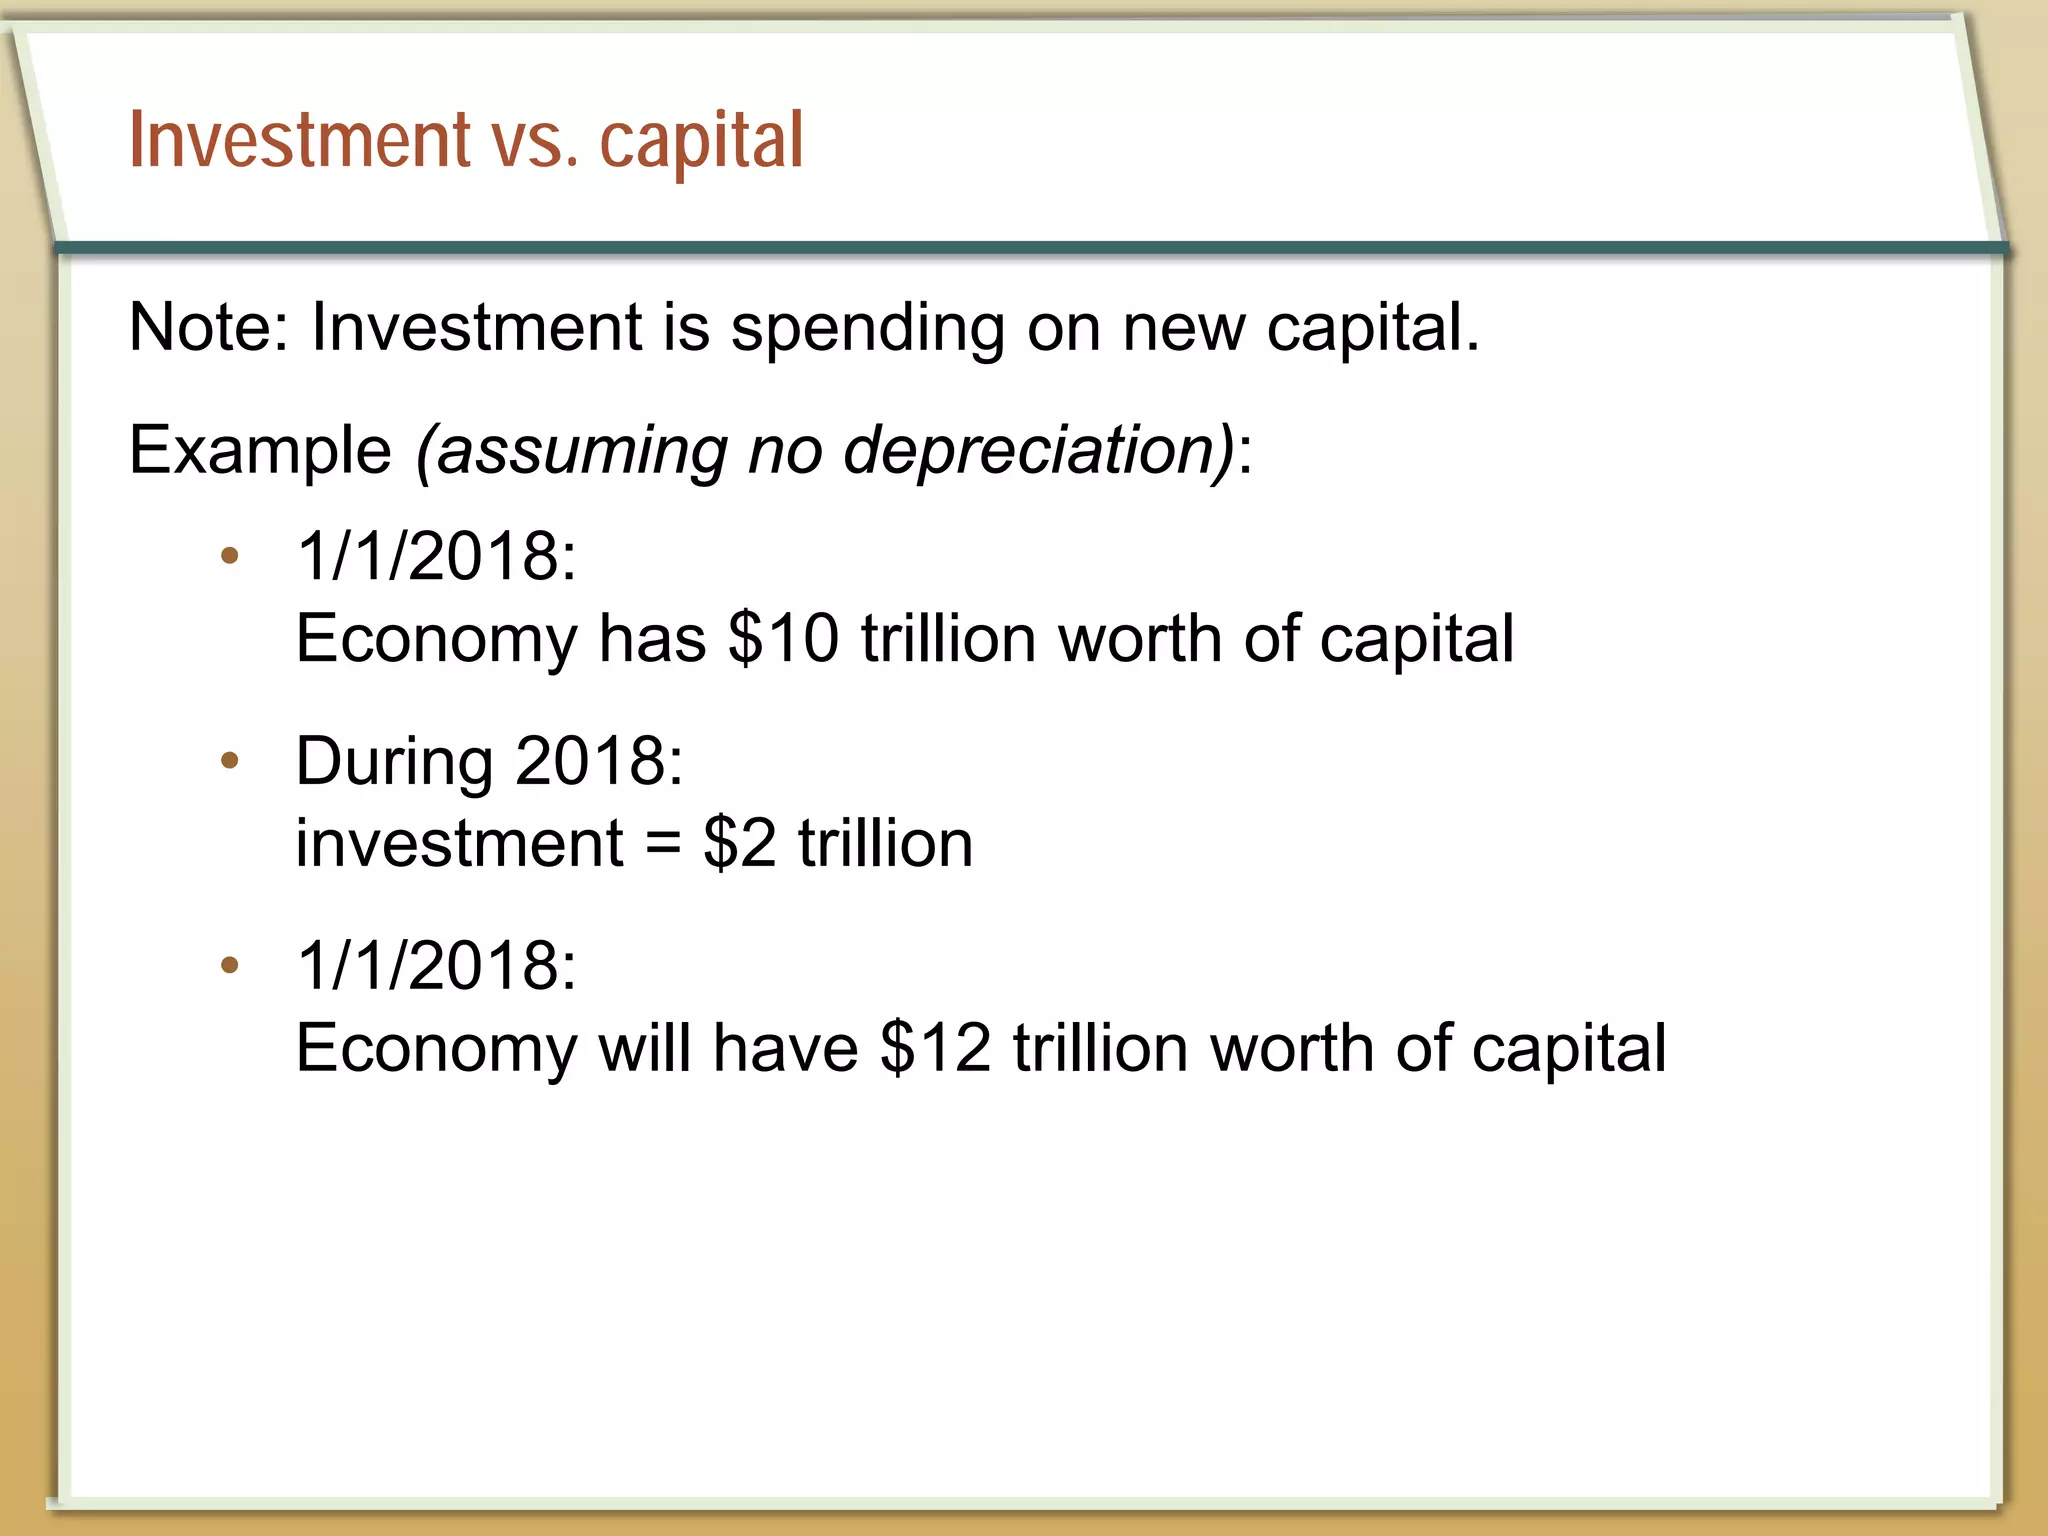
Note:Investment is spending on new capital.
Example (assuming no depreciation):
• 1/1/2018:
Economy has $10 trillion worth of capital
• During 2018:
investment = $2 trillion
• 1/1/2018:
Economy will have $12 trillion worth of capital
22.
NOW YOU TRY
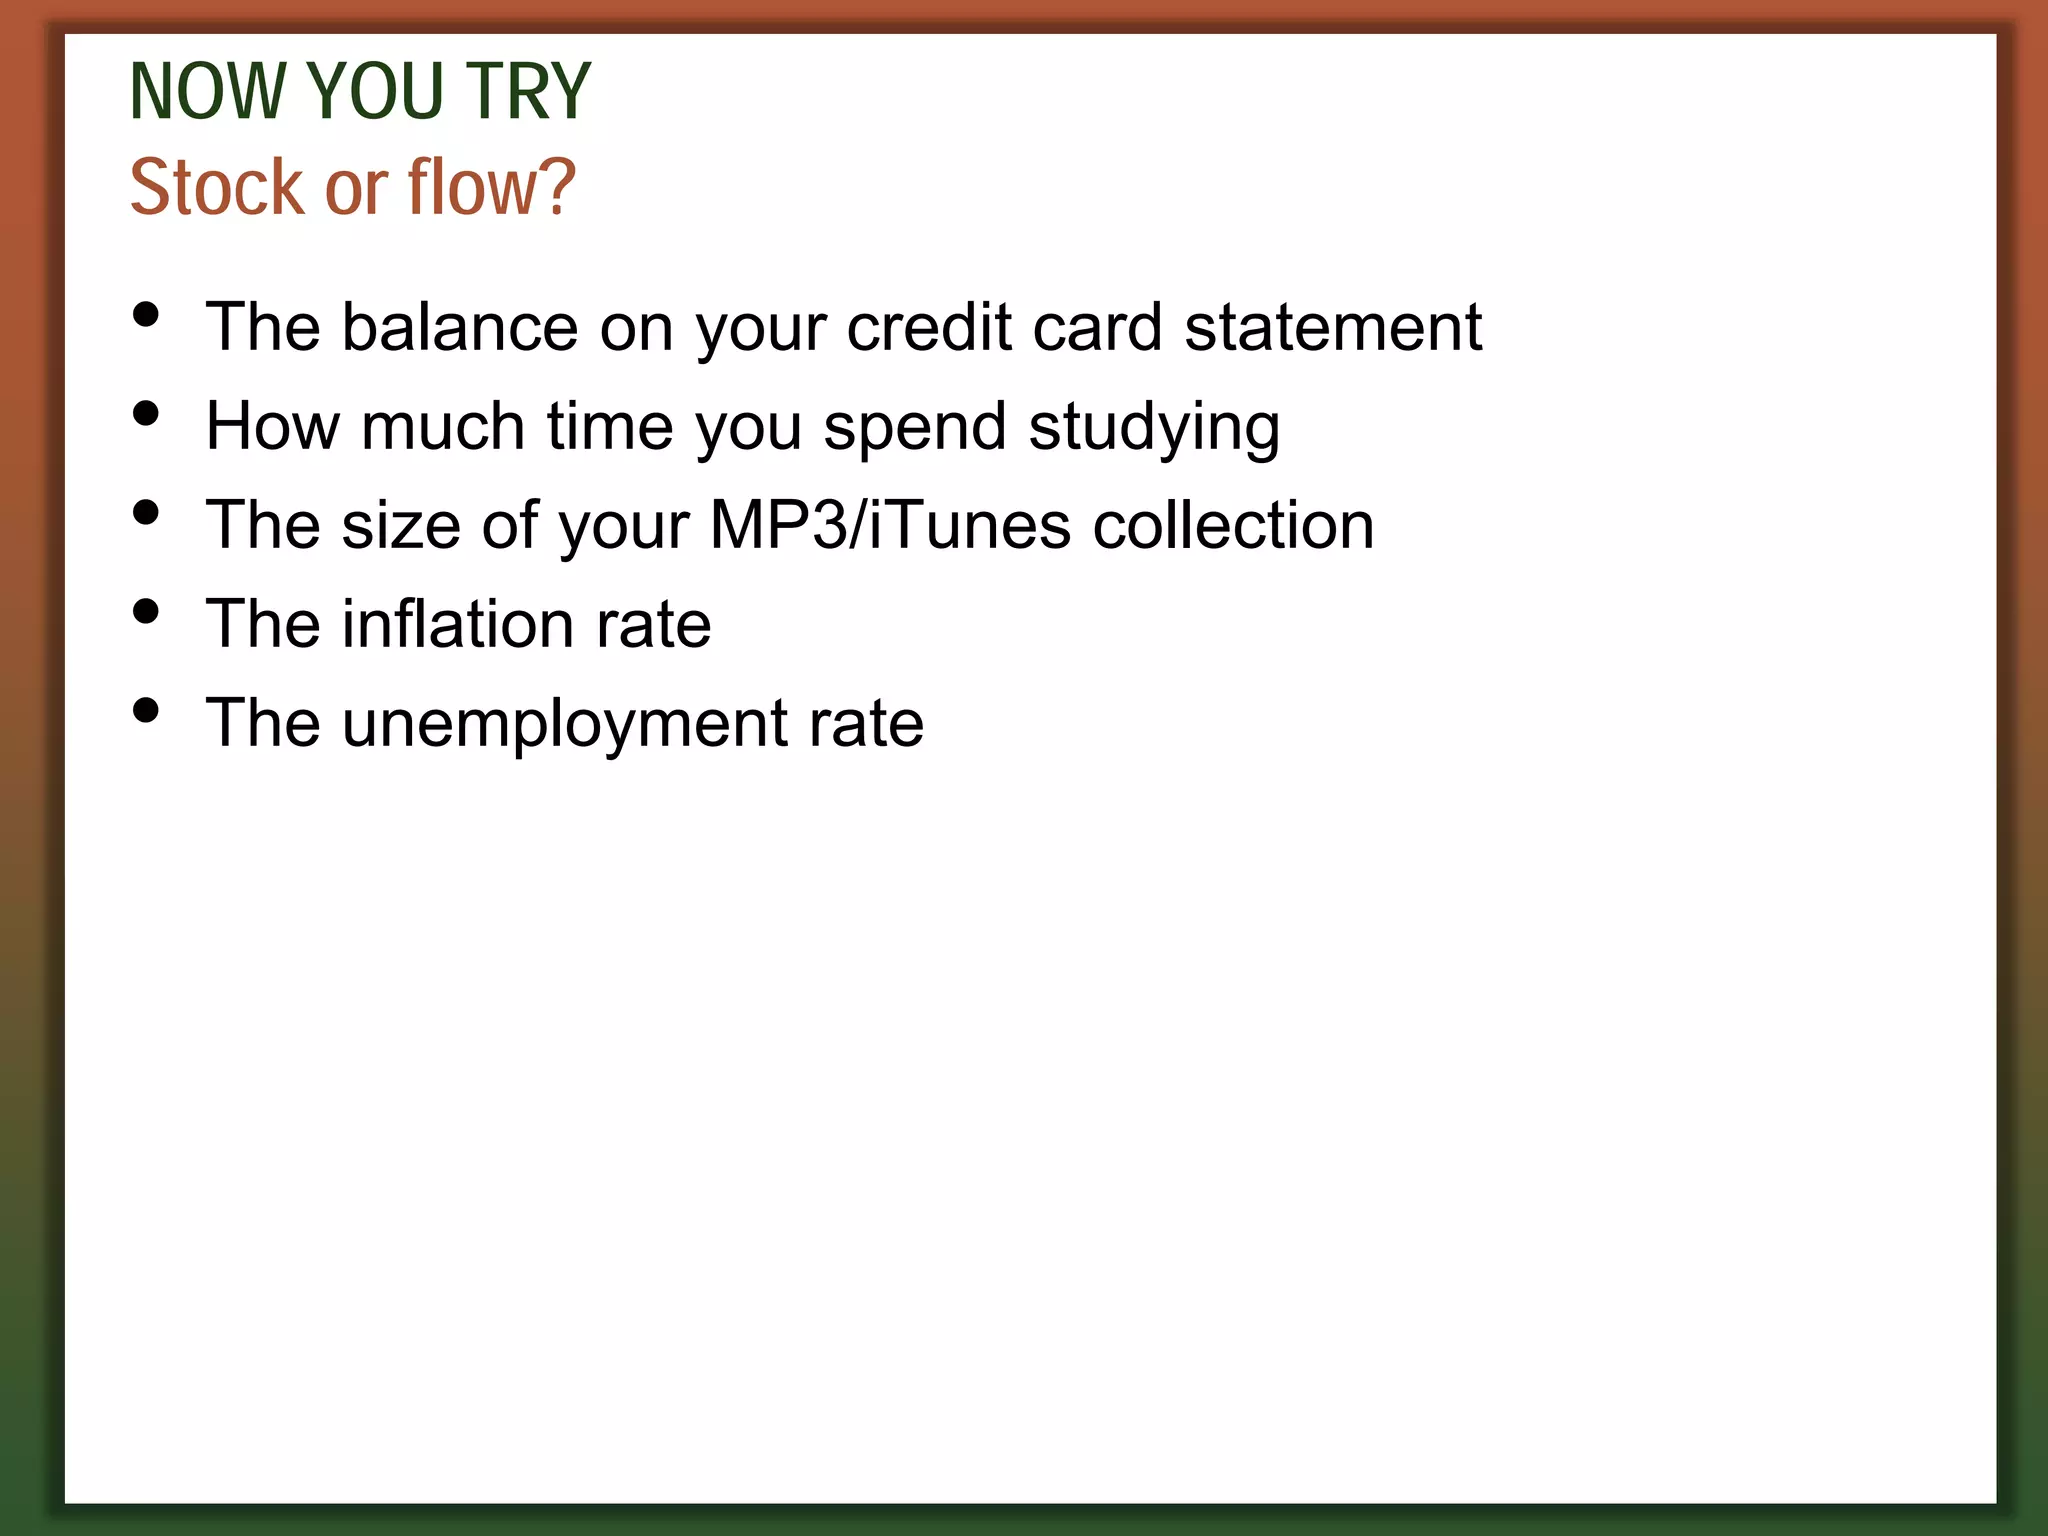
Stockor flow?
• The balance on your credit card statement
• How much time you spend studying
• The size of your MP3/iTunes collection
• The inflation rate
• The unemployment rate
23.
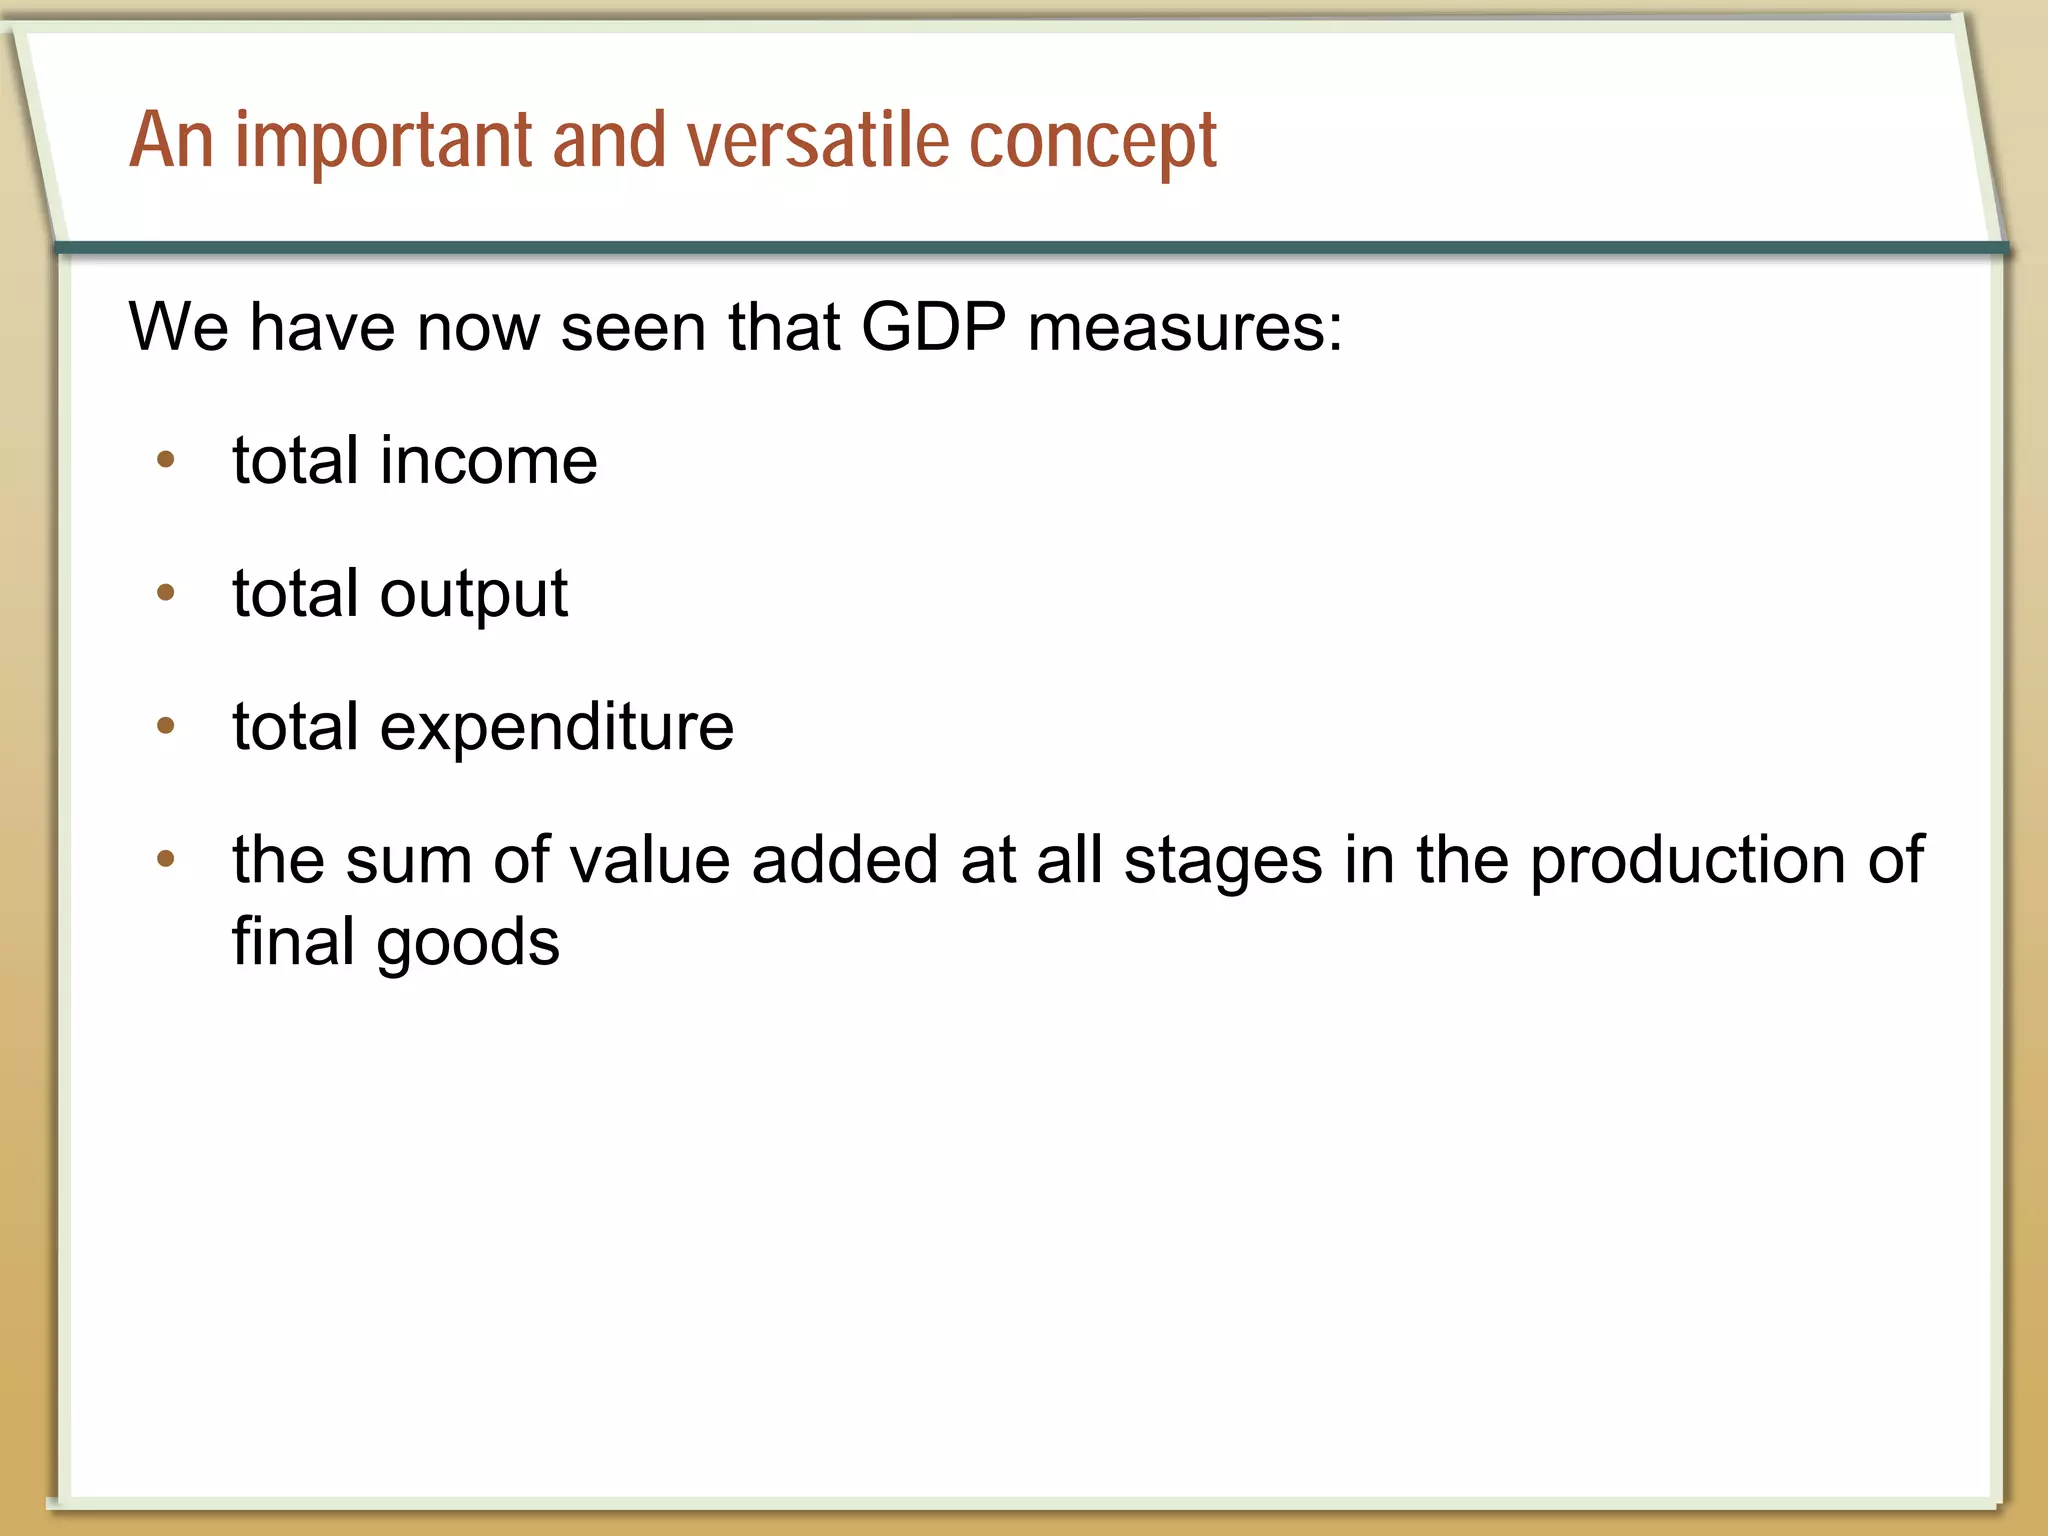
An important andversatile concept
We have now seen that GDP measures:
• total income
• total output
• total expenditure
• the sum of value added at all stages in the production of
final goods
24.
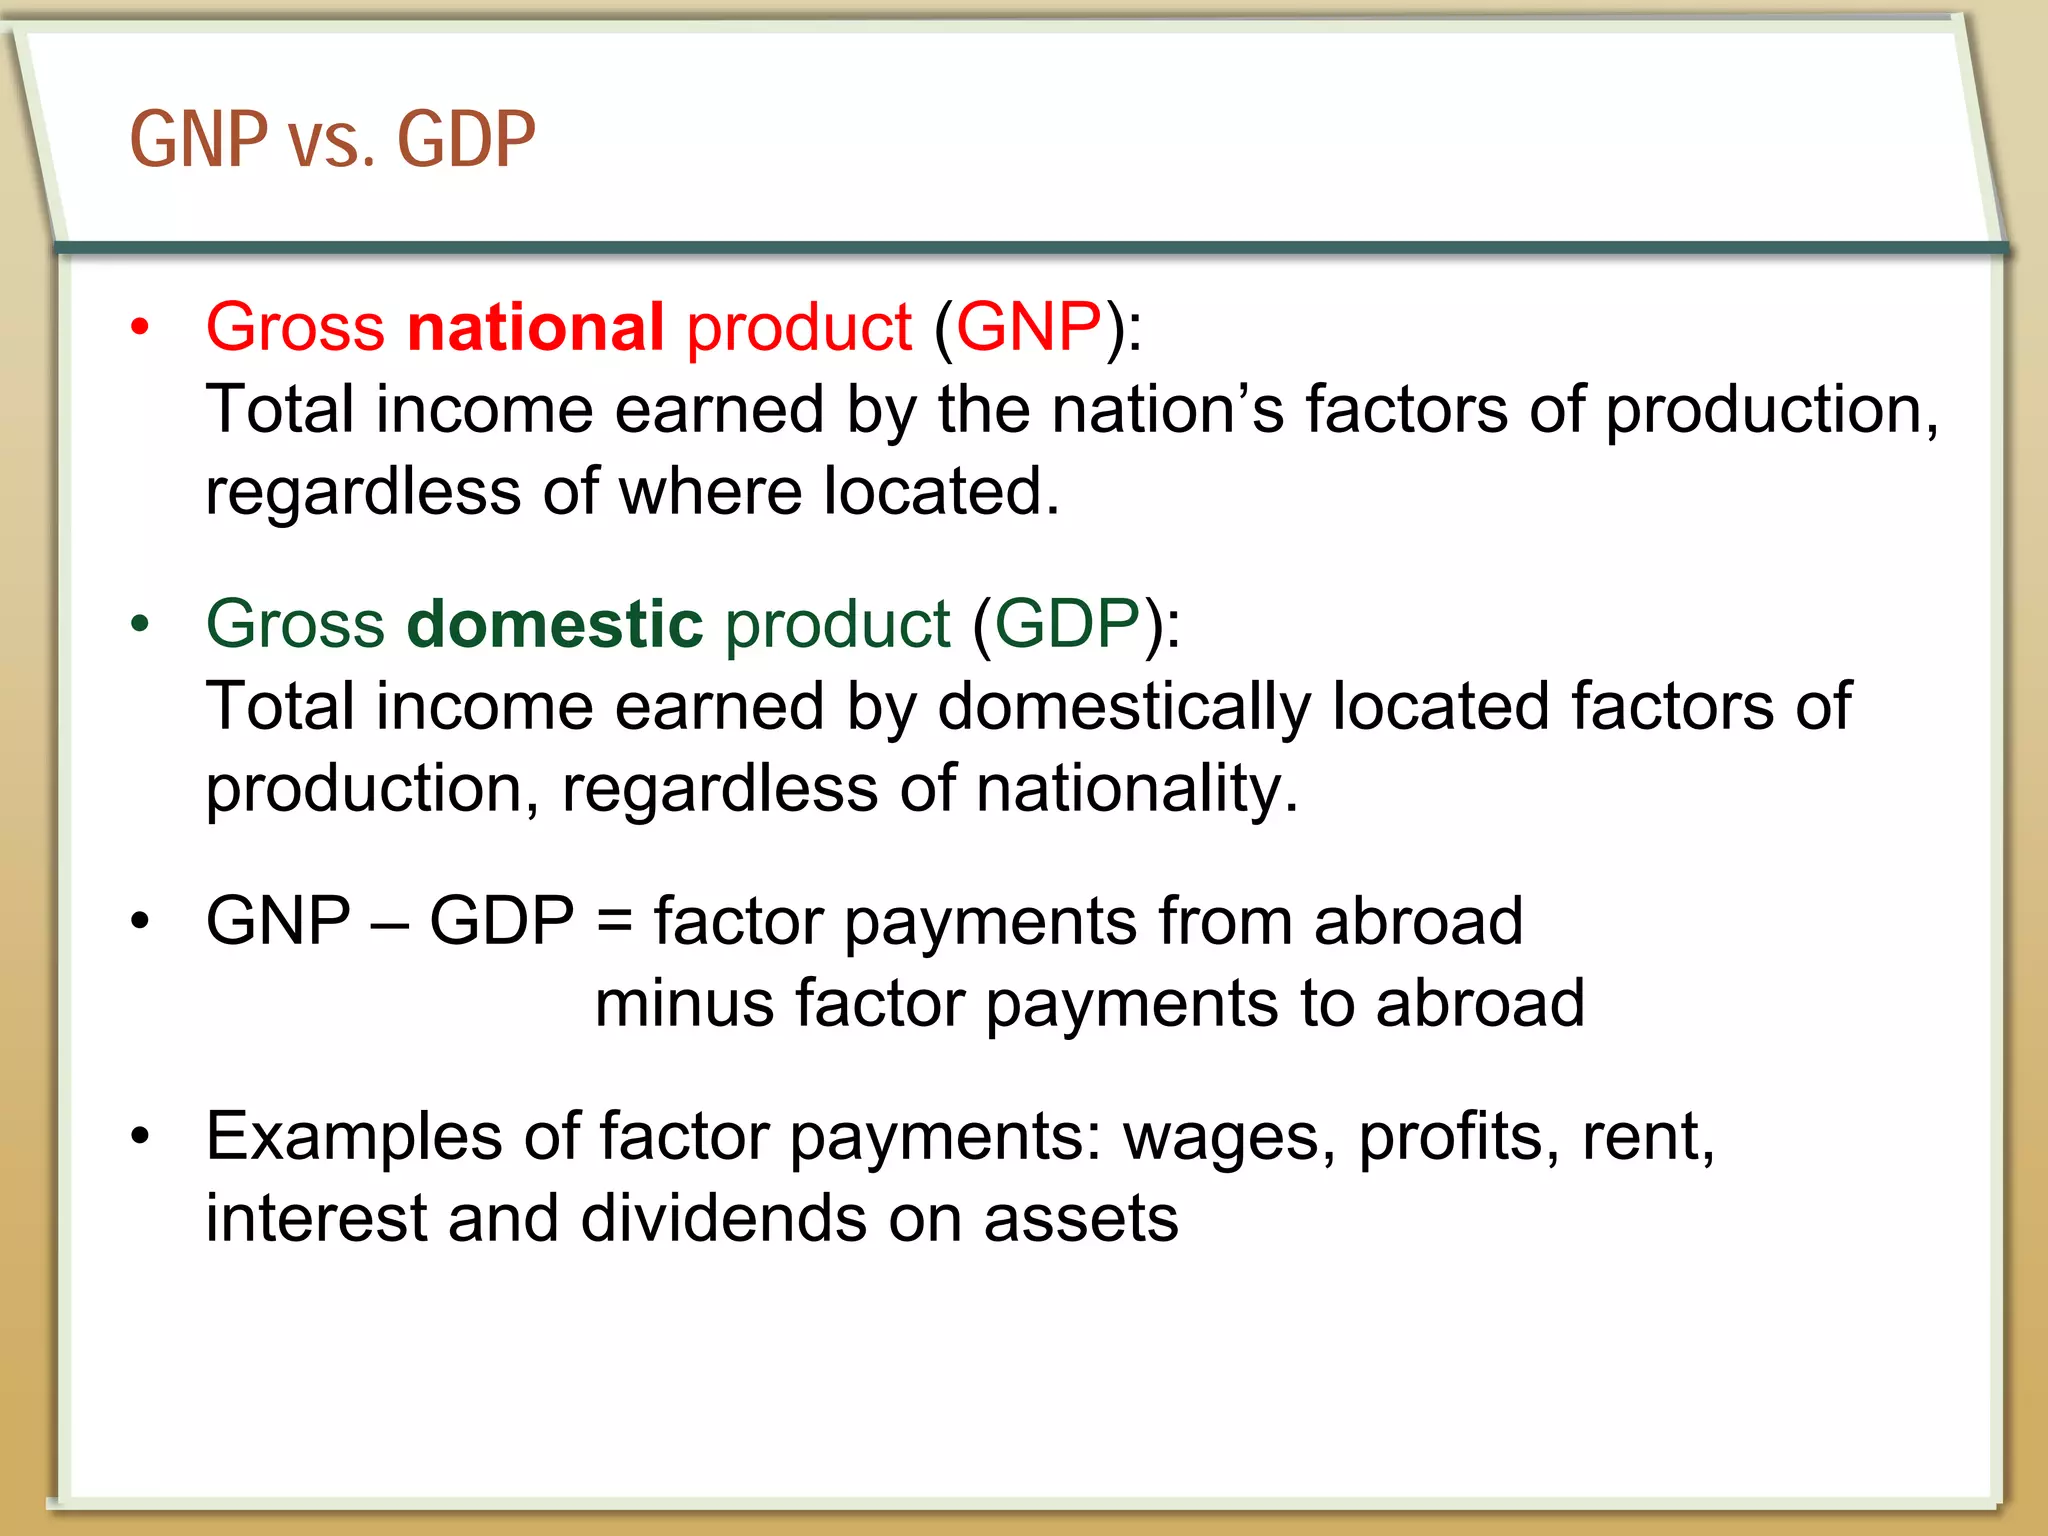
GNP vs. GDP
•Gross national product (GNP):
Total income earned by the nation’s factors of production,
regardless of where located.
• Gross domestic product (GDP):
Total income earned by domestically located factors of
production, regardless of nationality.
• GNP – GDP = factor payments from abroad
minus factor payments to abroad
• Examples of factor payments: wages, profits, rent,
interest and dividends on assets
25.
NOW YOU TRY
Discussionquestion
In your country,
which would you
want to be bigger:
GDP or GNP?
Why?
26.
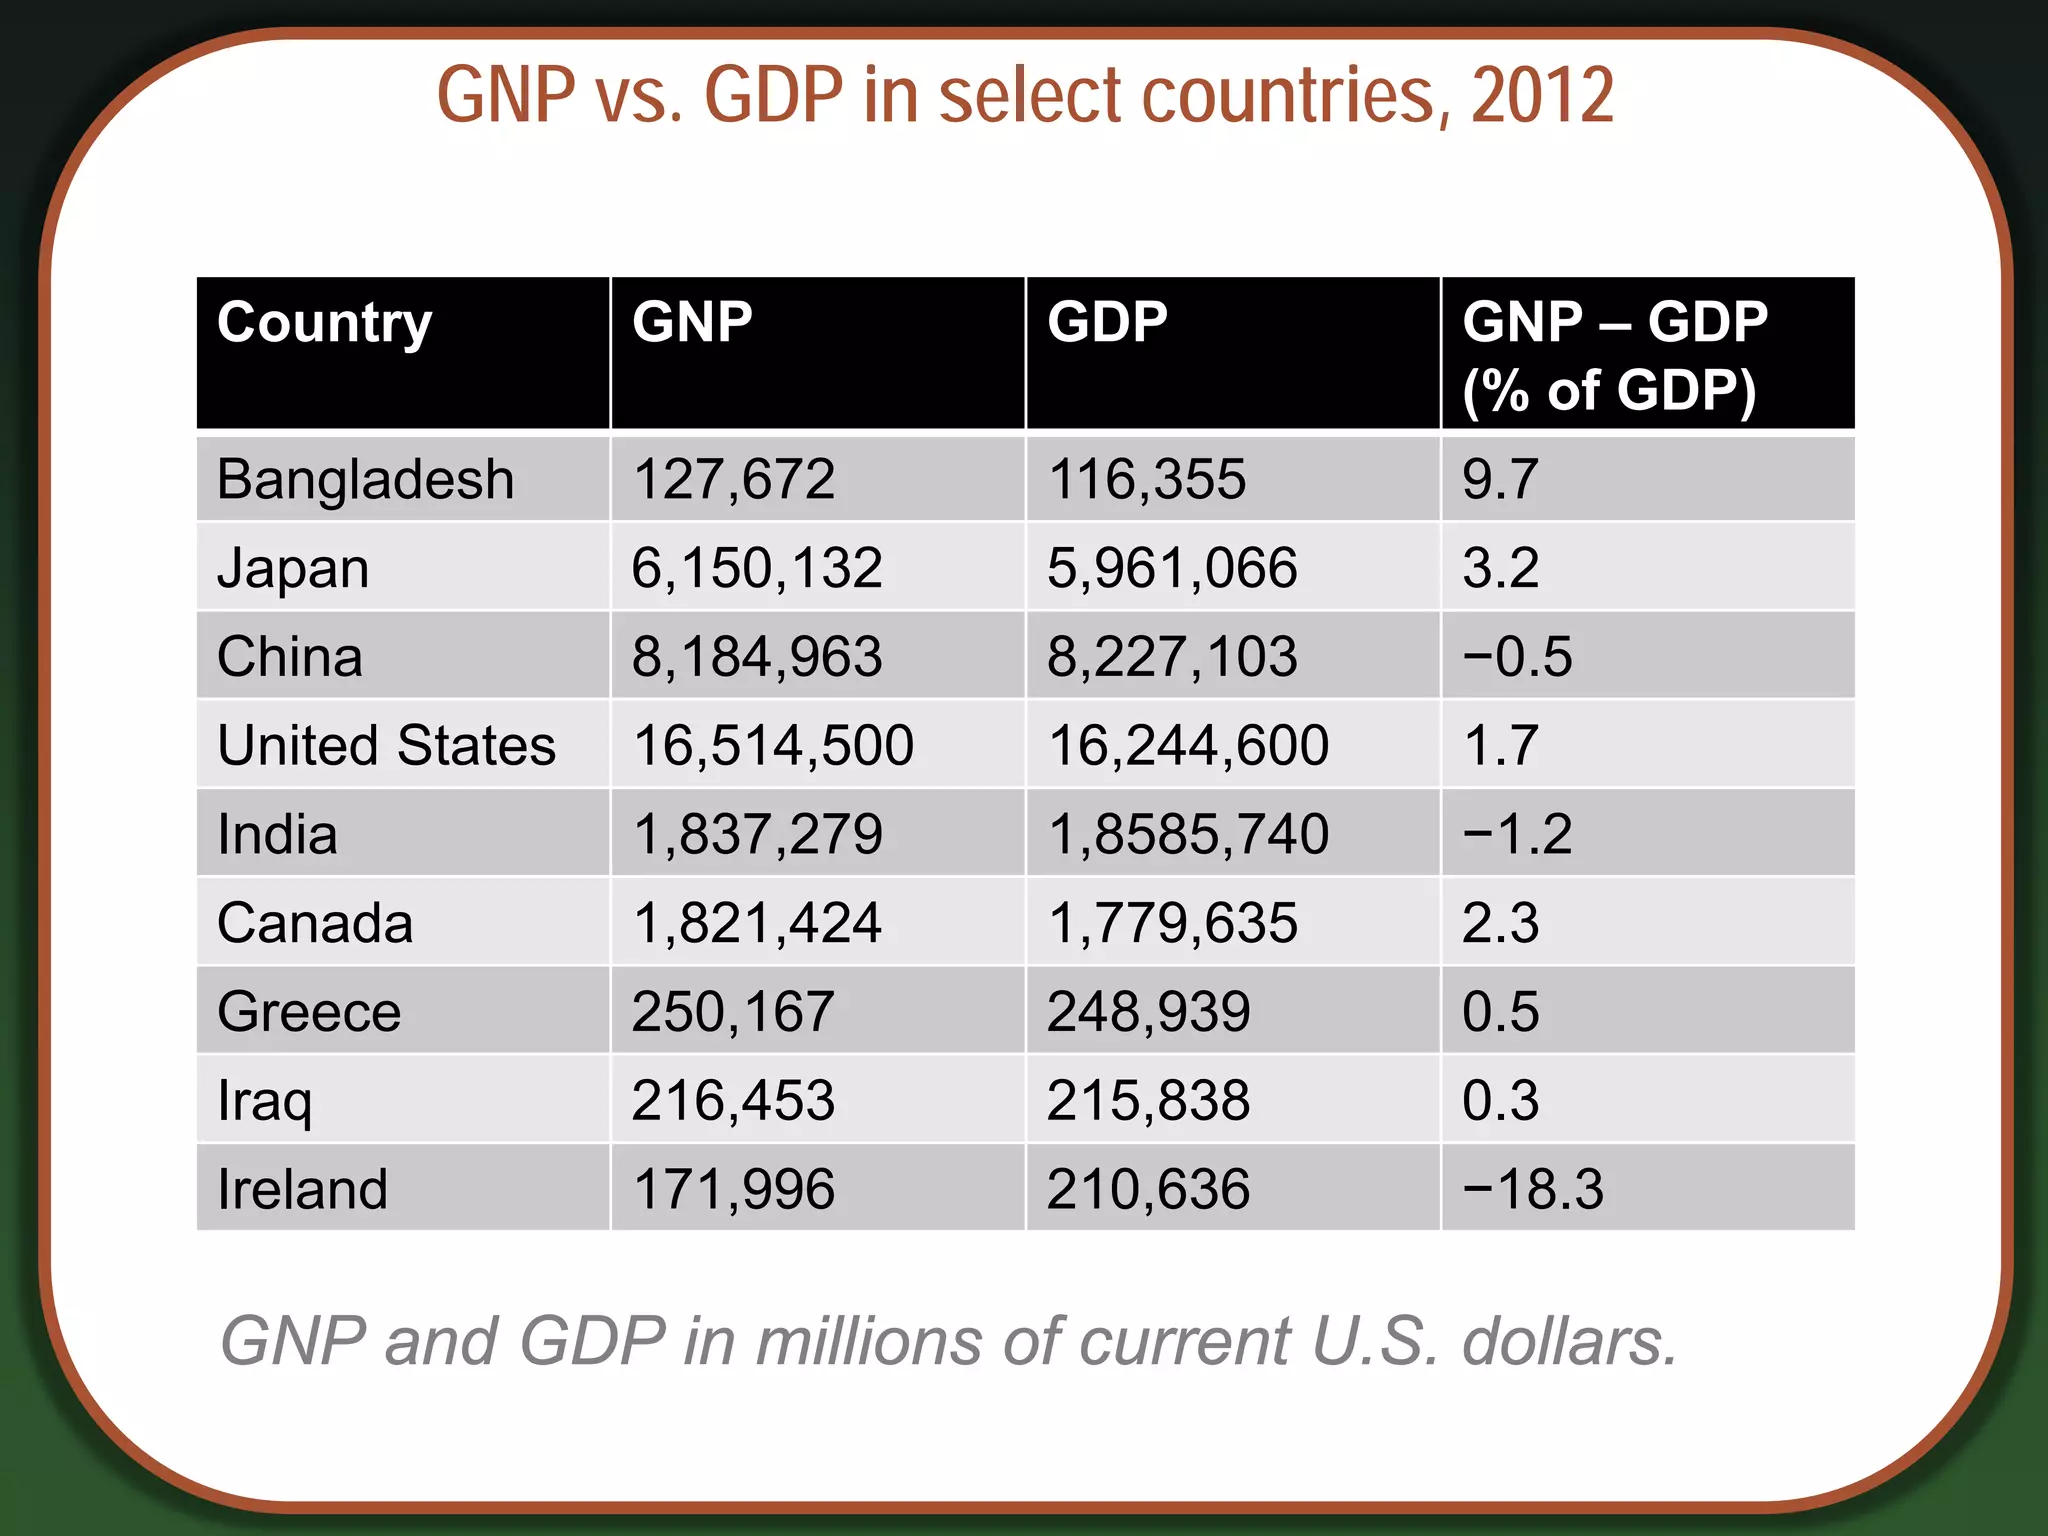
GNP vs. GDPin select countries, 2012
Country GNP GDP GNP – GDP
(% of GDP)
Bangladesh 127,672 116,355 9.7
Japan 6,150,132 5,961,066 3.2
China 8,184,963 8,227,103 −0.5
United States 16,514,500 16,244,600 1.7
India 1,837,279 1,8585,740 −1.2
Canada 1,821,424 1,779,635 2.3
Greece 250,167 248,939 0.5
Iraq 216,453 215,838 0.3
Ireland 171,996 210,636 −18.3
GNP and GDP in millions of current U.S. dollars.
27.
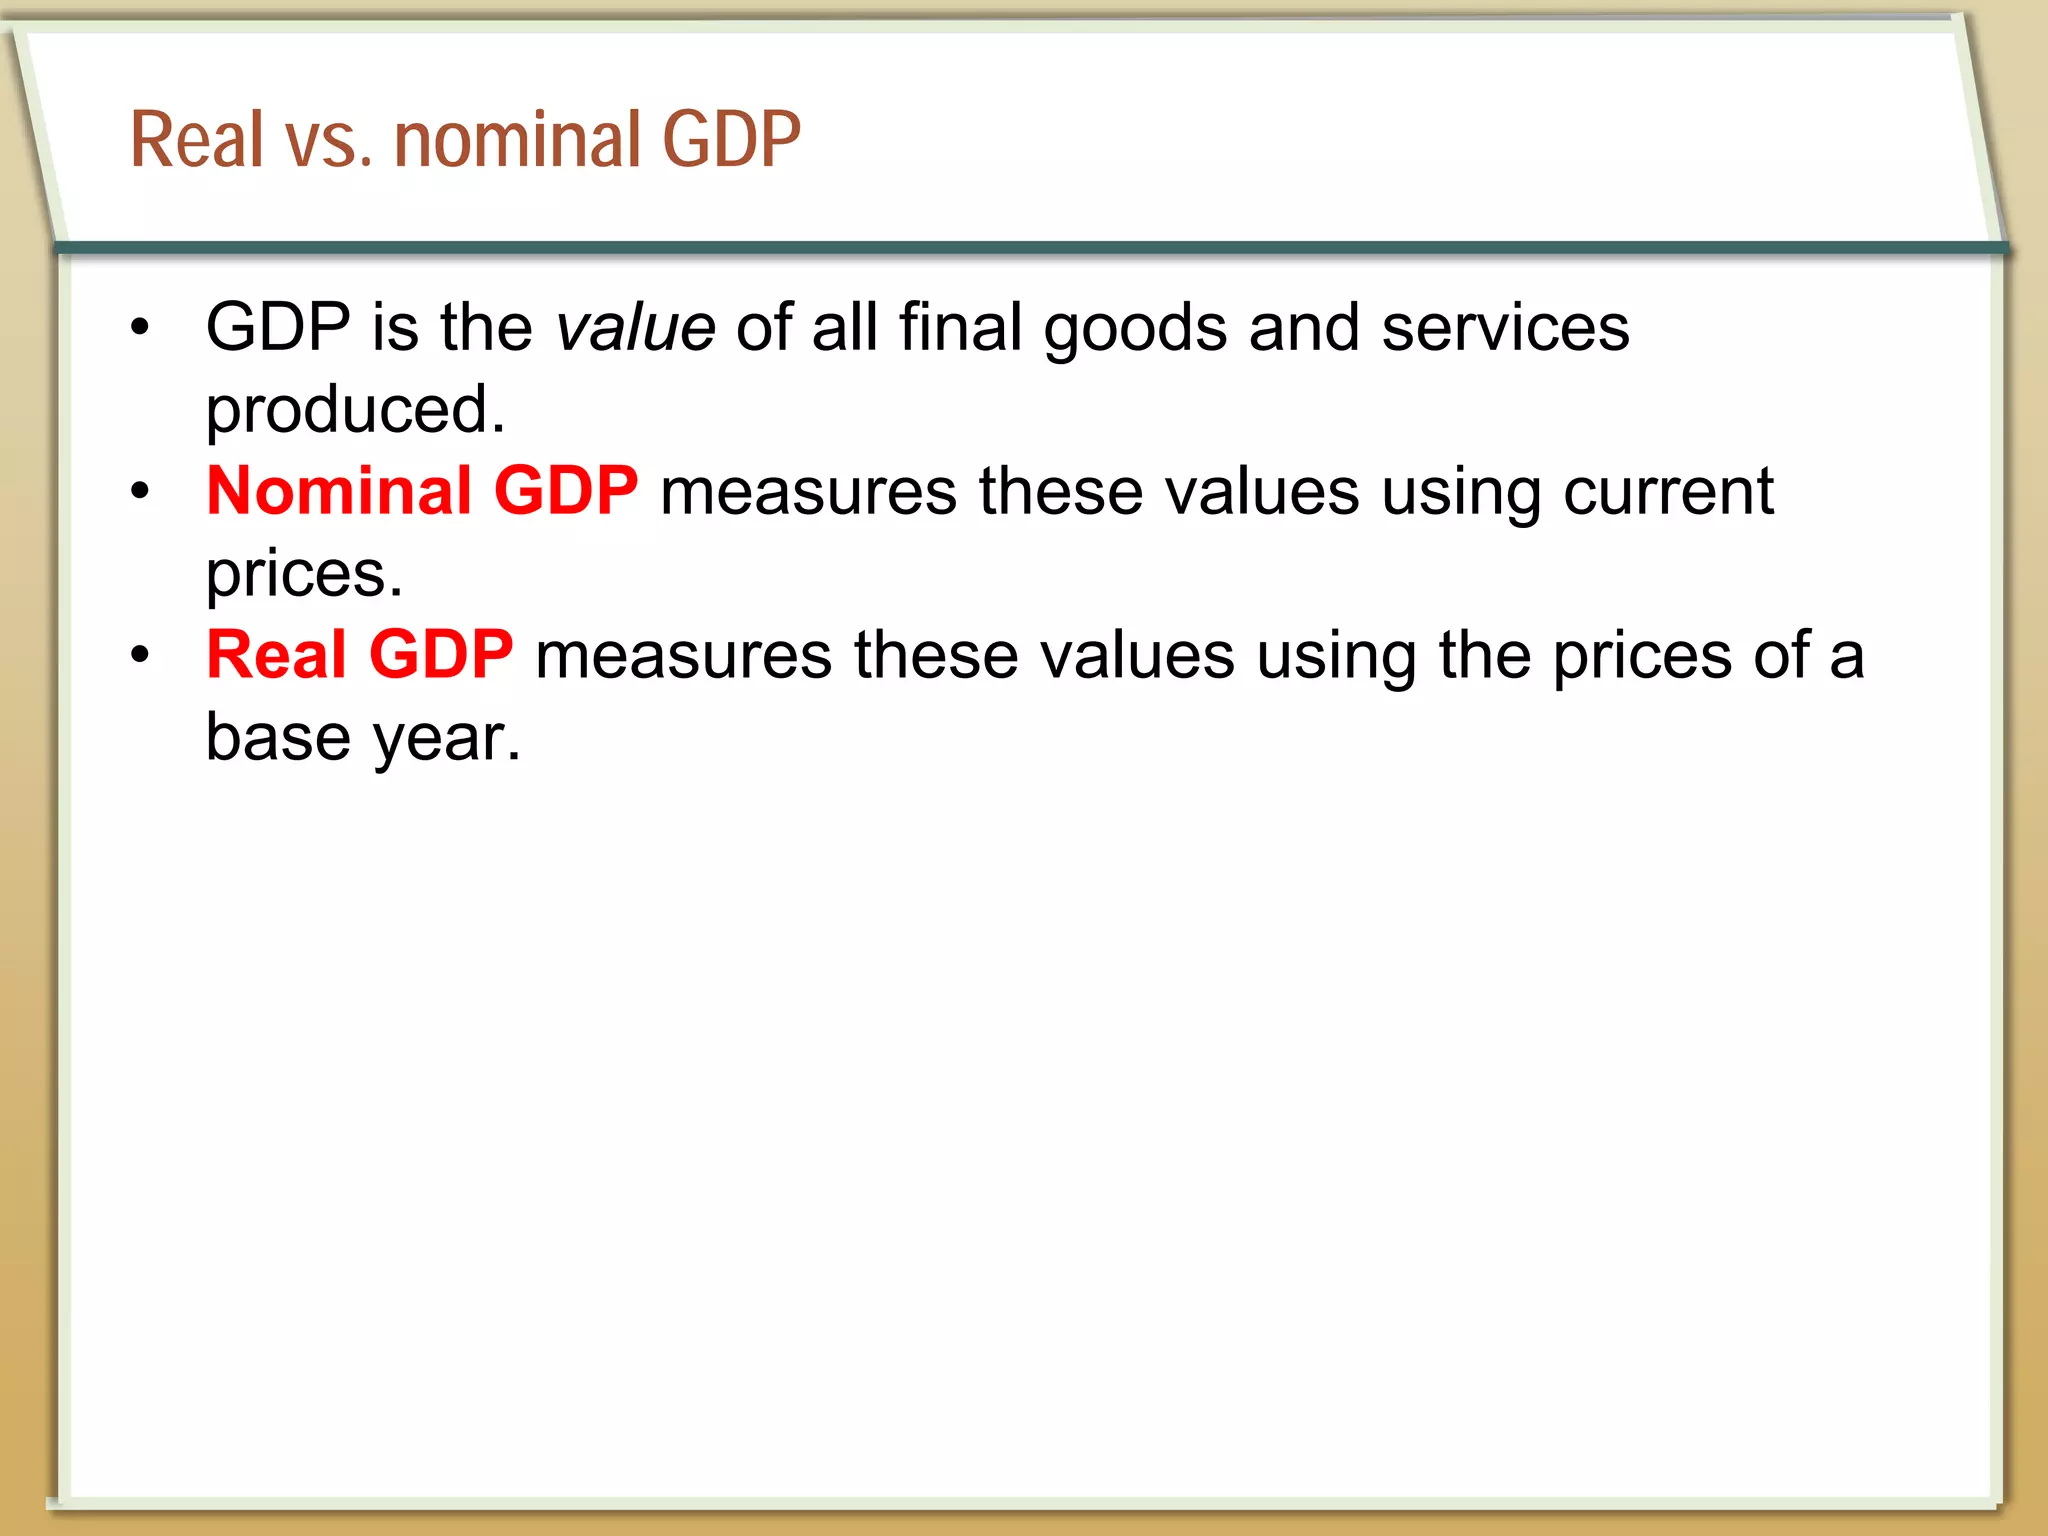
Real vs. nominalGDP
• GDP is the value of all final goods and services
produced.
• Nominal GDP measures these values using current
prices.
• Real GDP measures these values using the prices of a
base year.
28.
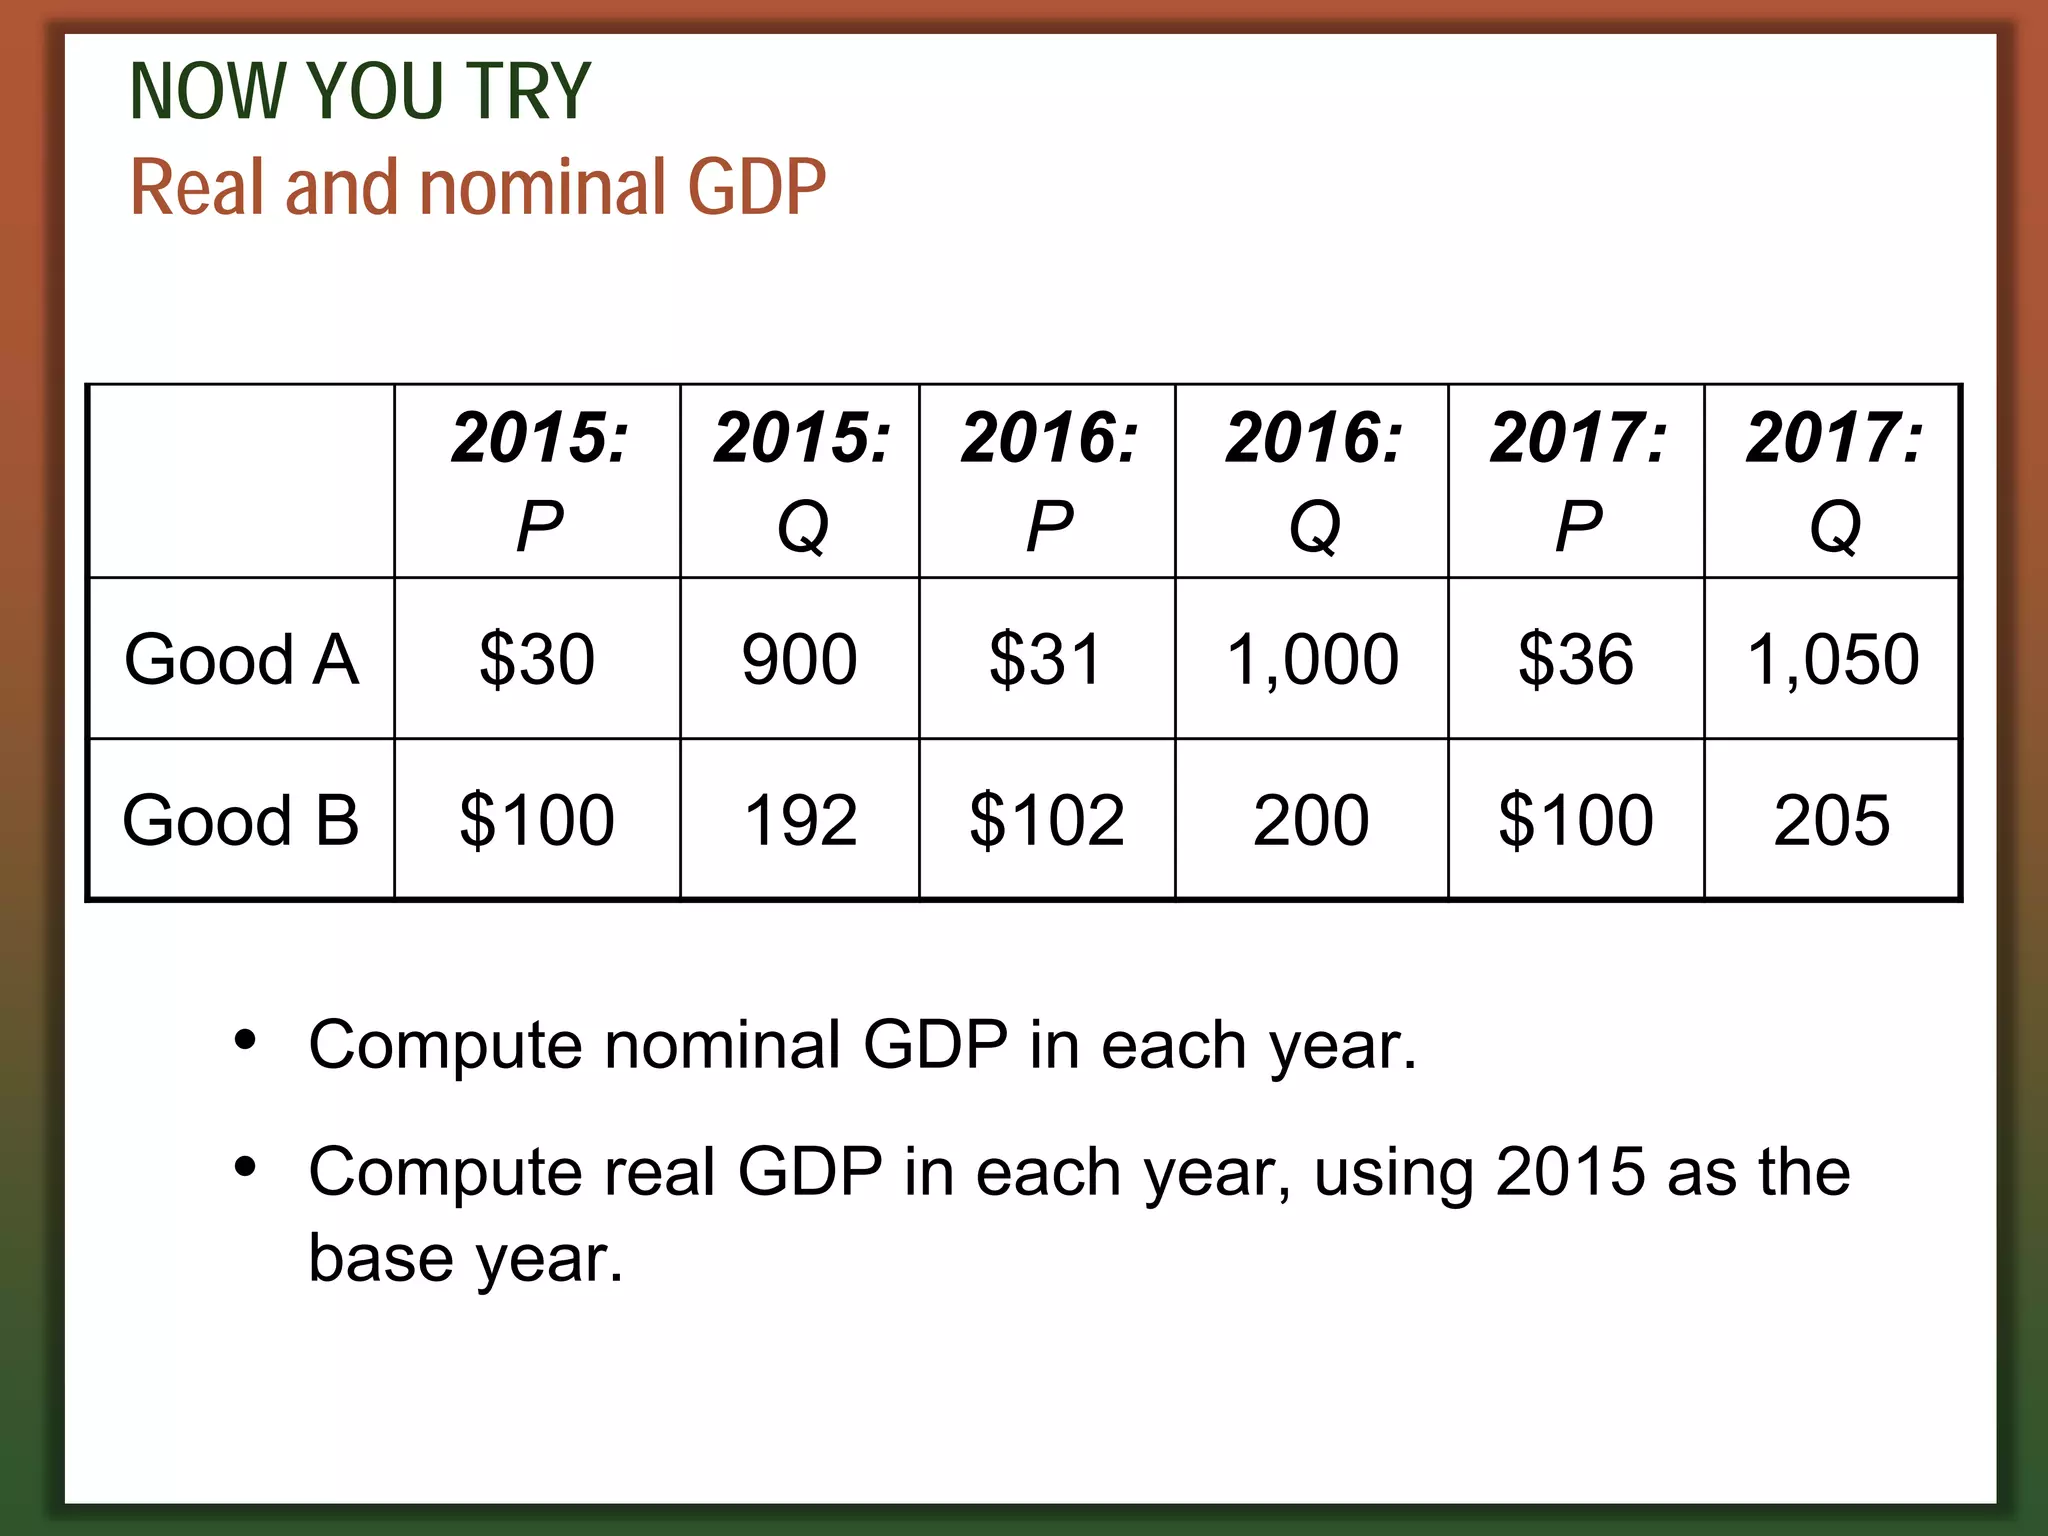
NOW YOU TRY
Realand nominal GDP
2015:
P
2015:
Q
2016:
P
2016:
Q
2017:
P
2017:
Q
Good A $30 900 $31 1,000 $36 1,050
Good B $100 192 $102 200 $100 205
• Compute nominal GDP in each year.
• Compute real GDP in each year, using 2015 as the
base year.
29.
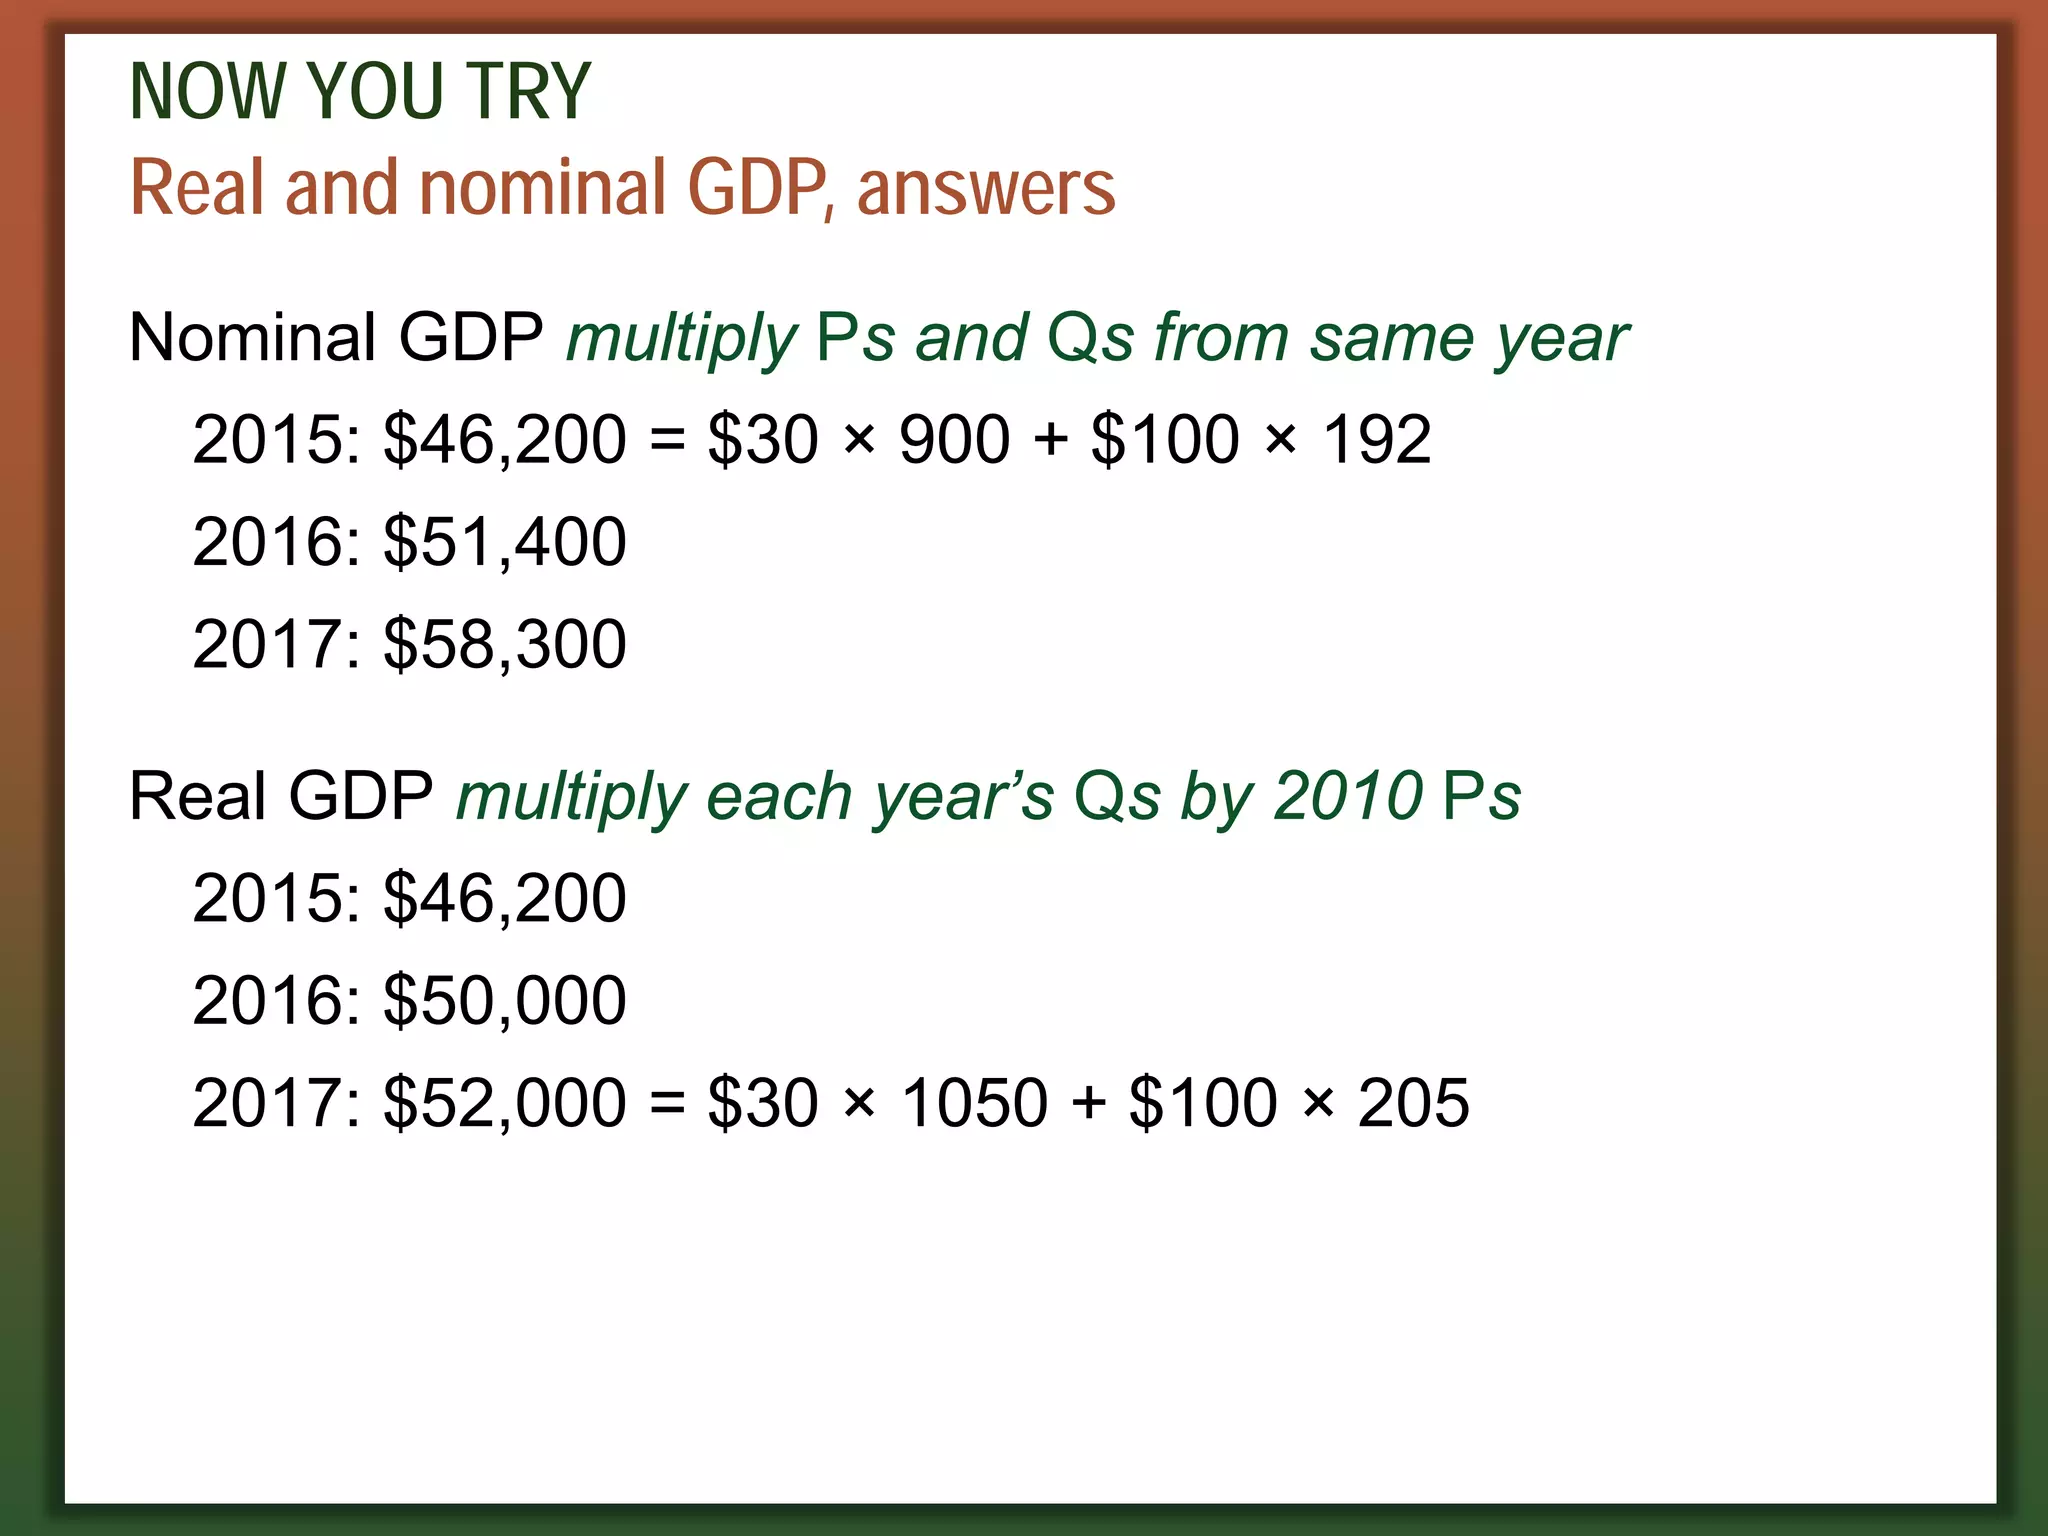
NOW YOU TRY
Realand nominal GDP, answers
Nominal GDP multiply Ps and Qs from same year
2015: $46,200 = $30 × 900 + $100 × 192
2016: $51,400
2017: $58,300
Real GDP multiply each year’s Qs by 2010 Ps
2015: $46,200
2016: $50,000
2017: $52,000 = $30 × 1050 + $100 × 205
30.
Real GDP controlsfor inflation
• Changes in nominal GDP can be due to:
• changes in prices
• changes in quantities of output produced
• Changes in real GDP can only be due to changes in
quantities because real GDP is constructed using
constant base-year prices.
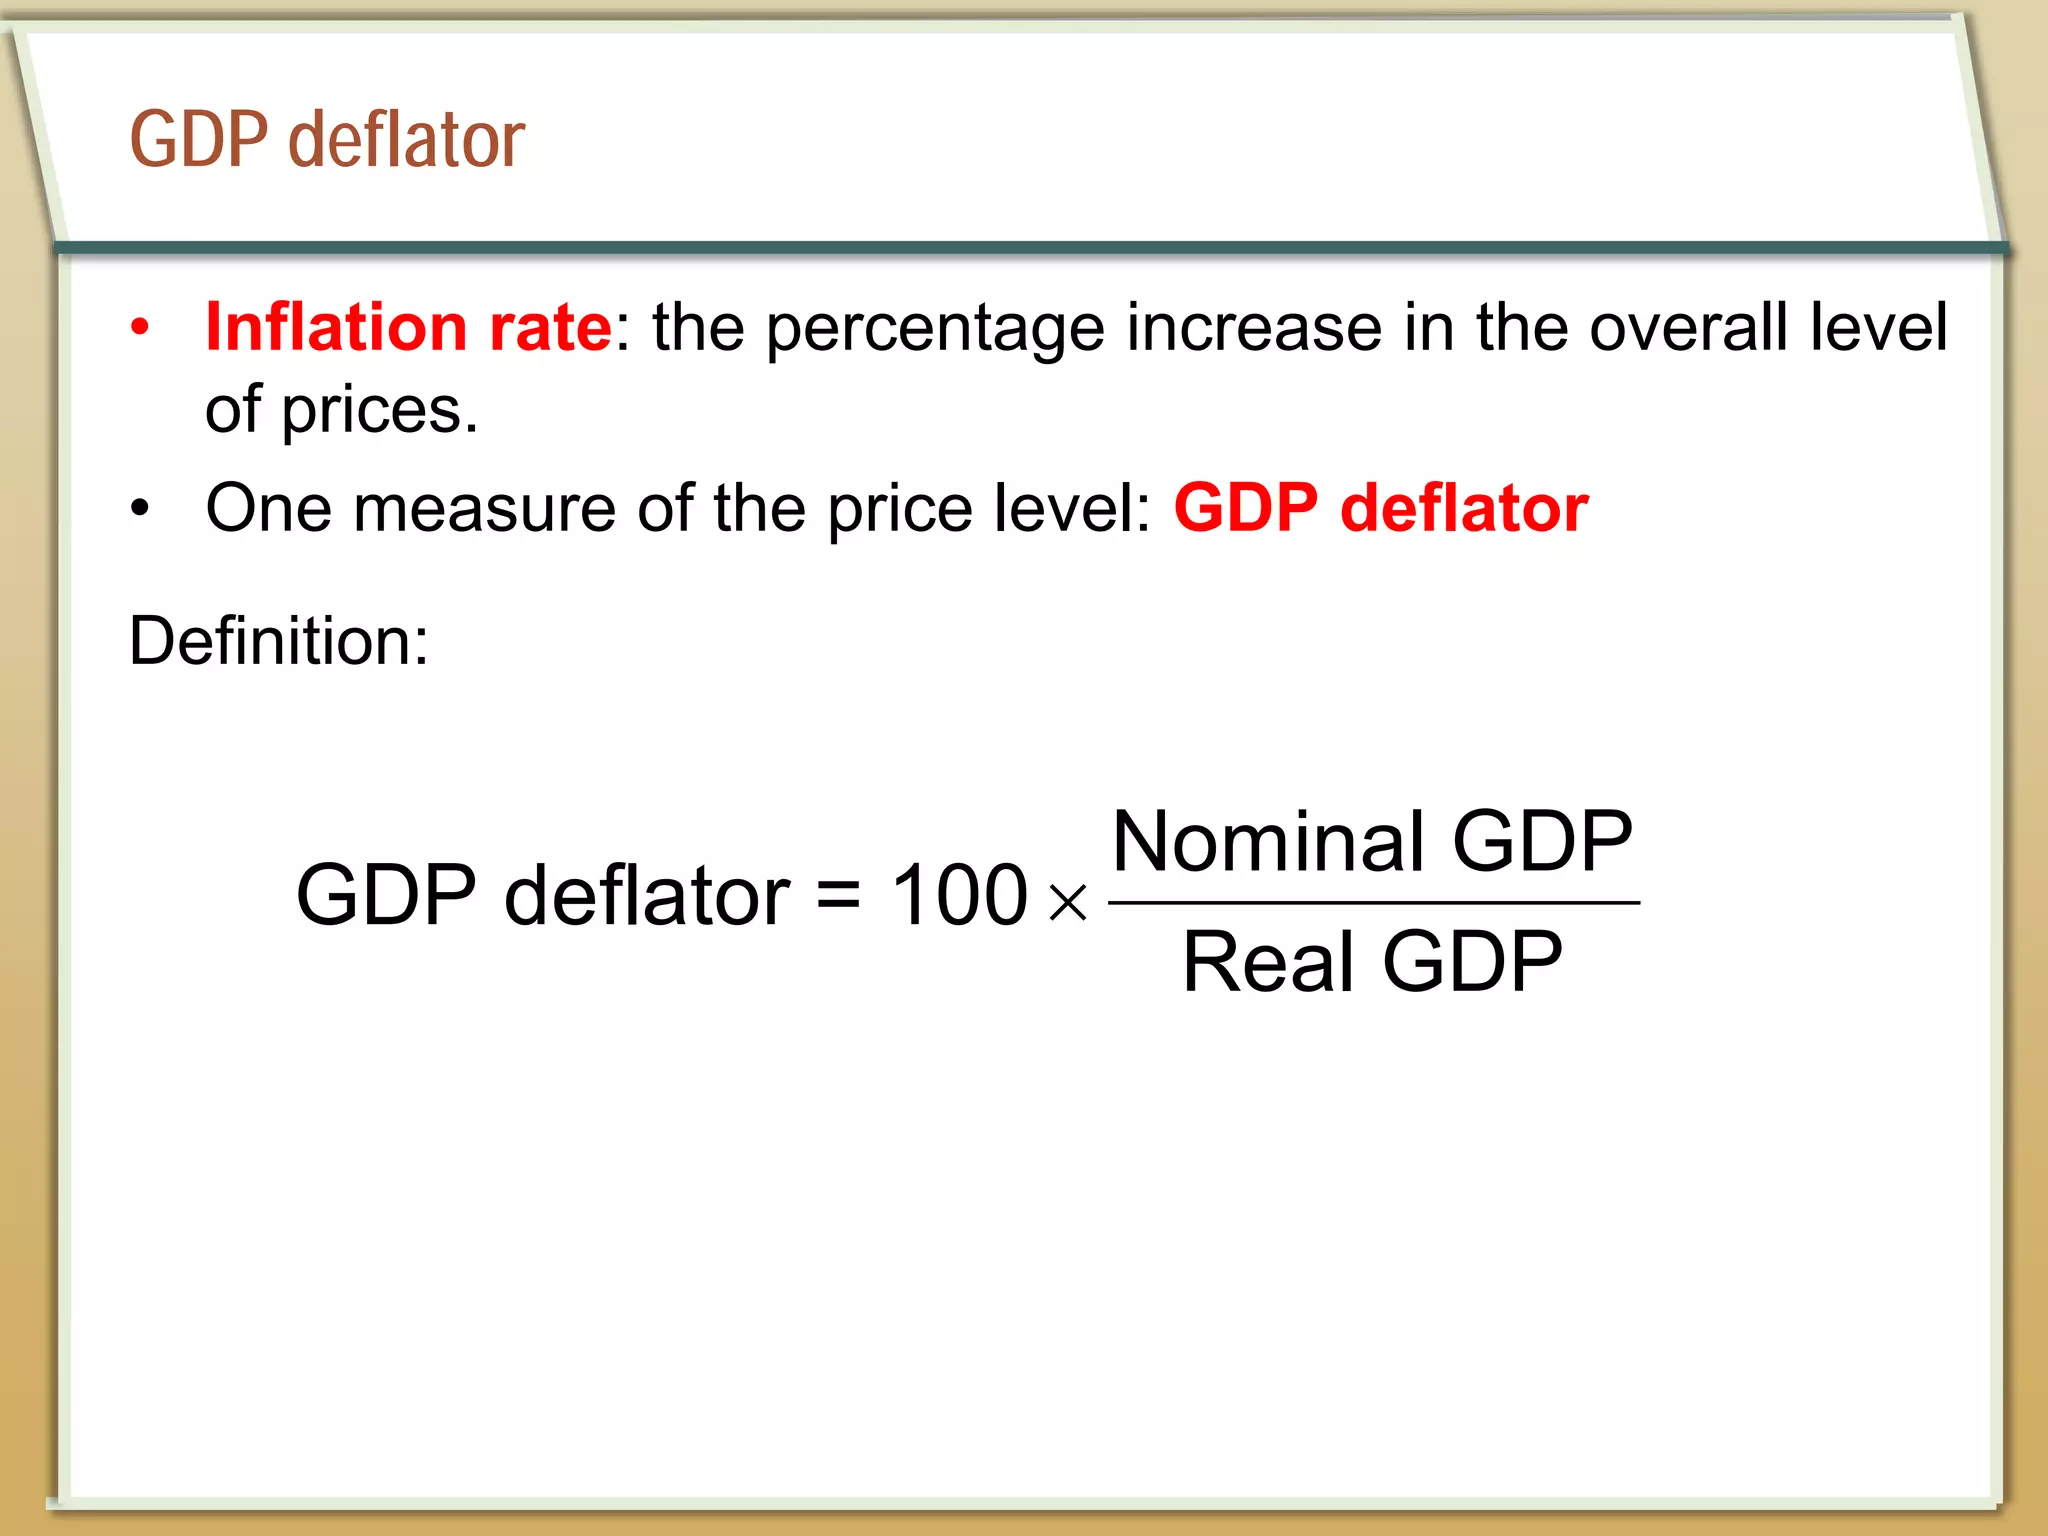
GDP deflator
• Inflationrate: the percentage increase in the overall level
of prices.
• One measure of the price level: GDP deflator
Definition:
×
Nominal GDP
GDP deflator = 100
Real GDP
33.
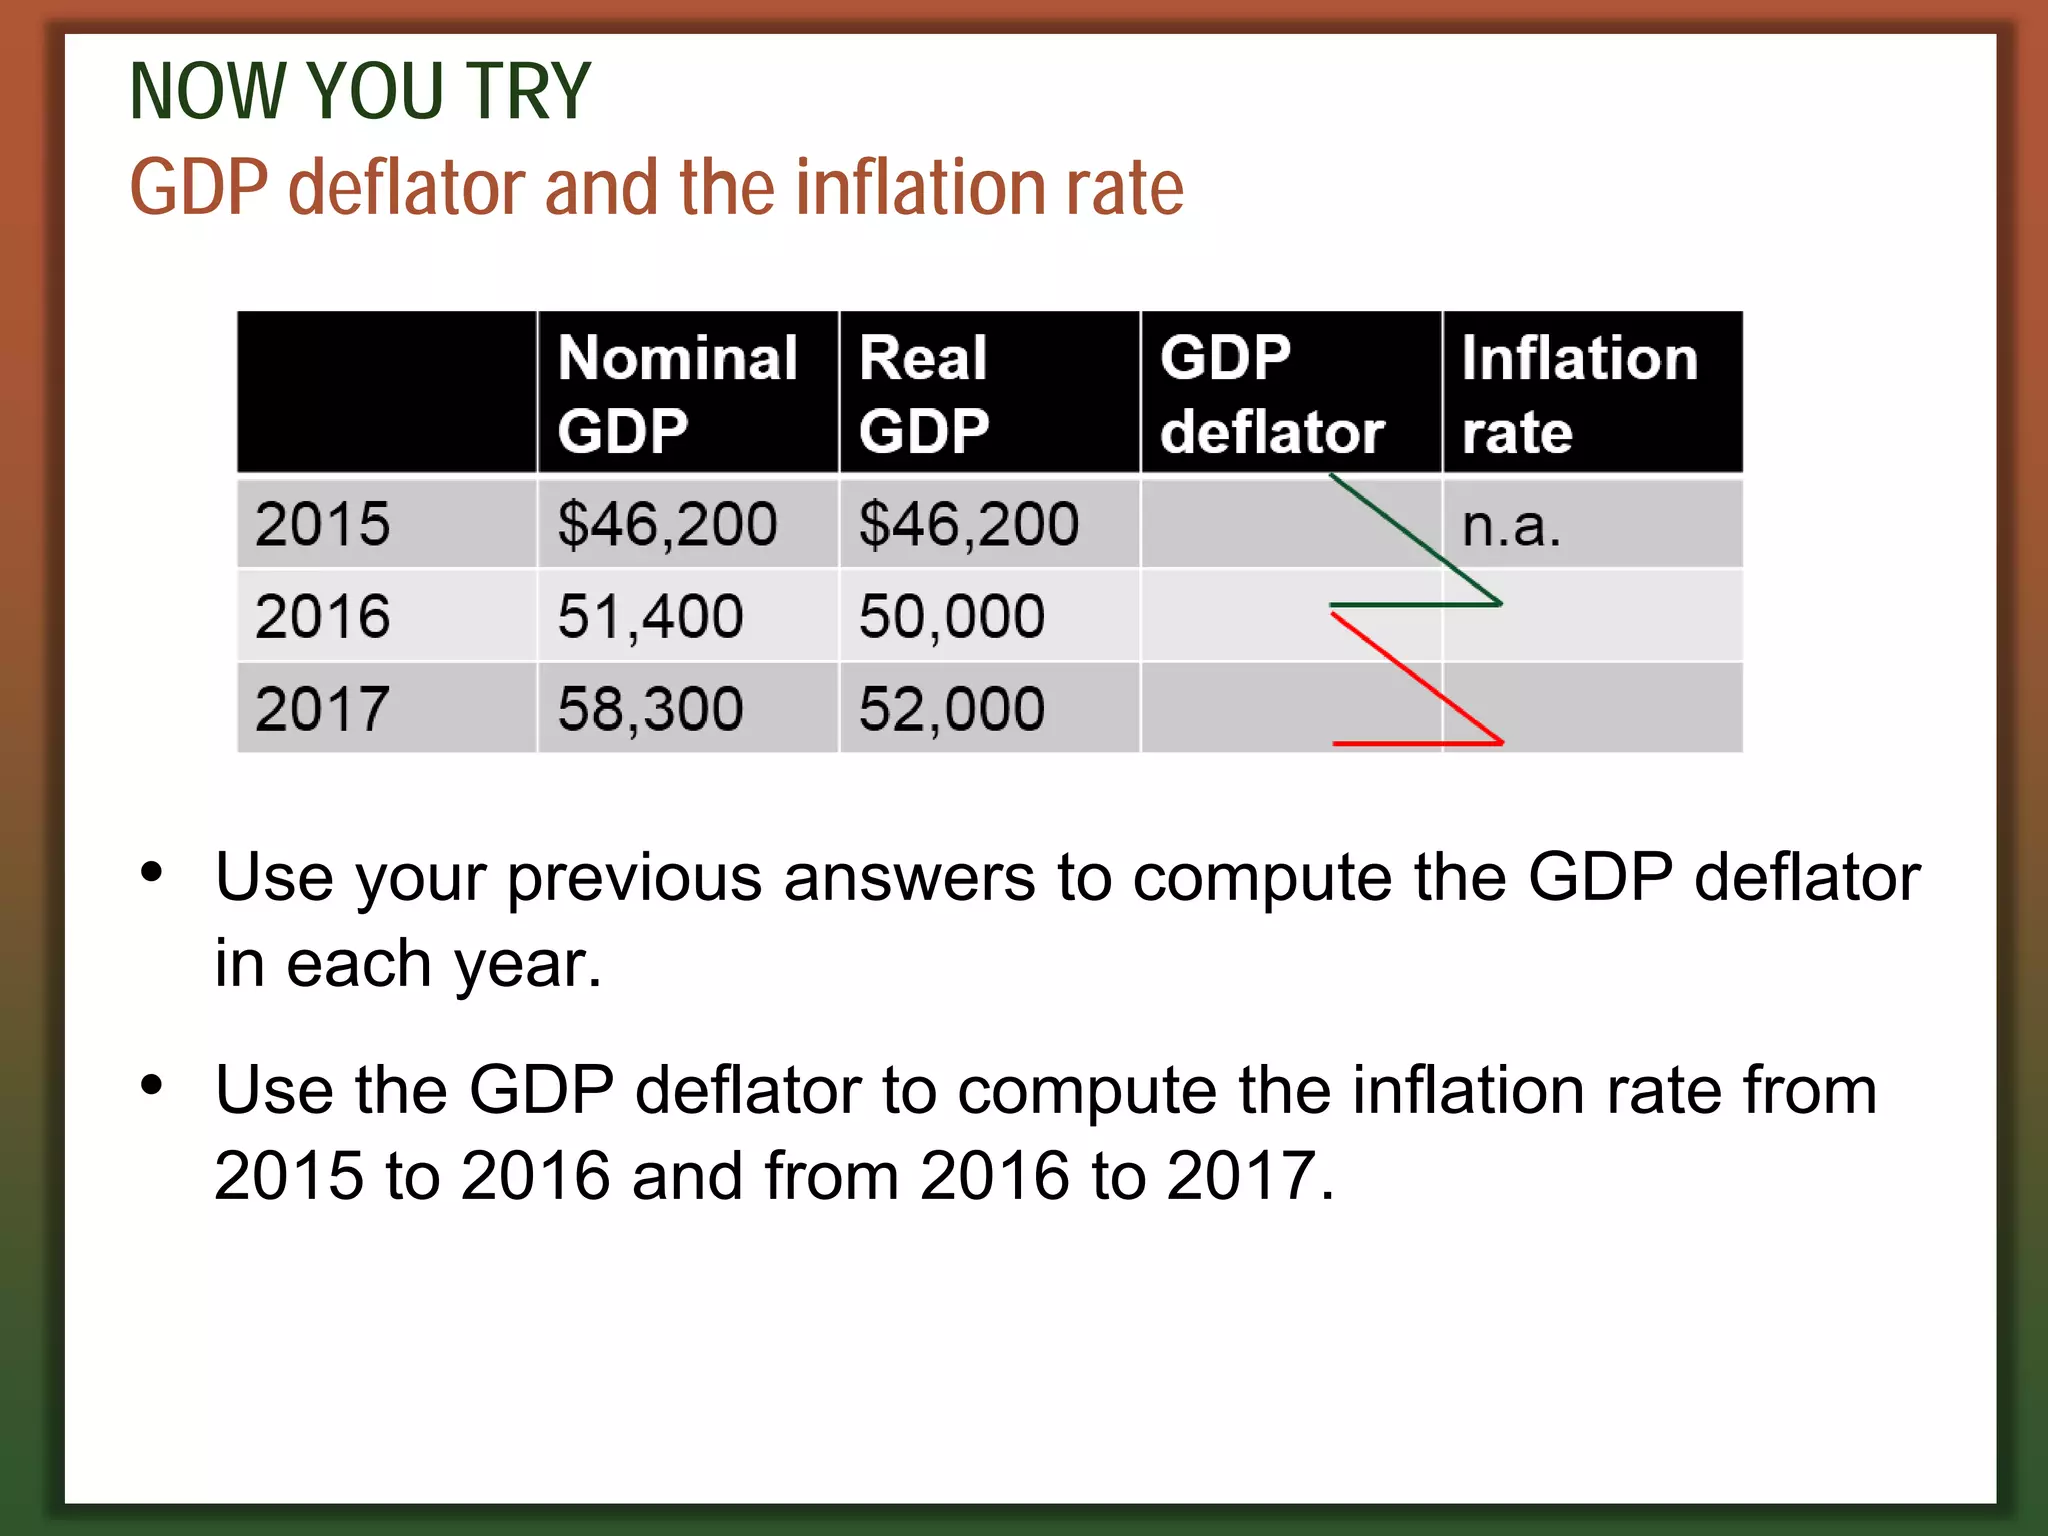
NOW YOU TRY
GDPdeflator and the inflation rate
• Use your previous answers to compute the GDP deflator
in each year.
• Use the GDP deflator to compute the inflation rate from
2015 to 2016 and from 2016 to 2017.
34.
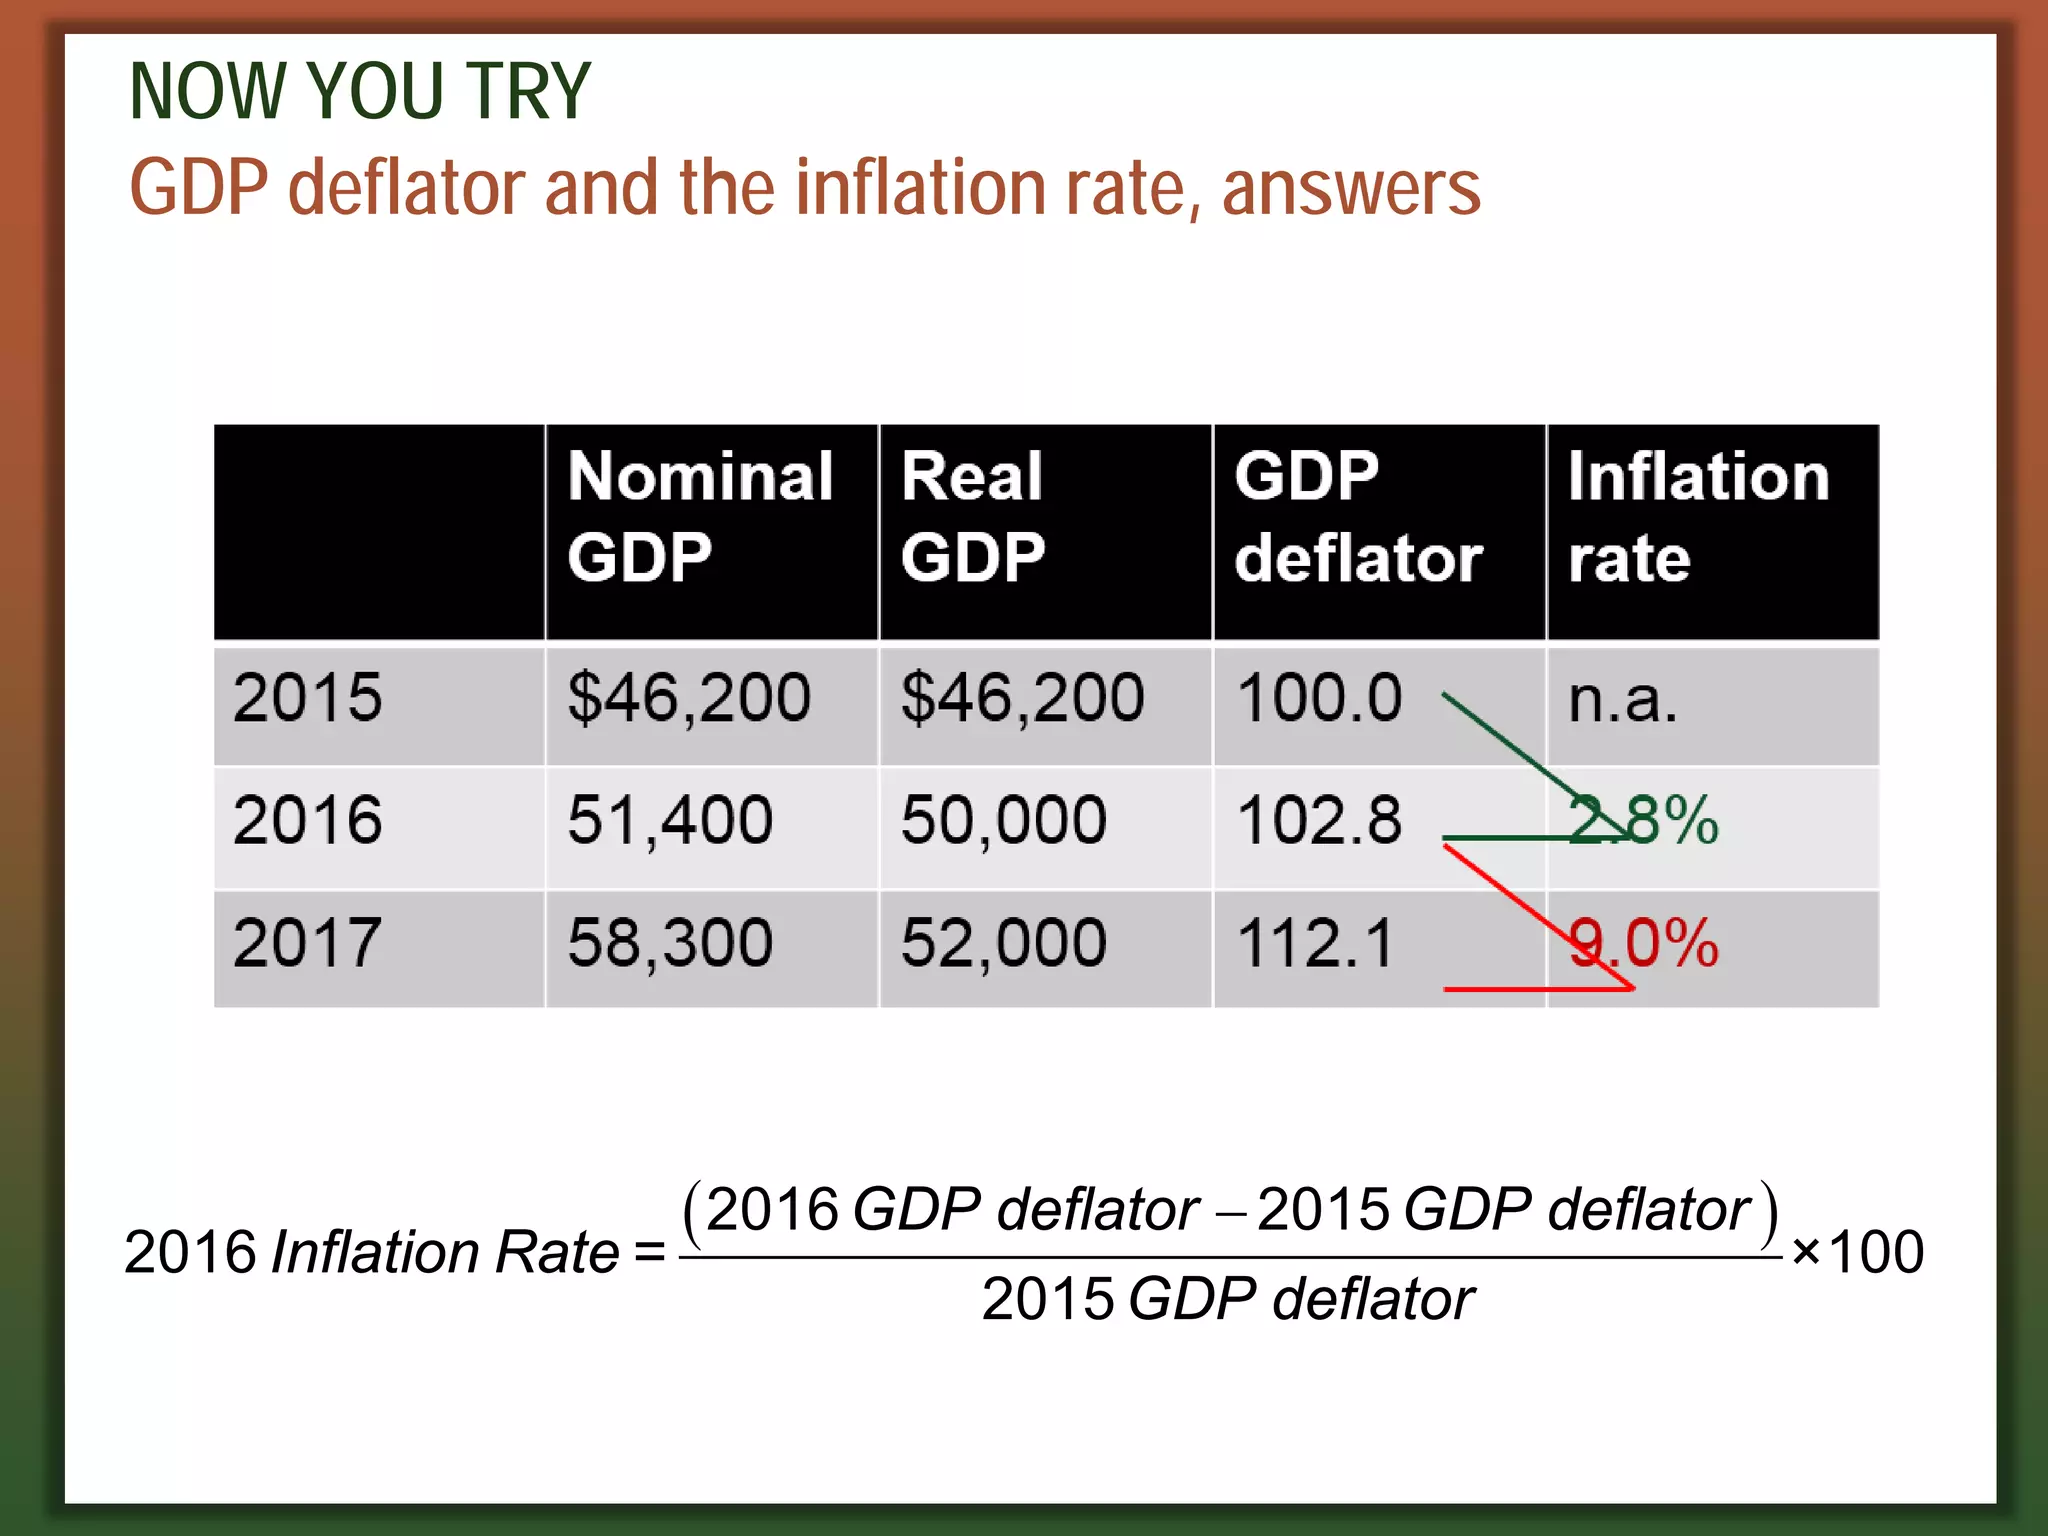
NOW YOU TRY
GDPdeflator and the inflation rate, answers
( )
−
2016 2015
2016 = ×100
2015
GDP deflator GDP deflator
Inflation Rate
GDP deflator
35.
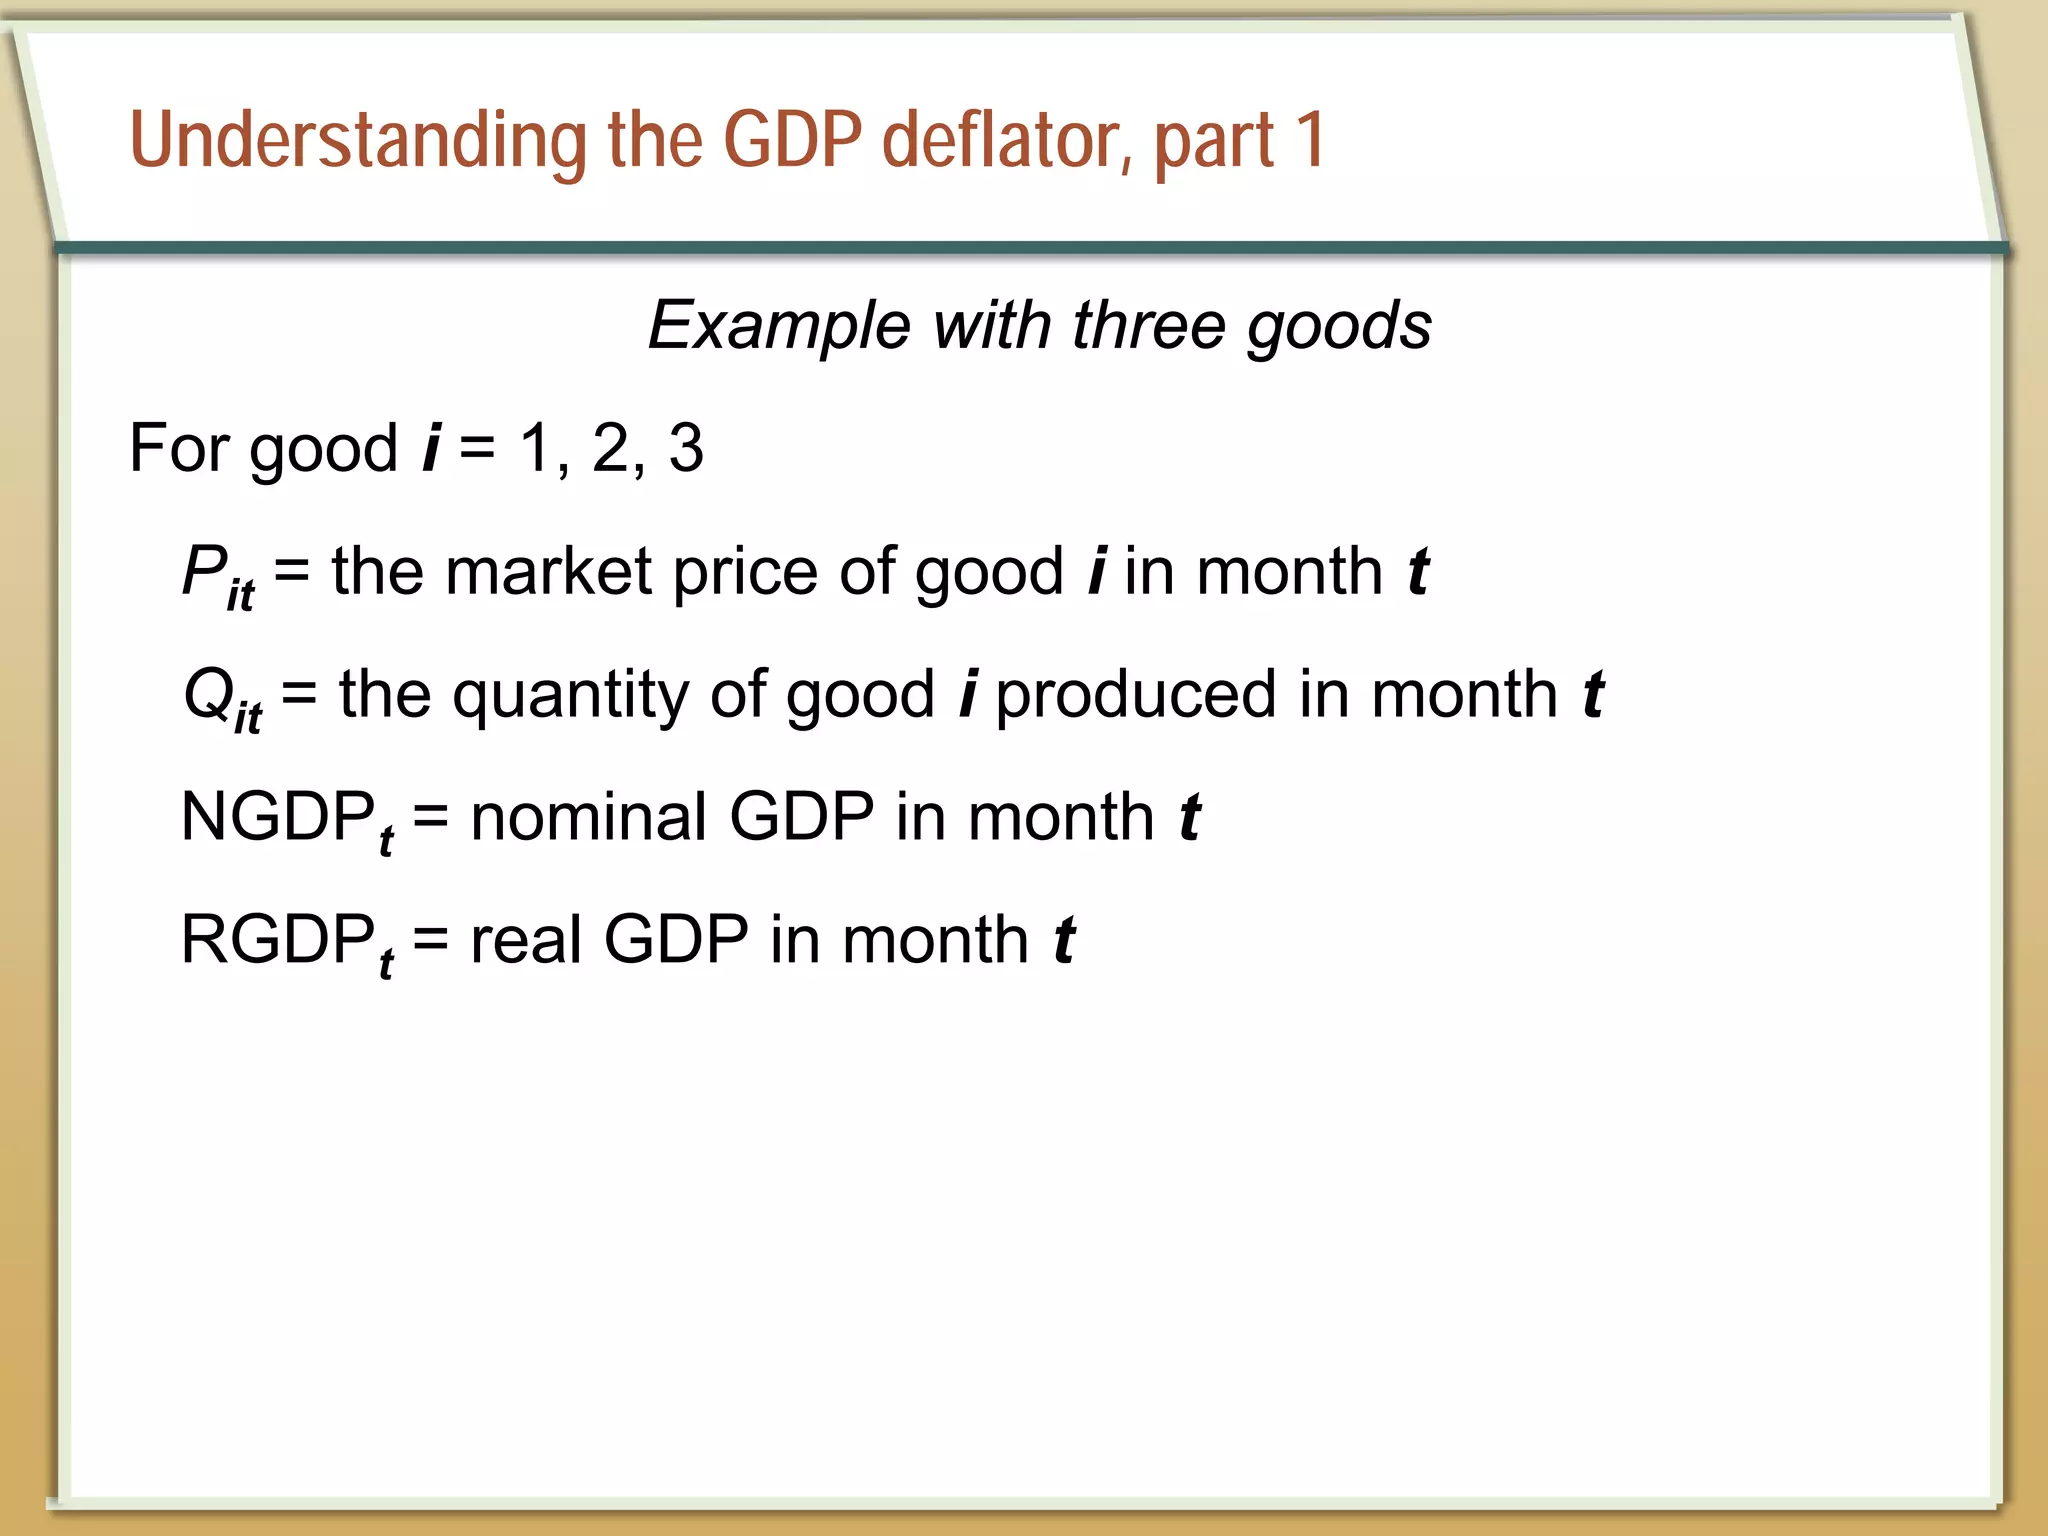
Understanding the GDPdeflator, part 1
Example with three goods
For good i = 1, 2, 3
Pit = the market price of good i in month t
Qit = the quantity of good i produced in month t
NGDPt = nominal GDP in month t
RGDPt = real GDP in month t
36.
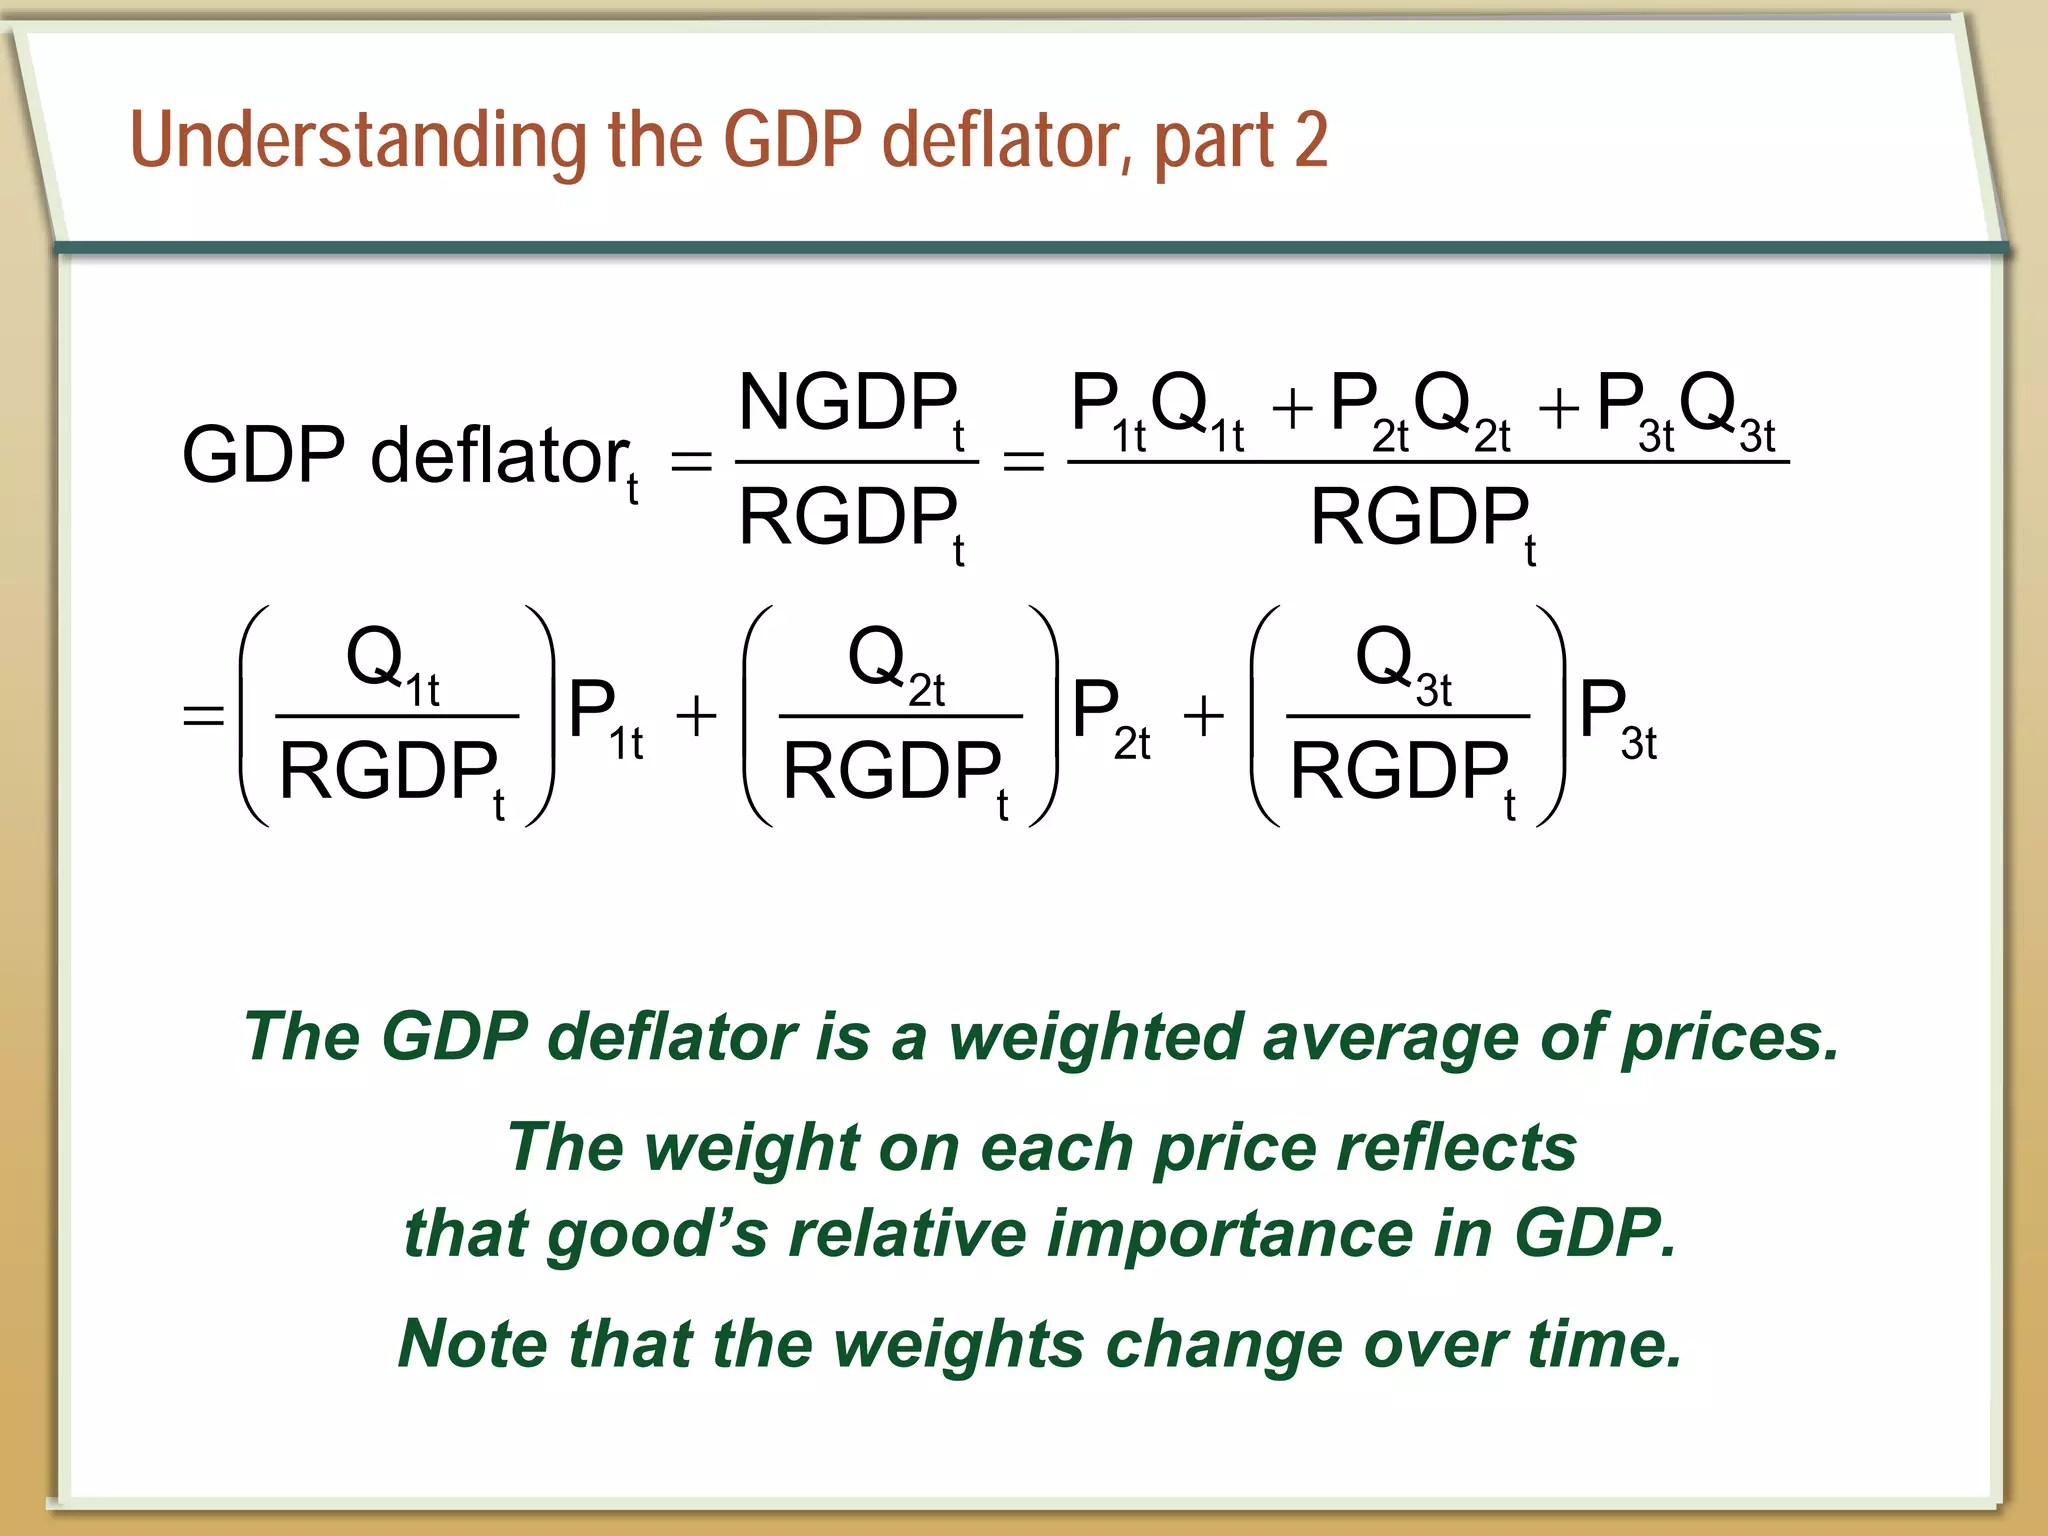
Understanding the GDPdeflator, part 2
+ +
= =
= + +
t 1t 1t 2t 2t 3t 3t
t
t t
1t 2t 3t
1t 2t 3t
t t t
NGDP P Q P Q P Q
GDP deflator
RGDP RGDP
Q Q Q
P P P
RGDP RGDP RGDP
The GDP deflator is a weighted average of prices.
The weight on each price reflects
that good’s relative importance in GDP.
Note that the weights change over time.
37.
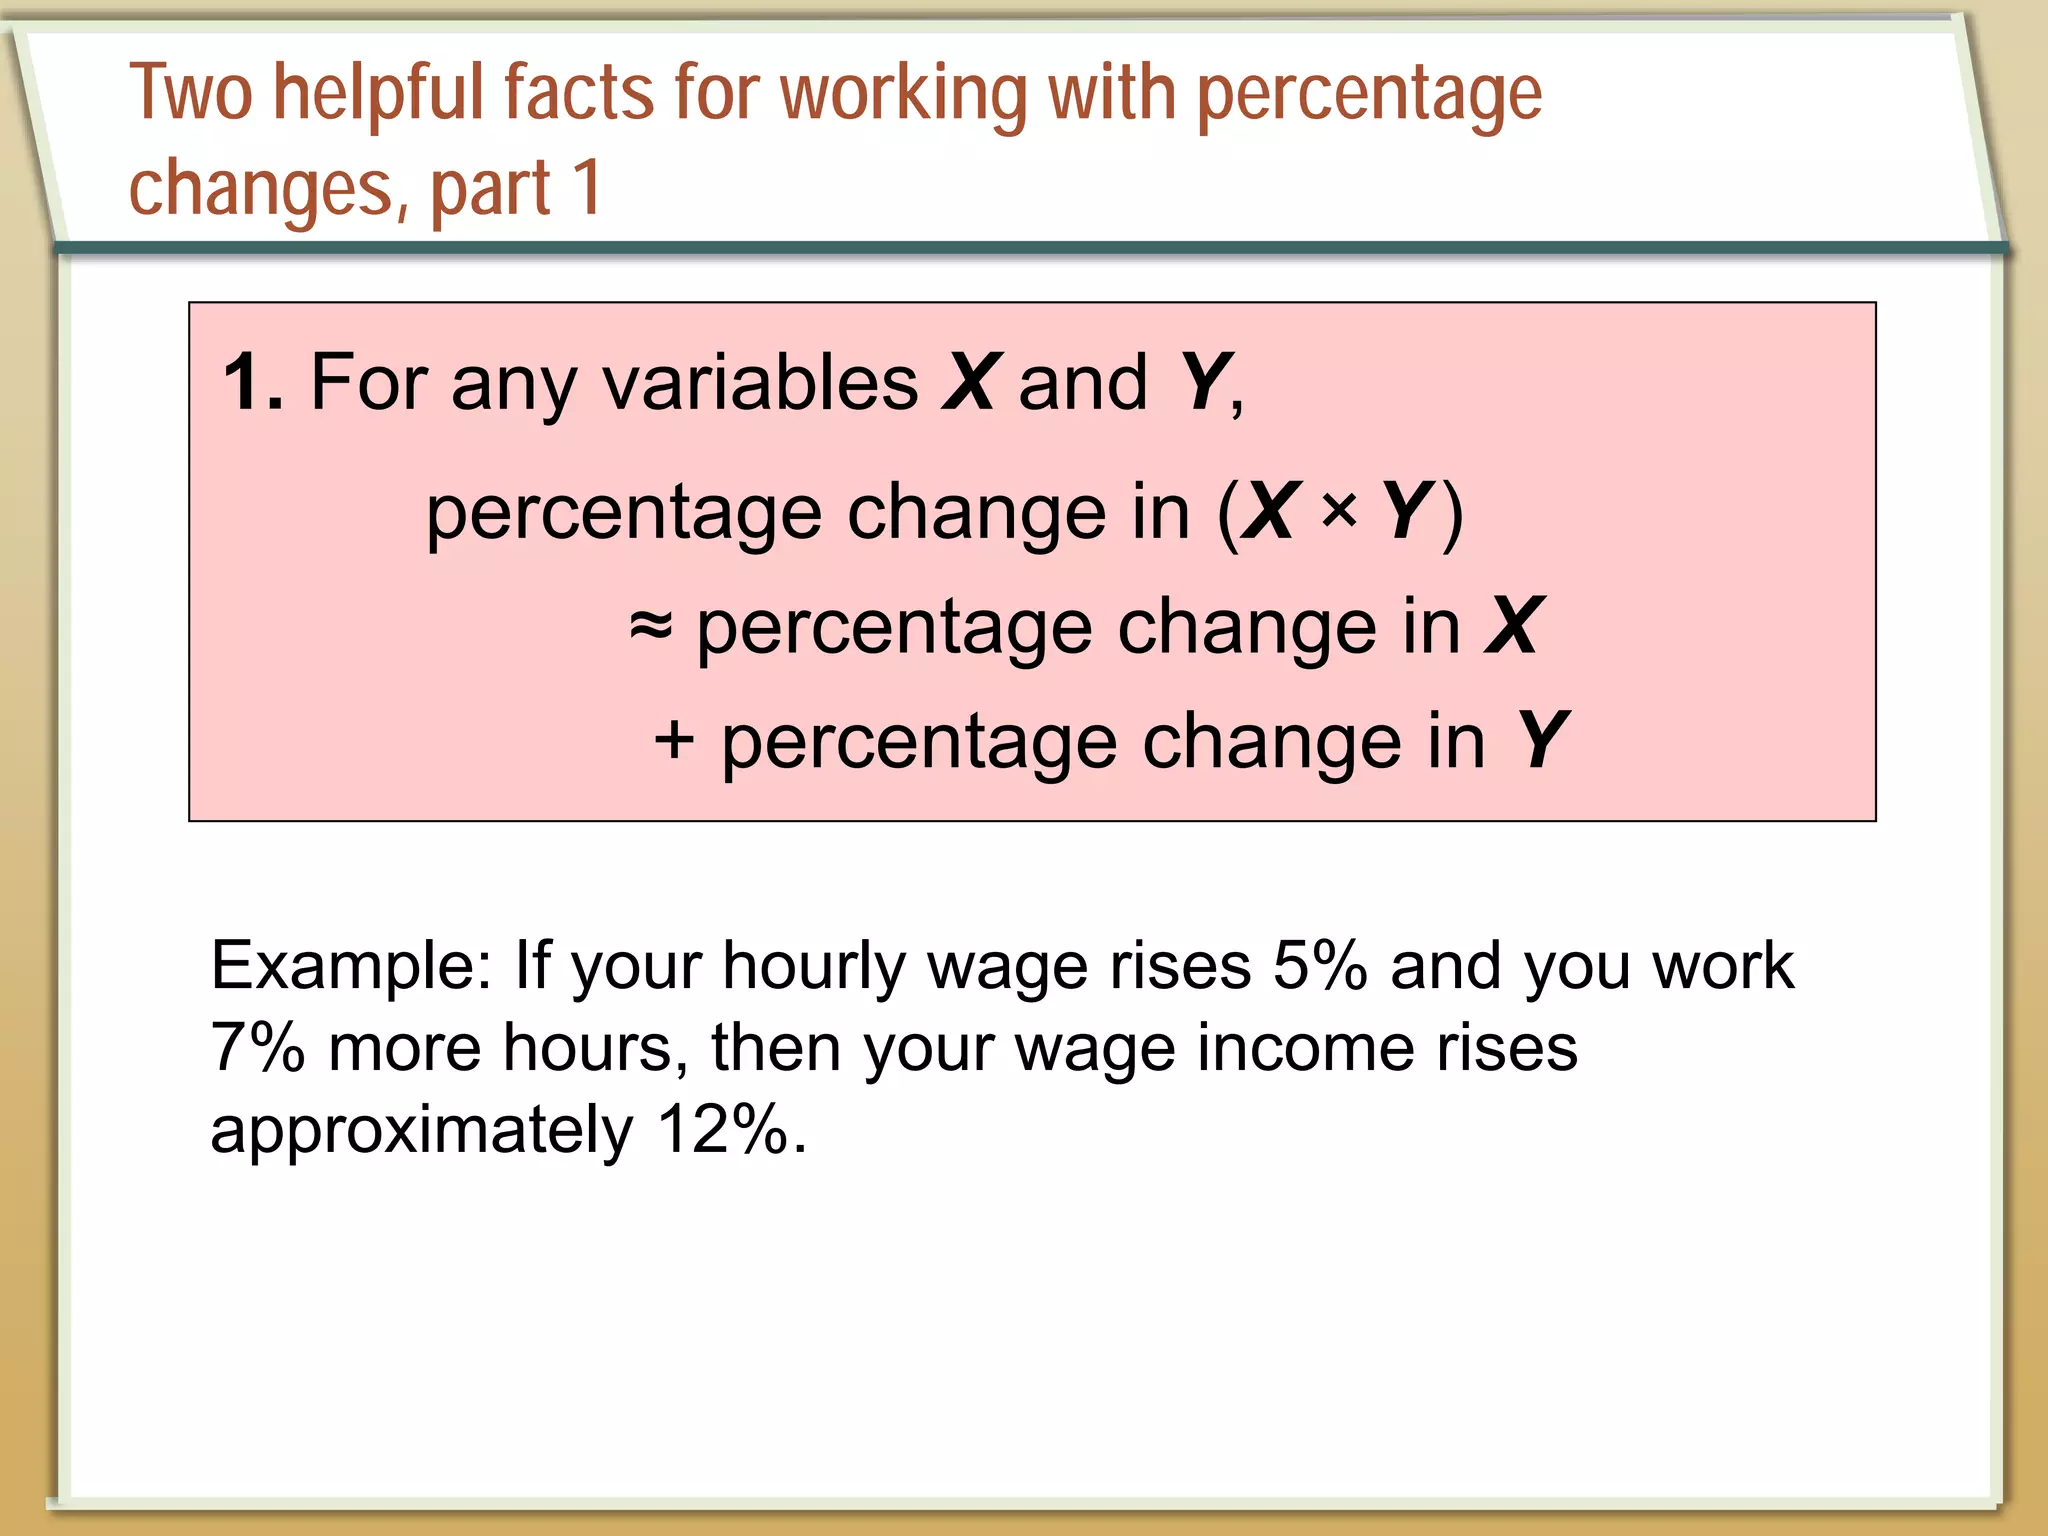
Two helpful factsfor working with percentage
changes, part 1
1. For any variables X and Y,
percentage change in (X ×Y)
≈ percentage change in X
+ percentage change in Y
Example: If your hourly wage rises 5% and you work
7% more hours, then your wage income rises
approximately 12%.
38.
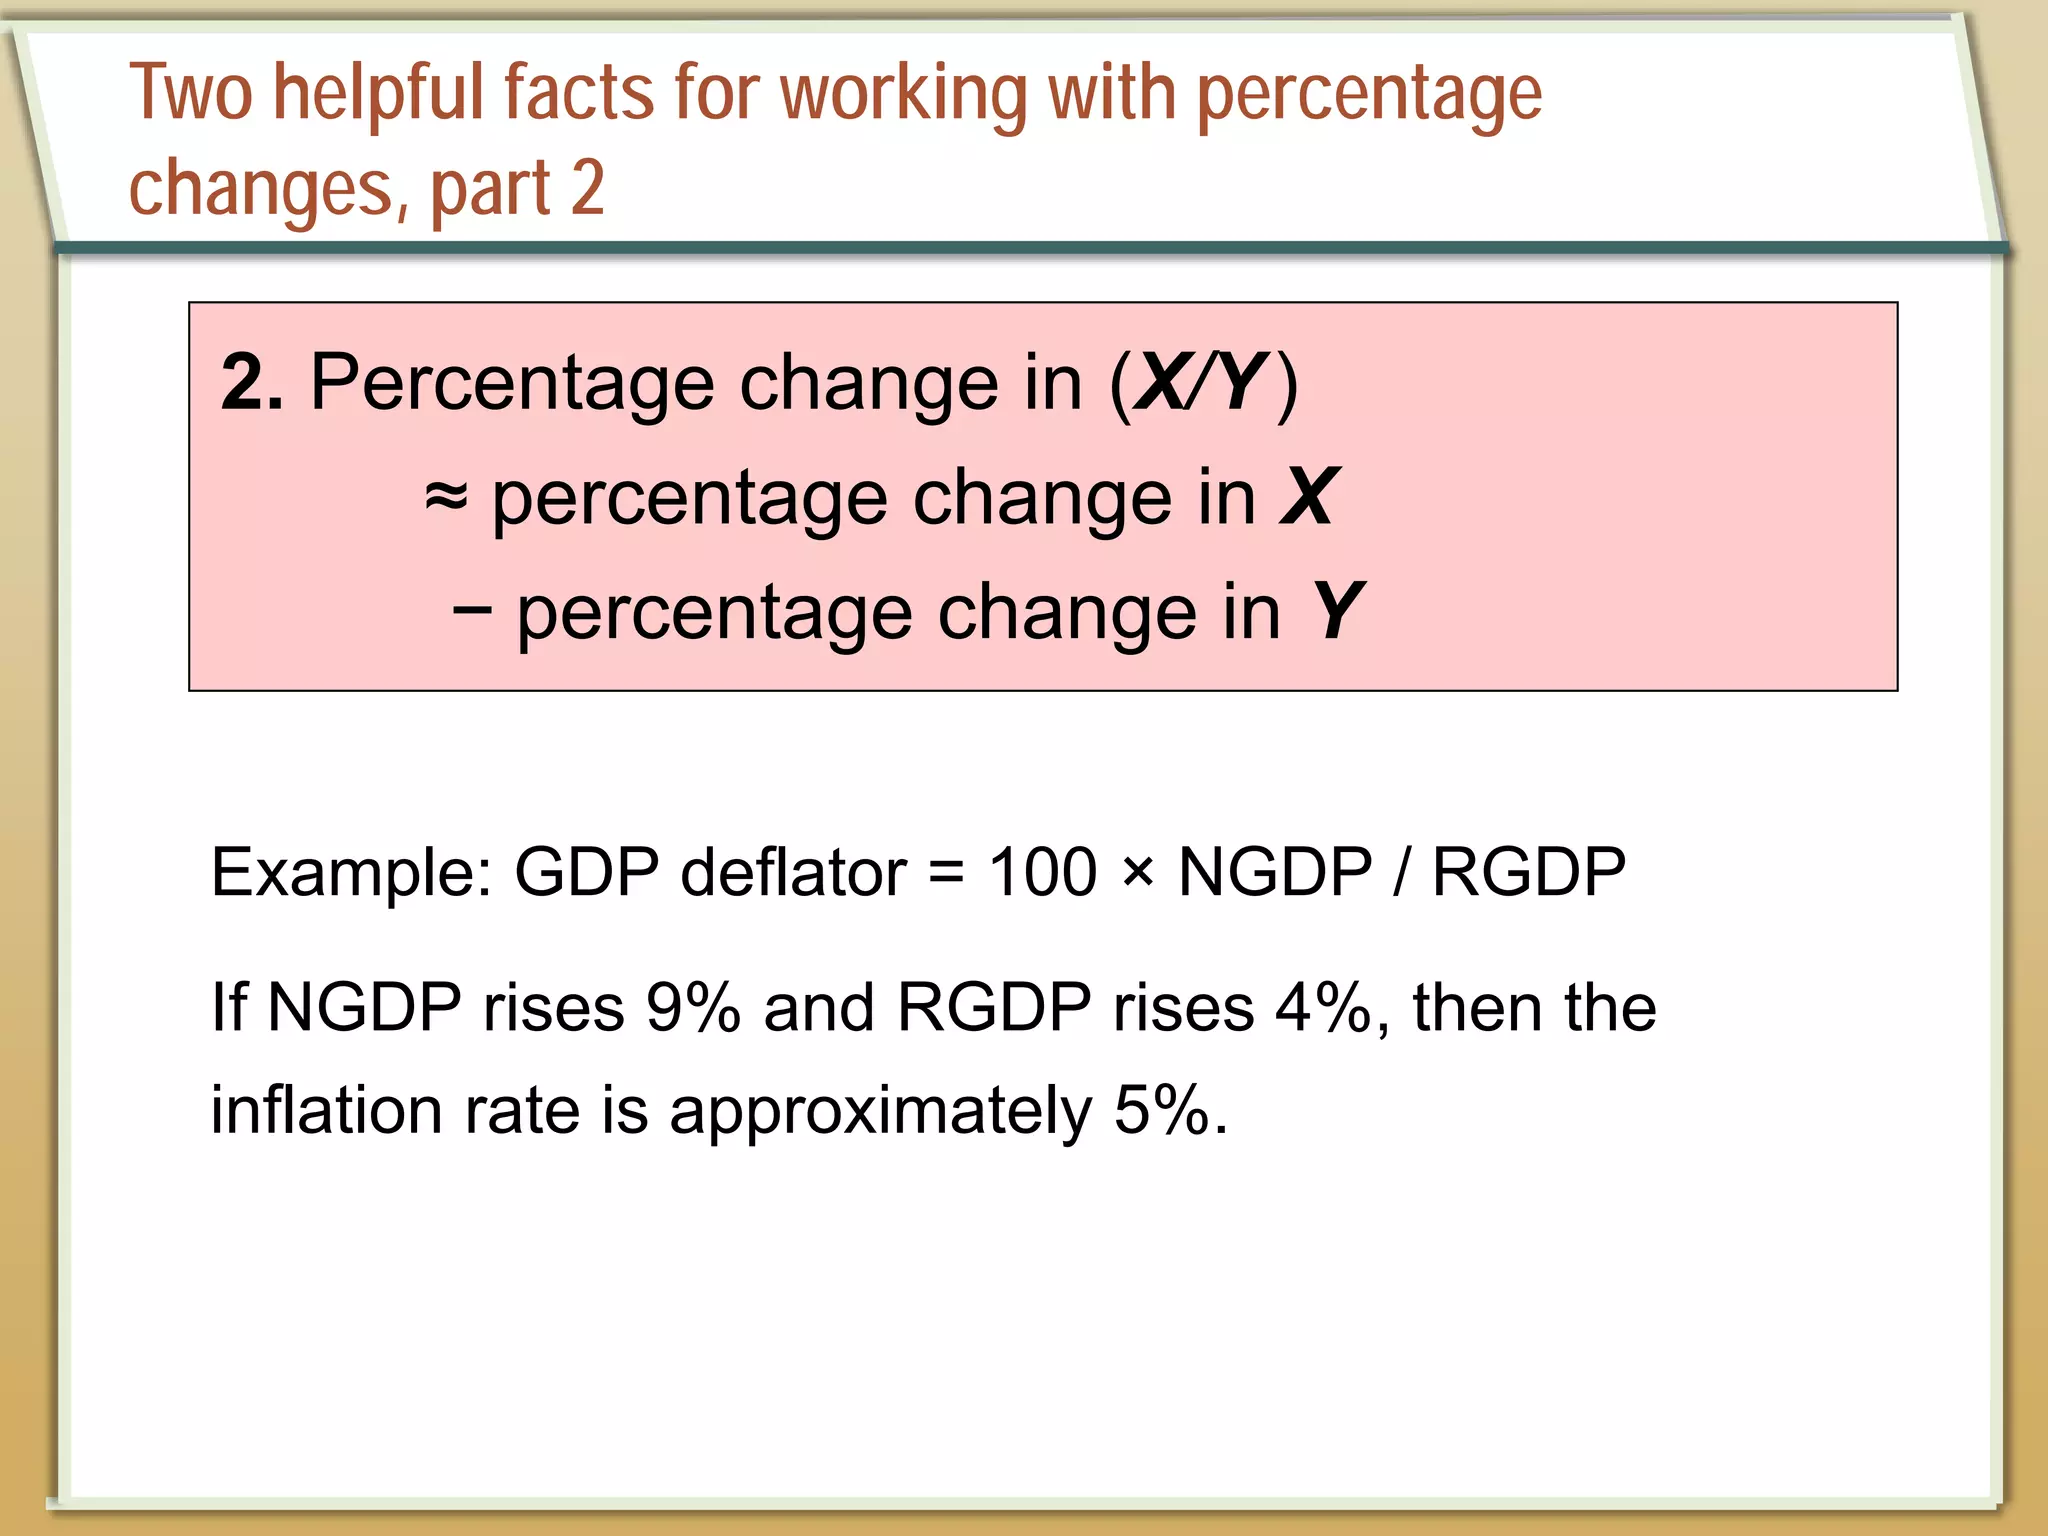
Two helpful factsfor working with percentage
changes, part 2
2. Percentage change in (X/Y)
≈ percentage change in X
− percentage change in Y
Example: GDP deflator = 100 × NGDP / RGDP
If NGDP rises 9% and RGDP rises 4%, then the
inflation rate is approximately 5%.
39.
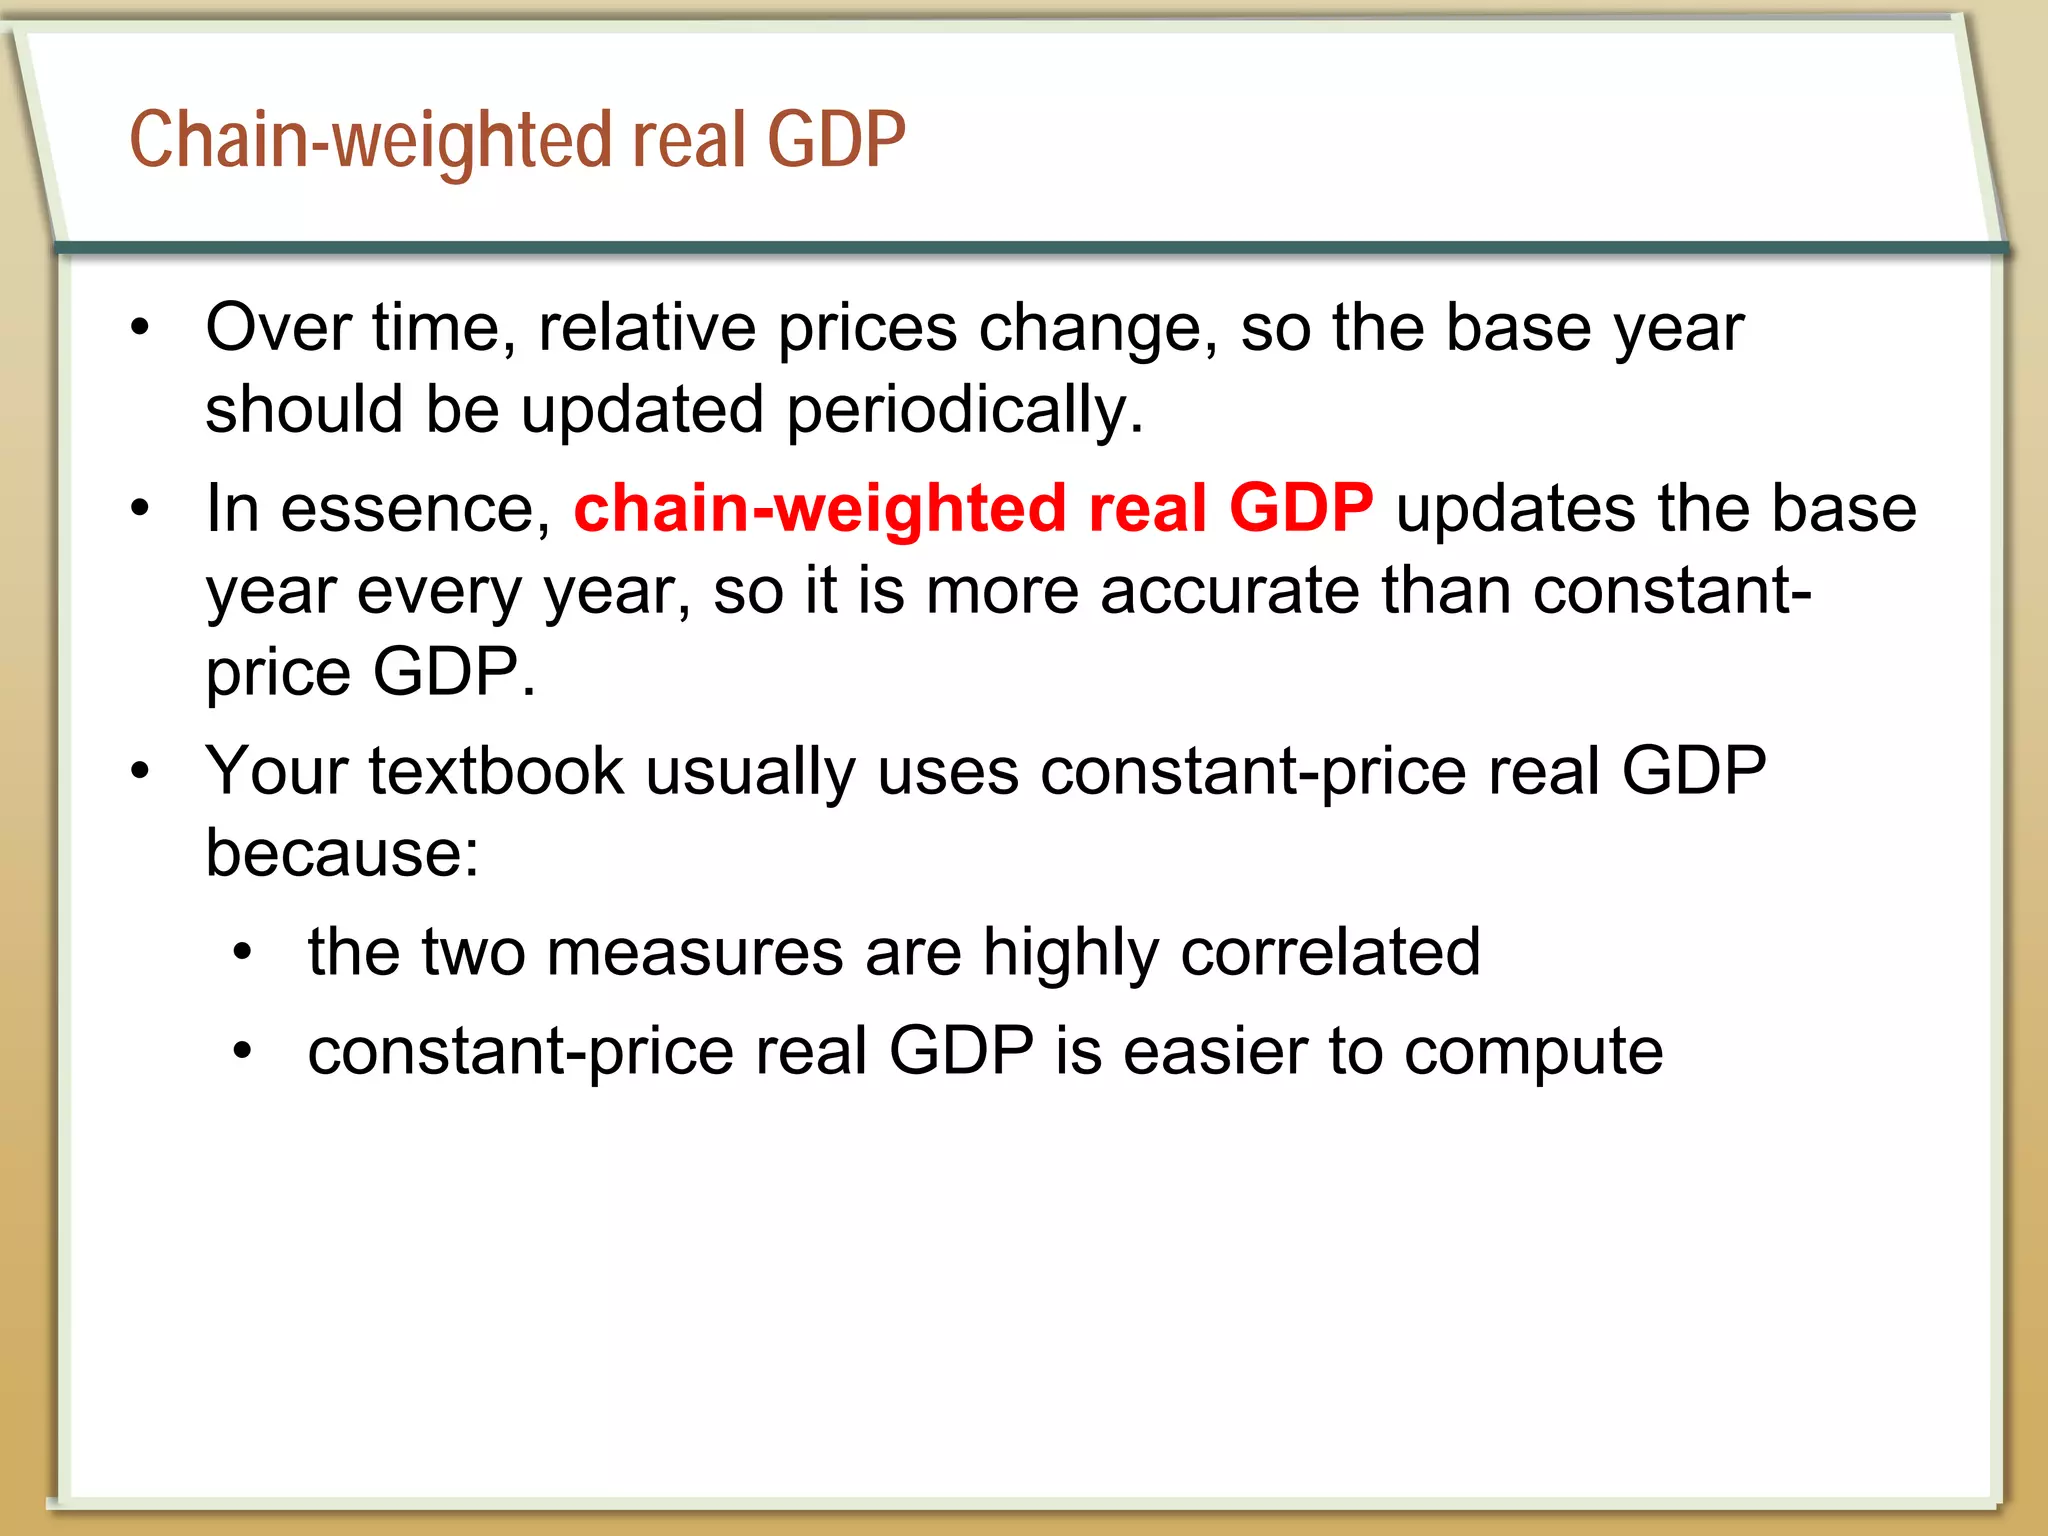
Chain-weighted real GDP
•Over time, relative prices change, so the base year
should be updated periodically.
• In essence, chain-weighted real GDP updates the base
year every year, so it is more accurate than constant-
price GDP.
• Your textbook usually uses constant-price real GDP
because:
• the two measures are highly correlated
• constant-price real GDP is easier to compute
40.
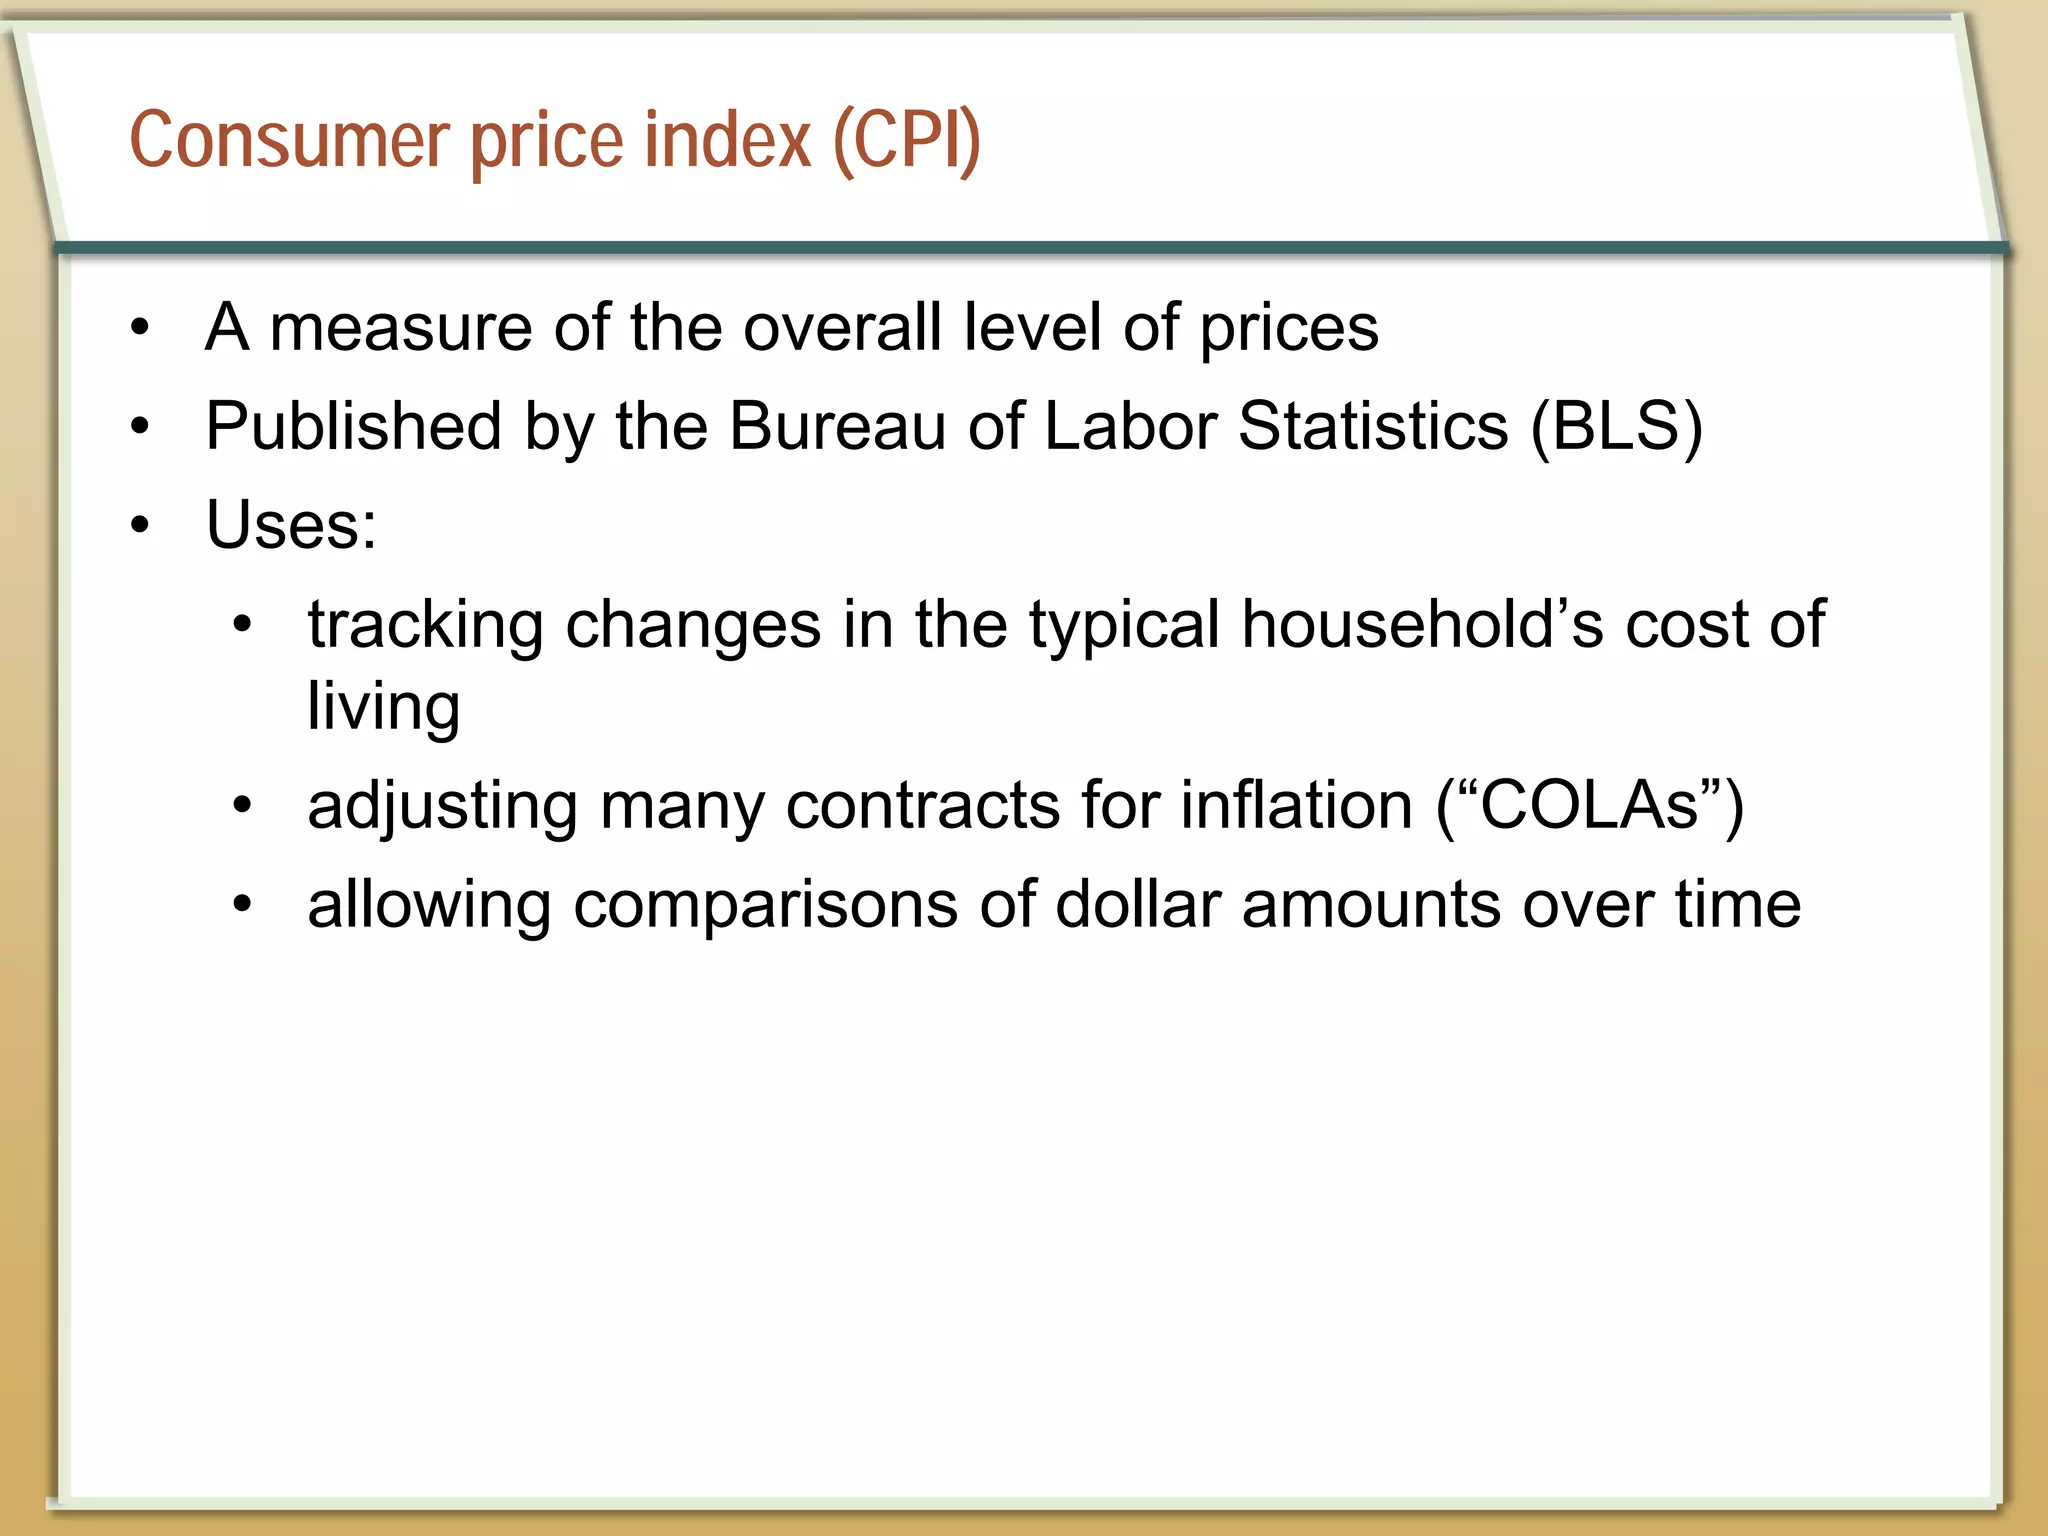
Consumer price index(CPI)
• A measure of the overall level of prices
• Published by the Bureau of Labor Statistics (BLS)
• Uses:
• tracking changes in the typical household’s cost of
living
• adjusting many contracts for inflation (“COLAs”)
• allowing comparisons of dollar amounts over time
41.
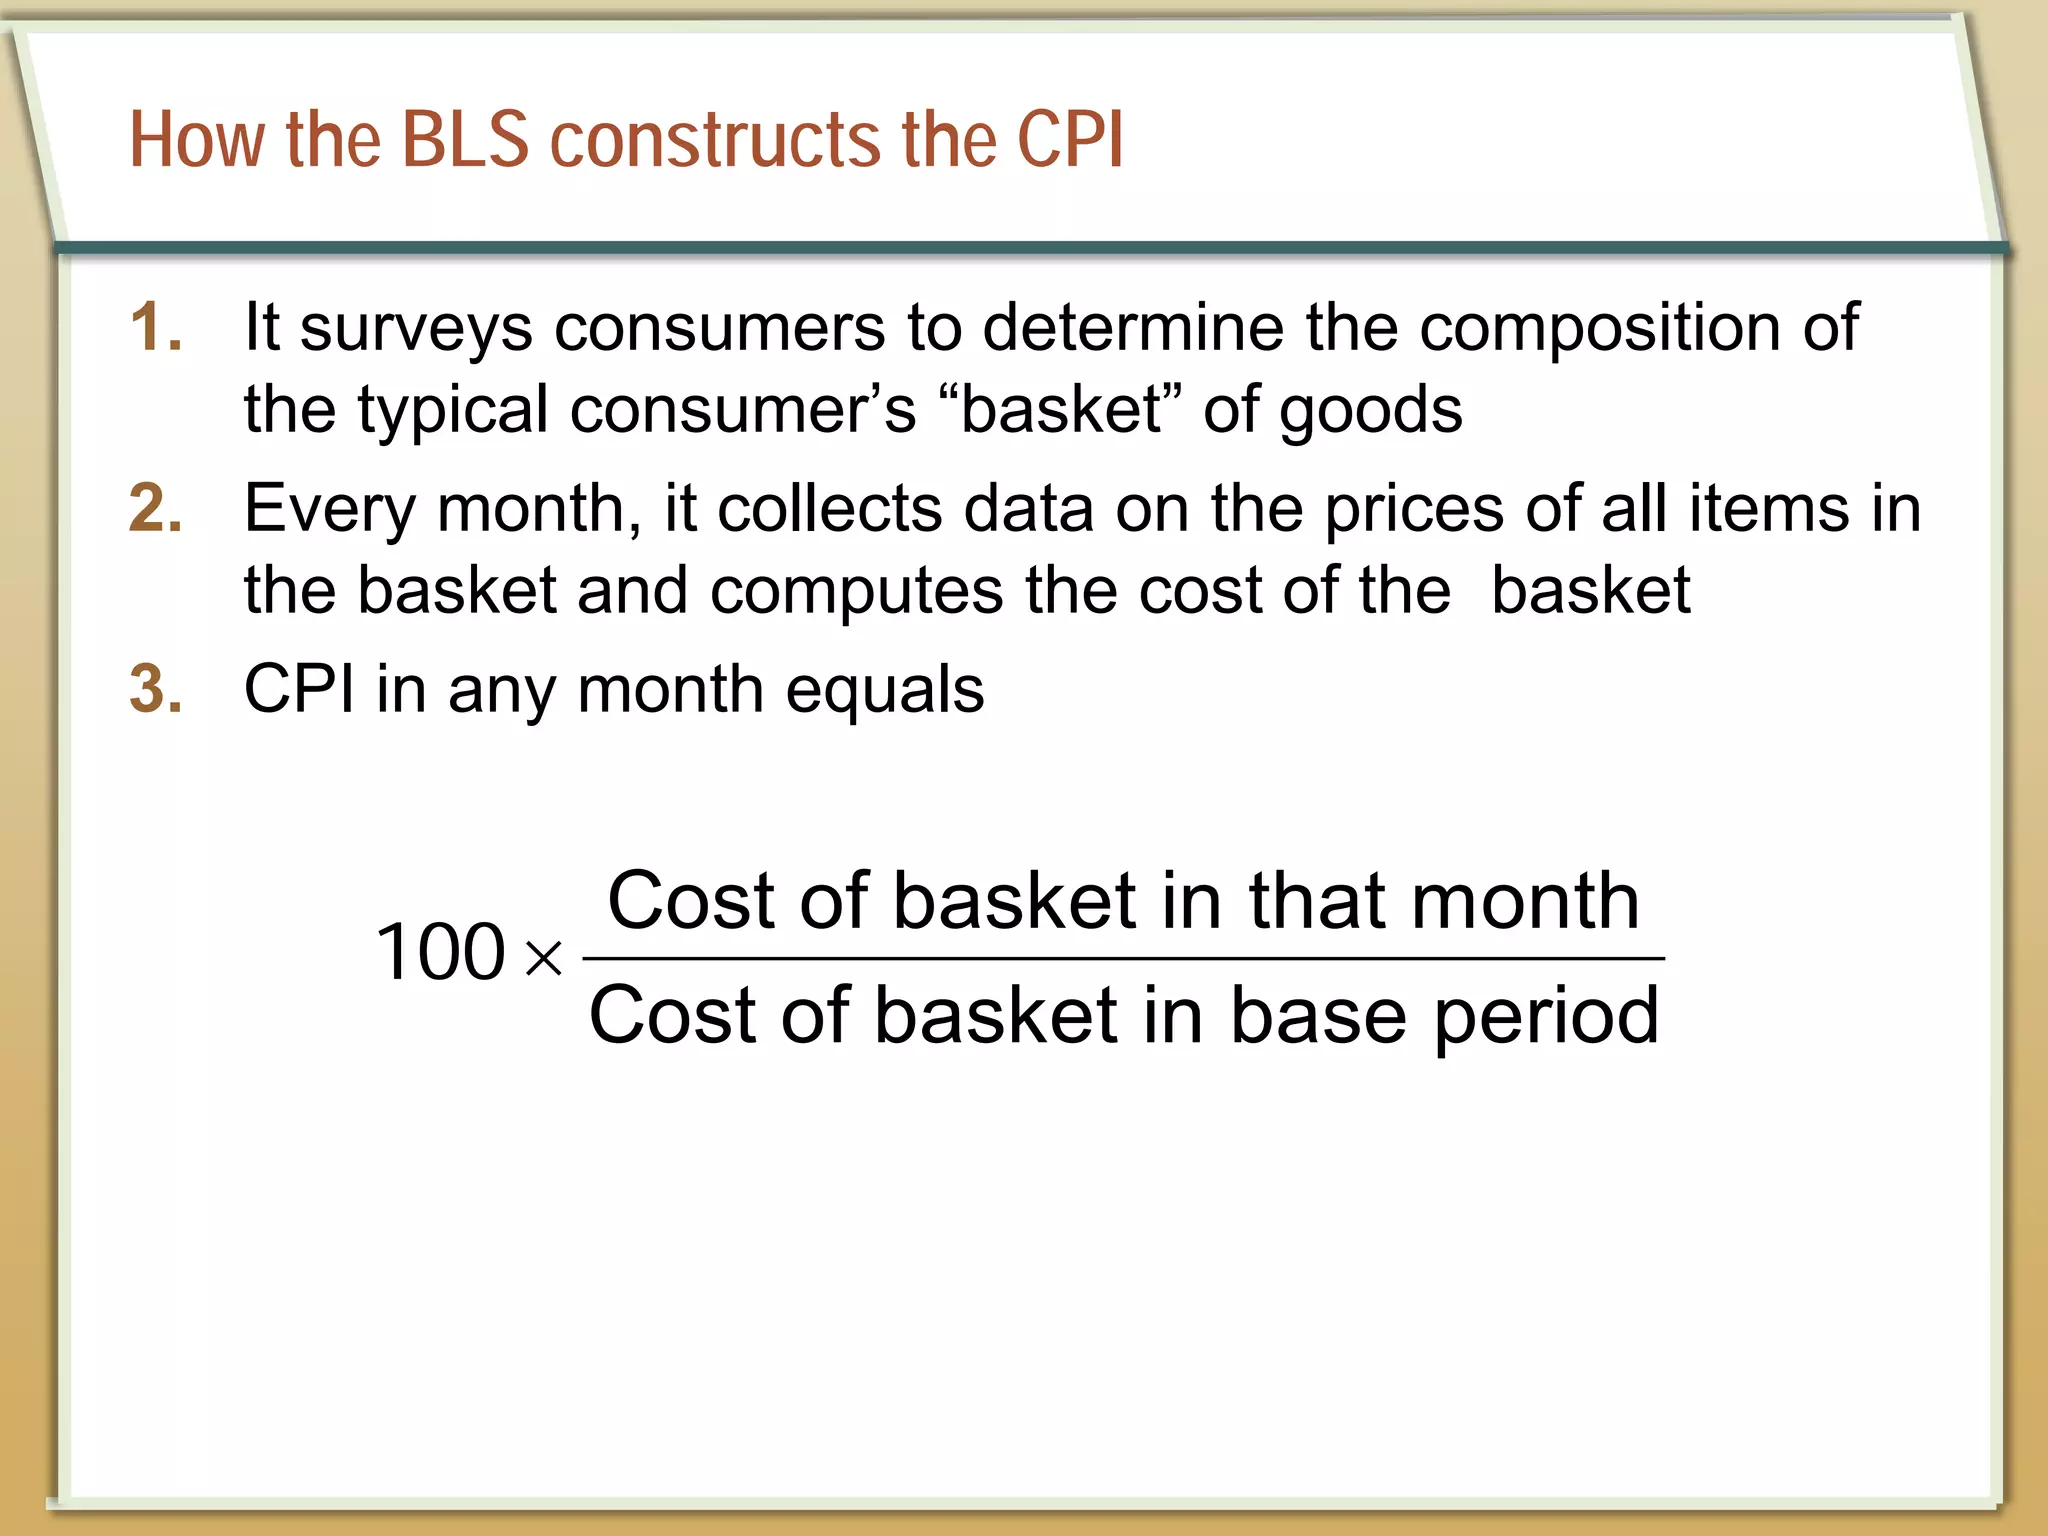
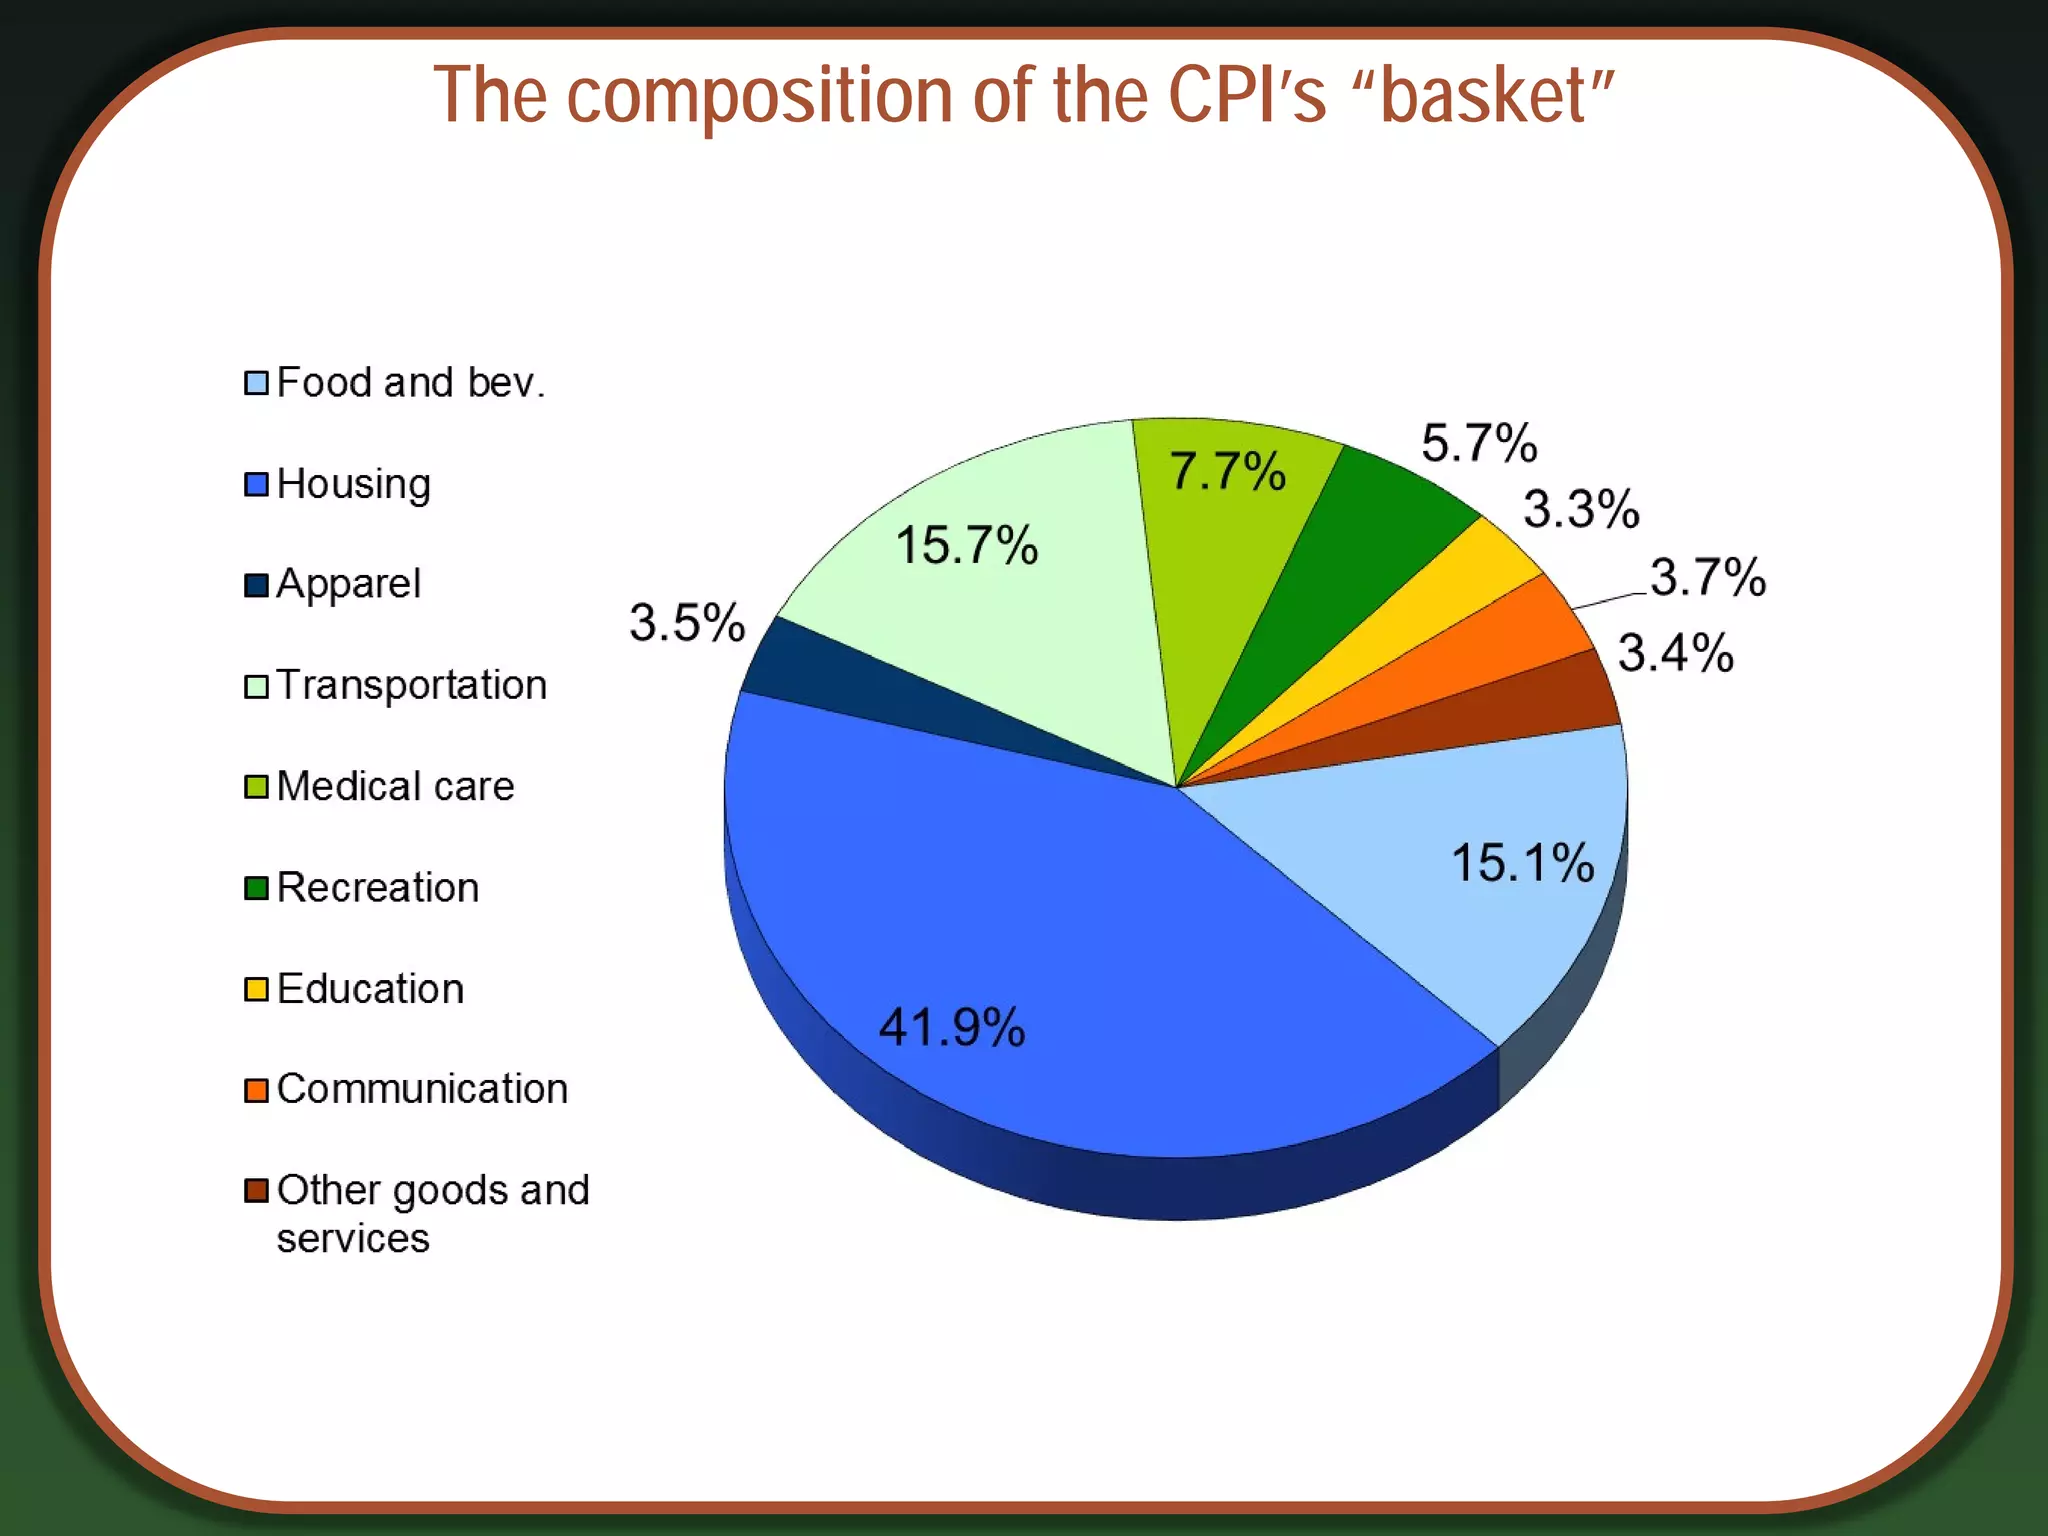
How the BLSconstructs the CPI
1. It surveys consumers to determine the composition of
the typical consumer’s “basket” of goods
2. Every month, it collects data on the prices of all items in
the basket and computes the cost of the basket
3. CPI in any month equals
Cost of basket in that month
Cost of basket in base period
100 ×
42.
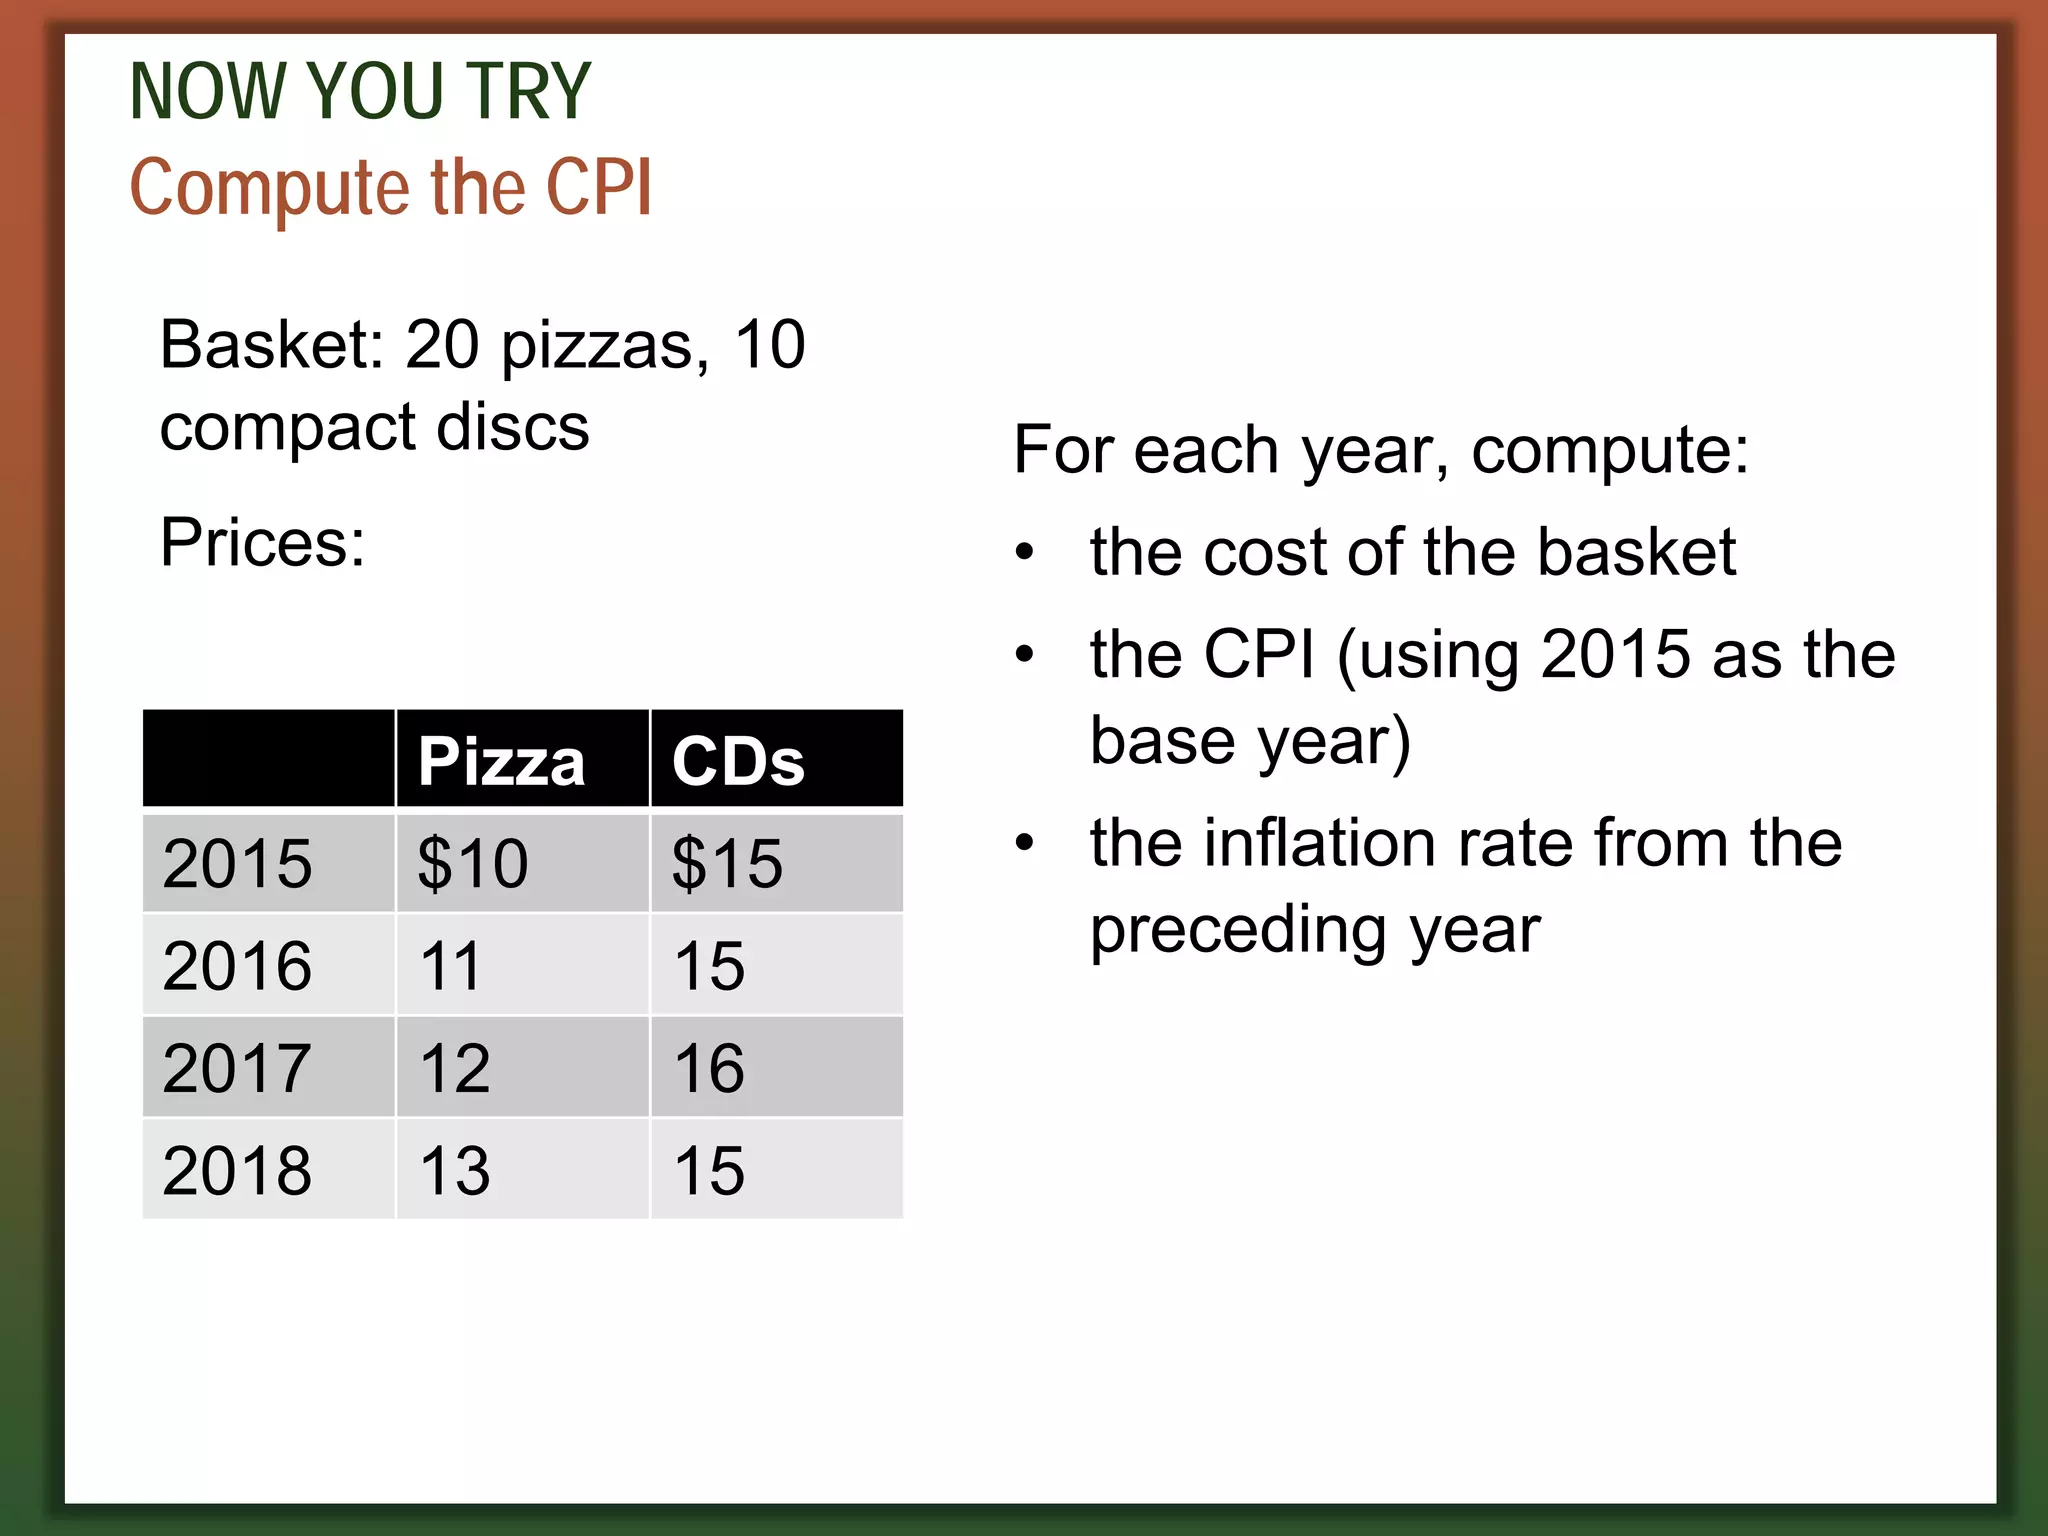
NOW YOU TRY
Computethe CPI
Basket: 20 pizzas, 10
compact discs
Prices:
Pizza CDs
2015 $10 $15
2016 11 15
2017 12 16
2018 13 15
For each year, compute:
• the cost of the basket
• the CPI (using 2015 as the
base year)
• the inflation rate from the
preceding year
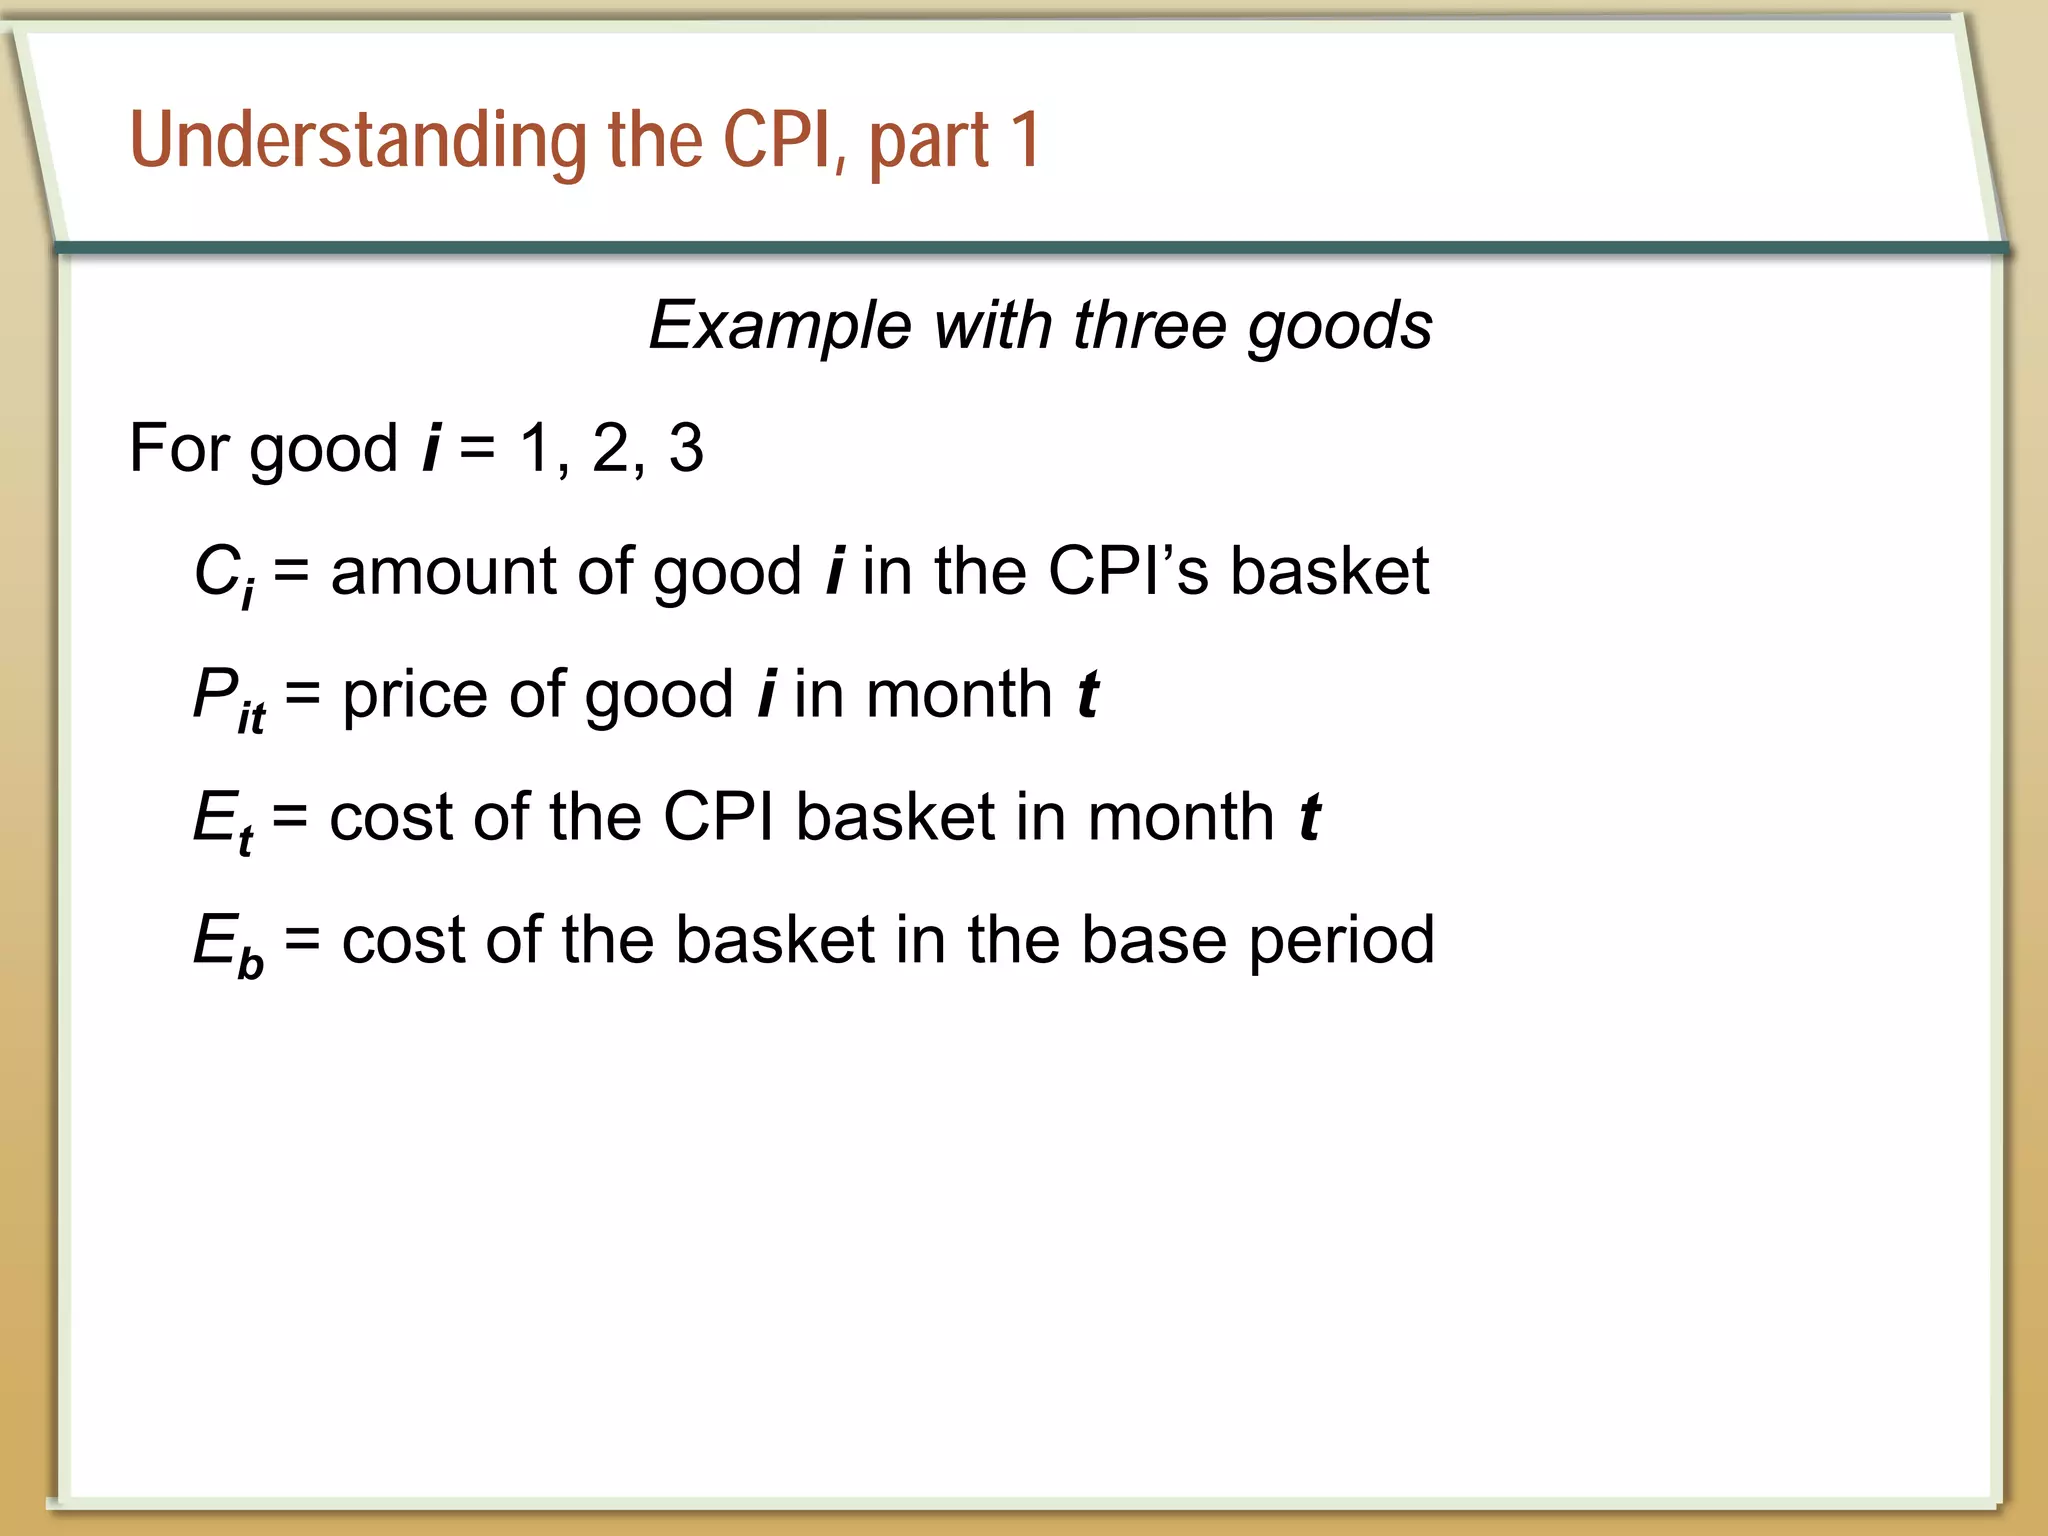
Understanding the CPI,part 1
Example with three goods
For good i = 1, 2, 3
Ci = amount of good i in the CPI’s basket
Pit = price of good i in month t
Et = cost of the CPI basket in month t
Eb = cost of the basket in the base period
46.
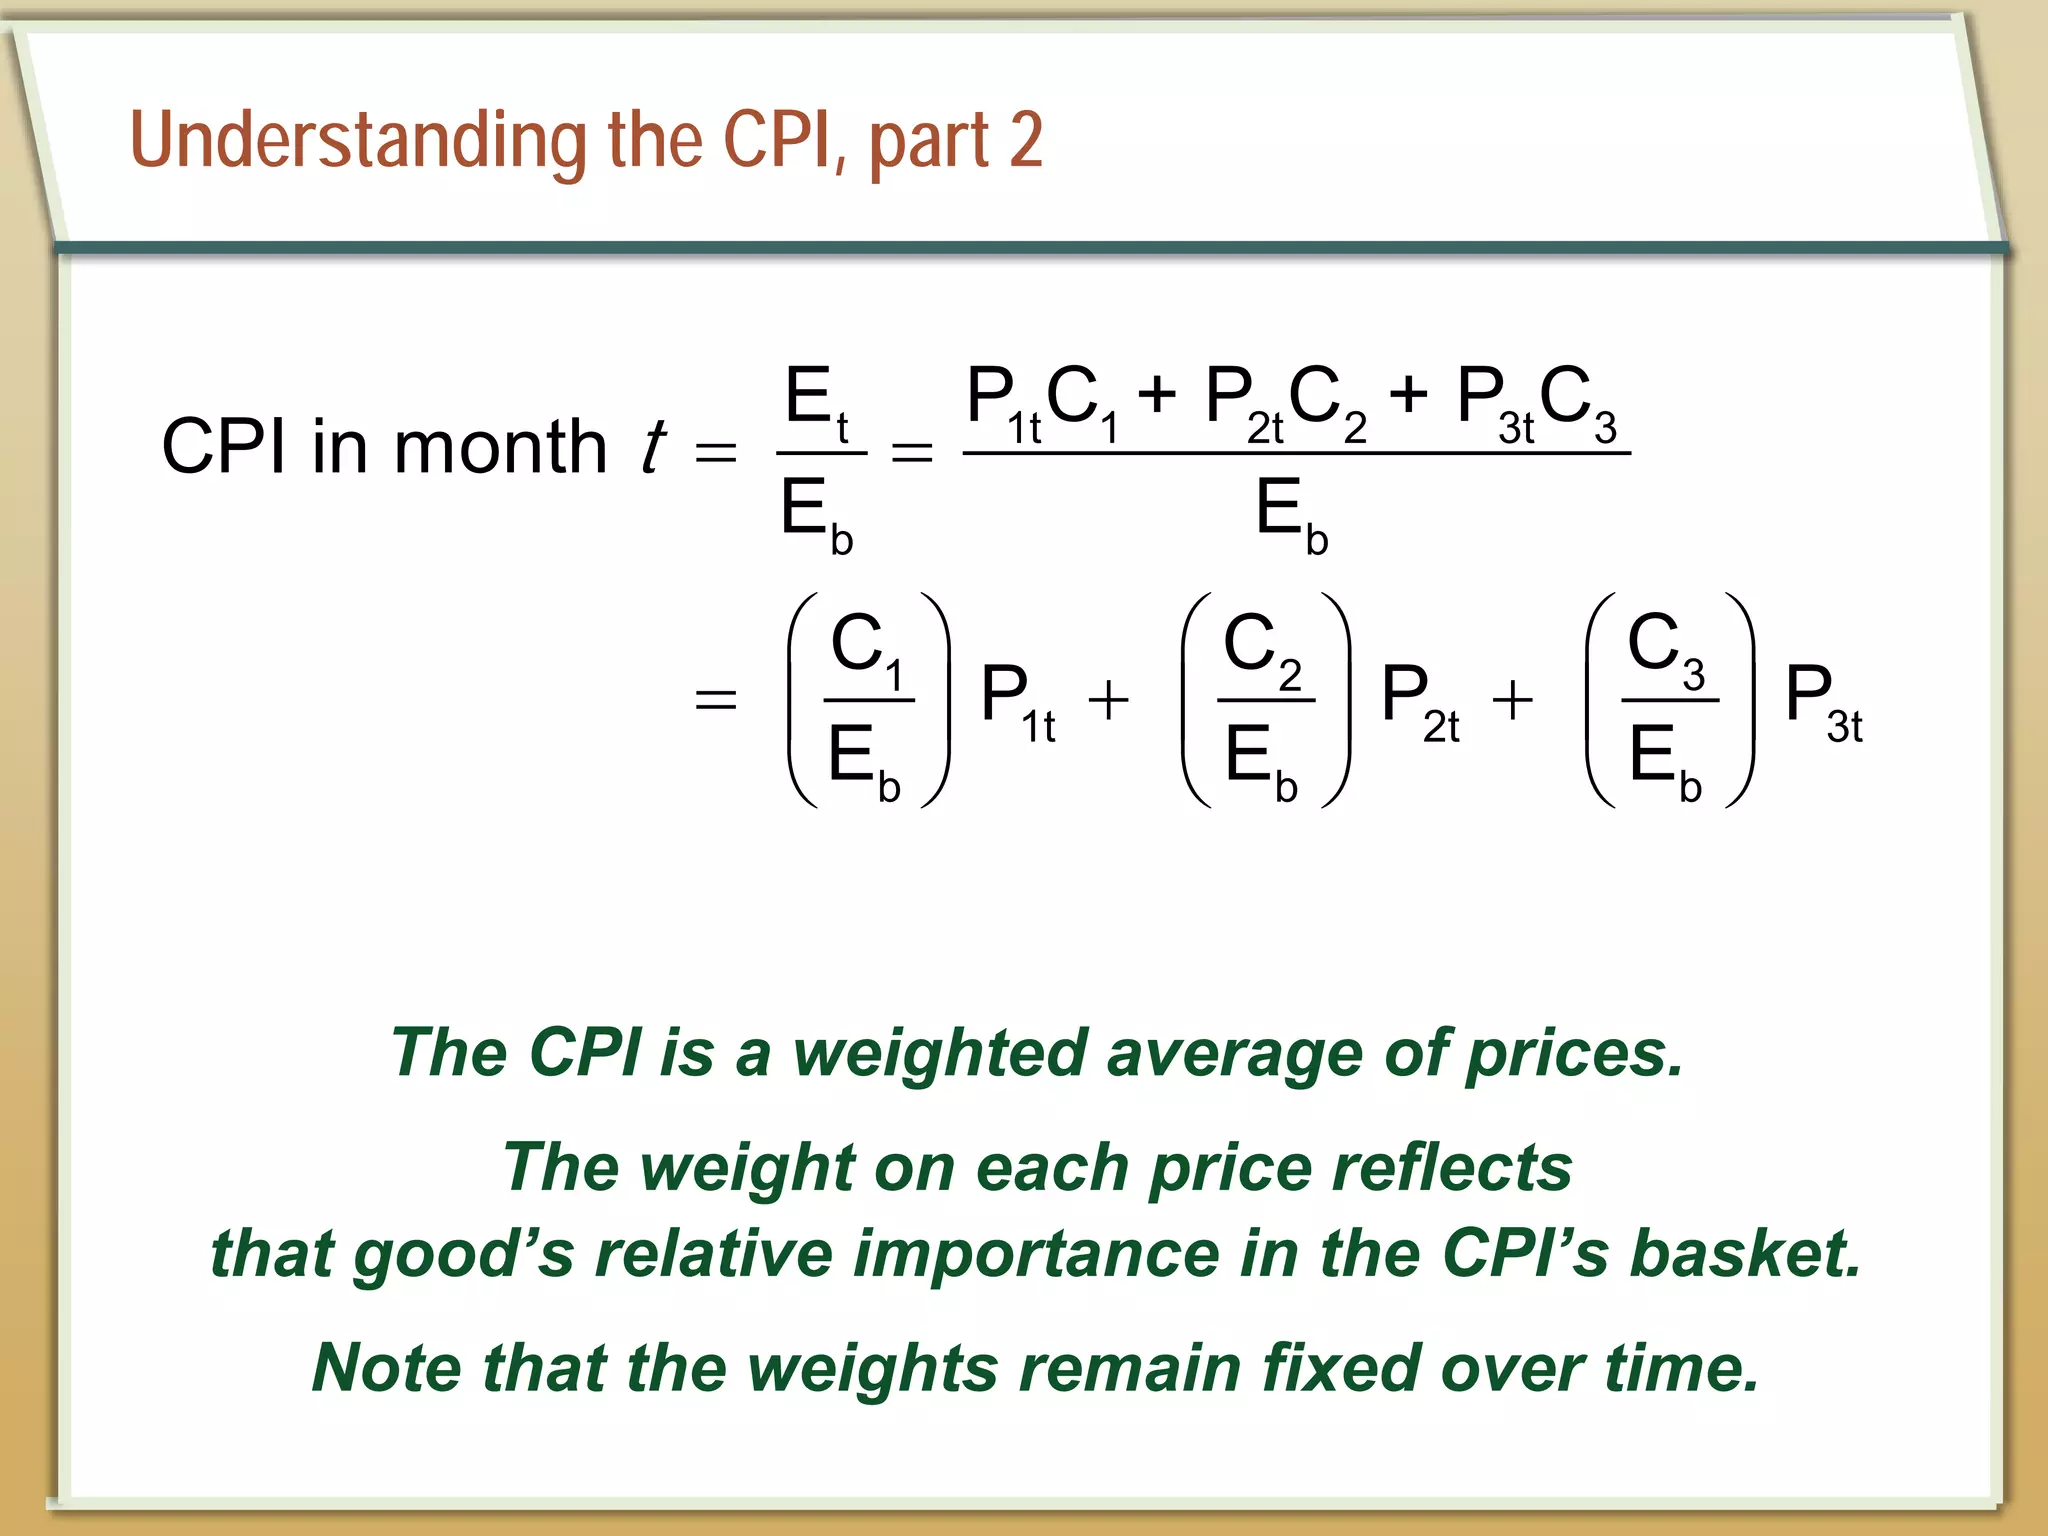
Understanding the CPI,part 2
= =
= + +
t 1t 1 2t 2 3t 3
b b
3
1 2
1t 2t 3t
b b b
E P C + P C + P C
CPI in month
E E
C
C C
P P P
E E E
t
The CPI is a weighted average of prices.
The weight on each price reflects
that good’s relative importance in the CPI’s basket.
Note that the weights remain fixed over time.
47.
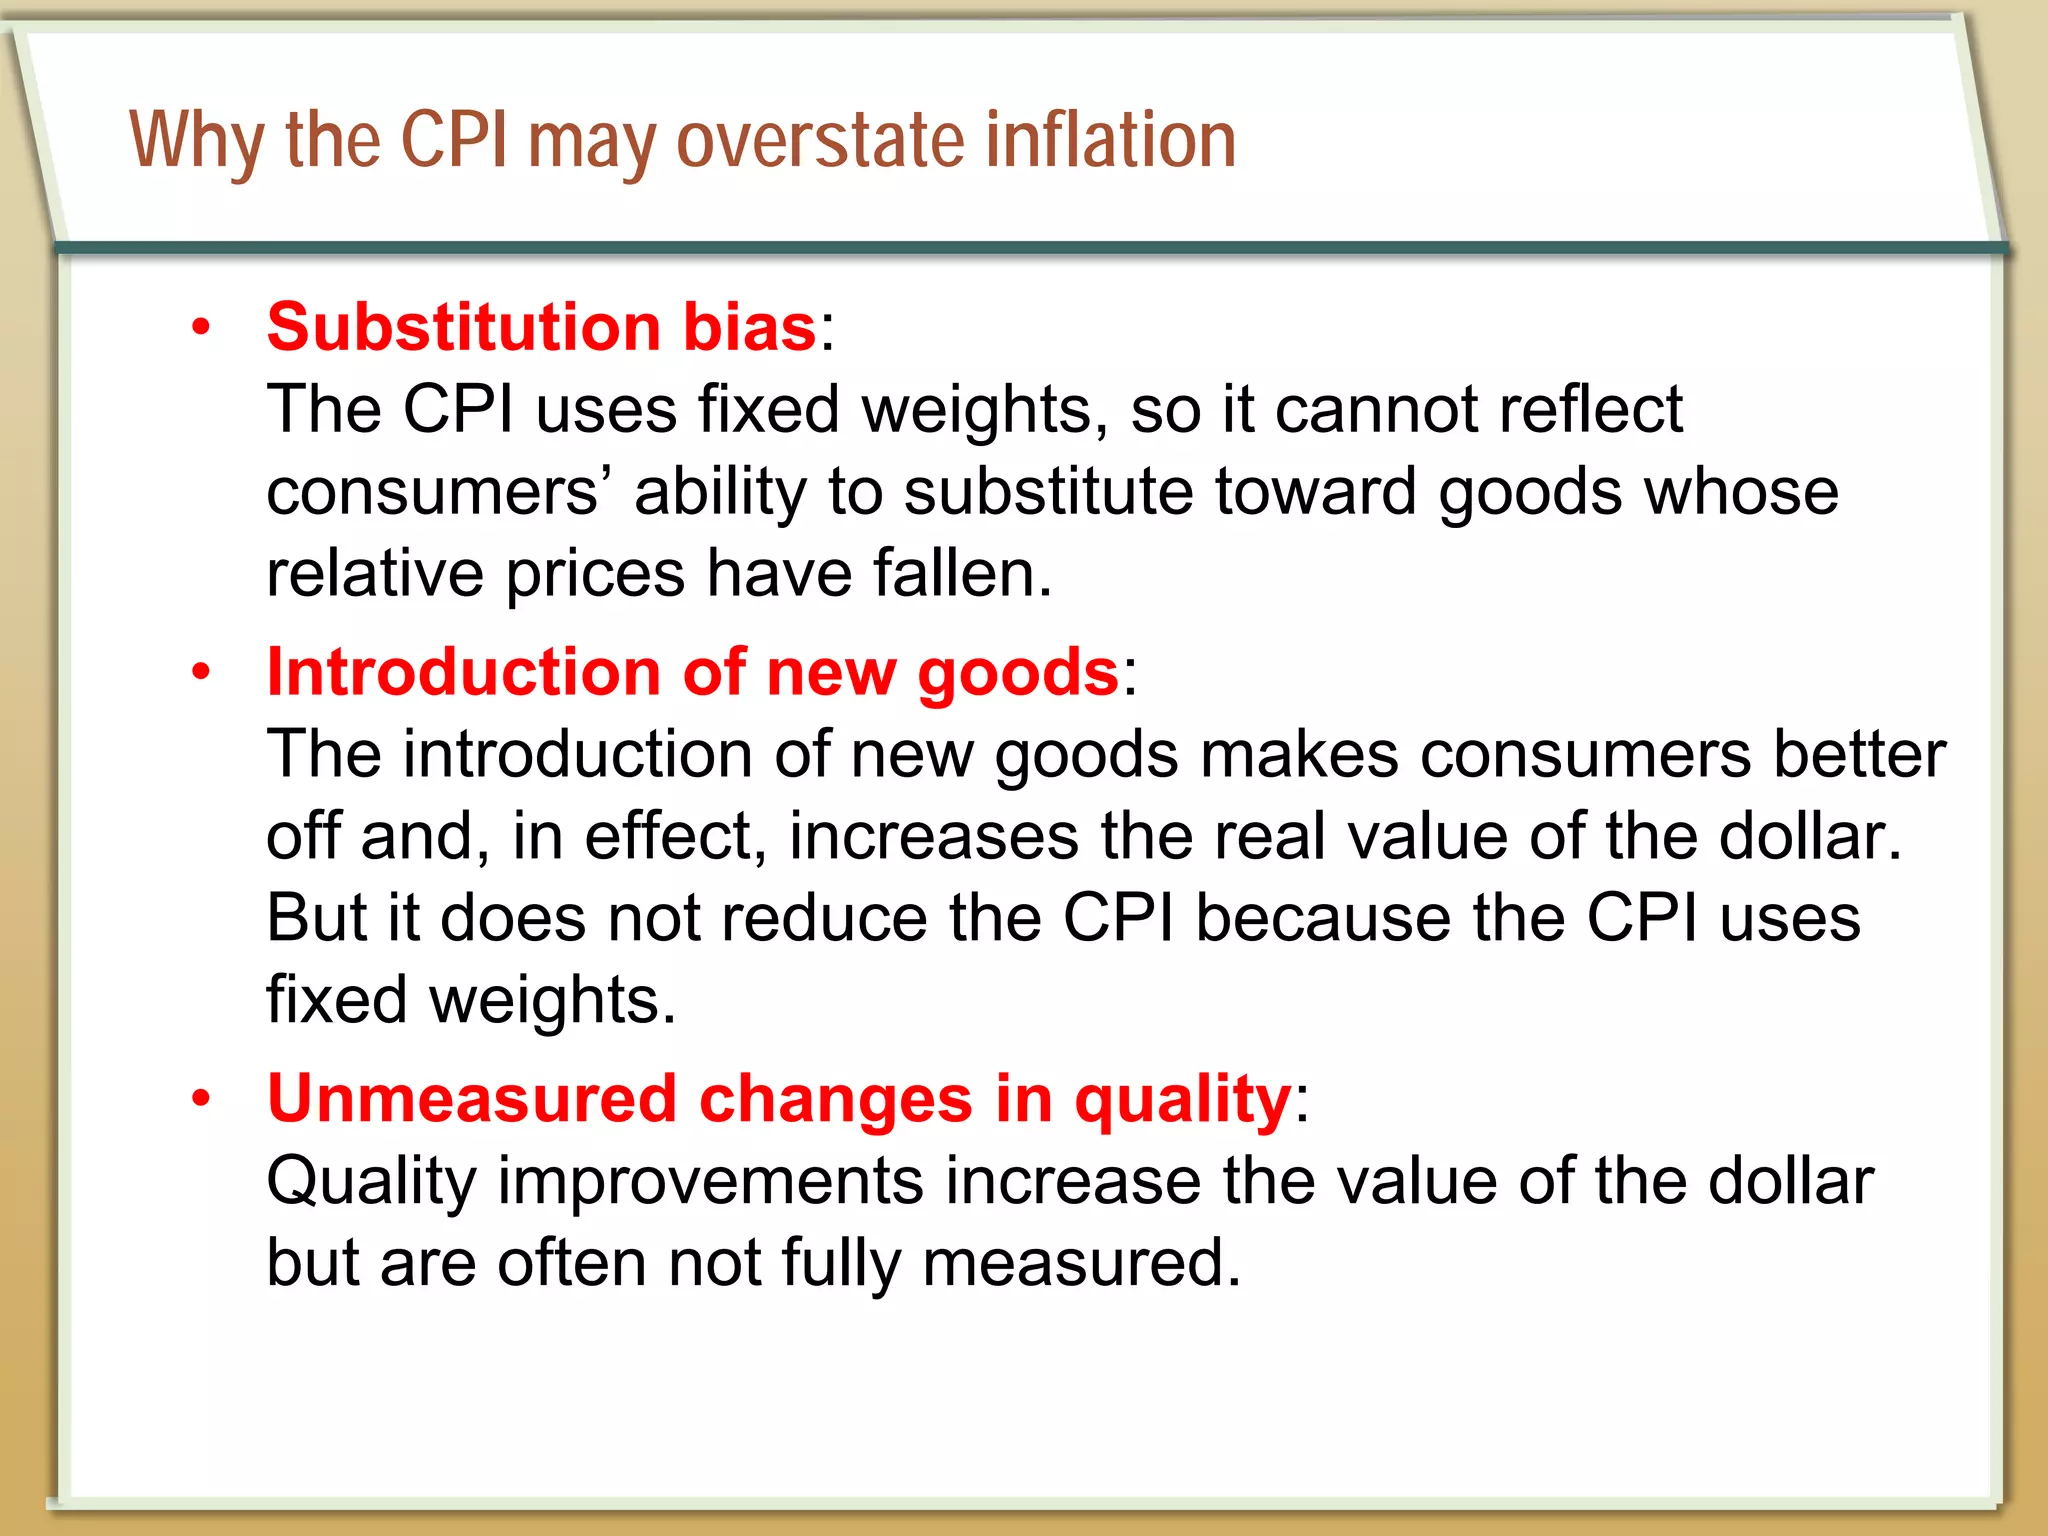
Why the CPImay overstate inflation
• Substitution bias:
The CPI uses fixed weights, so it cannot reflect
consumers’ ability to substitute toward goods whose
relative prices have fallen.
• Introduction of new goods:
The introduction of new goods makes consumers better
off and, in effect, increases the real value of the dollar.
But it does not reduce the CPI because the CPI uses
fixed weights.
• Unmeasured changes in quality:
Quality improvements increase the value of the dollar
but are often not fully measured.
48.
The size ofthe CPI’s bias
• In 1995, a Senate-appointed panel of experts estimated
that the CPI overstates inflation by about 1.1% per year.
• The BLS therefore made adjustments to reduce the bias.
• Now, the CPI’s bias is probably under 1% per year.
49.
NOW YOU TRY
Questionsfor discussion
1. If your grandmother receives Social Security, how is she
affected by the CPI’s bias?
2. Where does the government get the money to pay
COLAs to Social Security recipients?
3. If you pay income and Social Security taxes, how does
the CPI’s bias affect you?
4. Is the government giving your grandmother too much of
a COLA?
5. How does your grandmother’s “basket” differ from the
CPI’s? Does this affect your answer to Q4?
50.
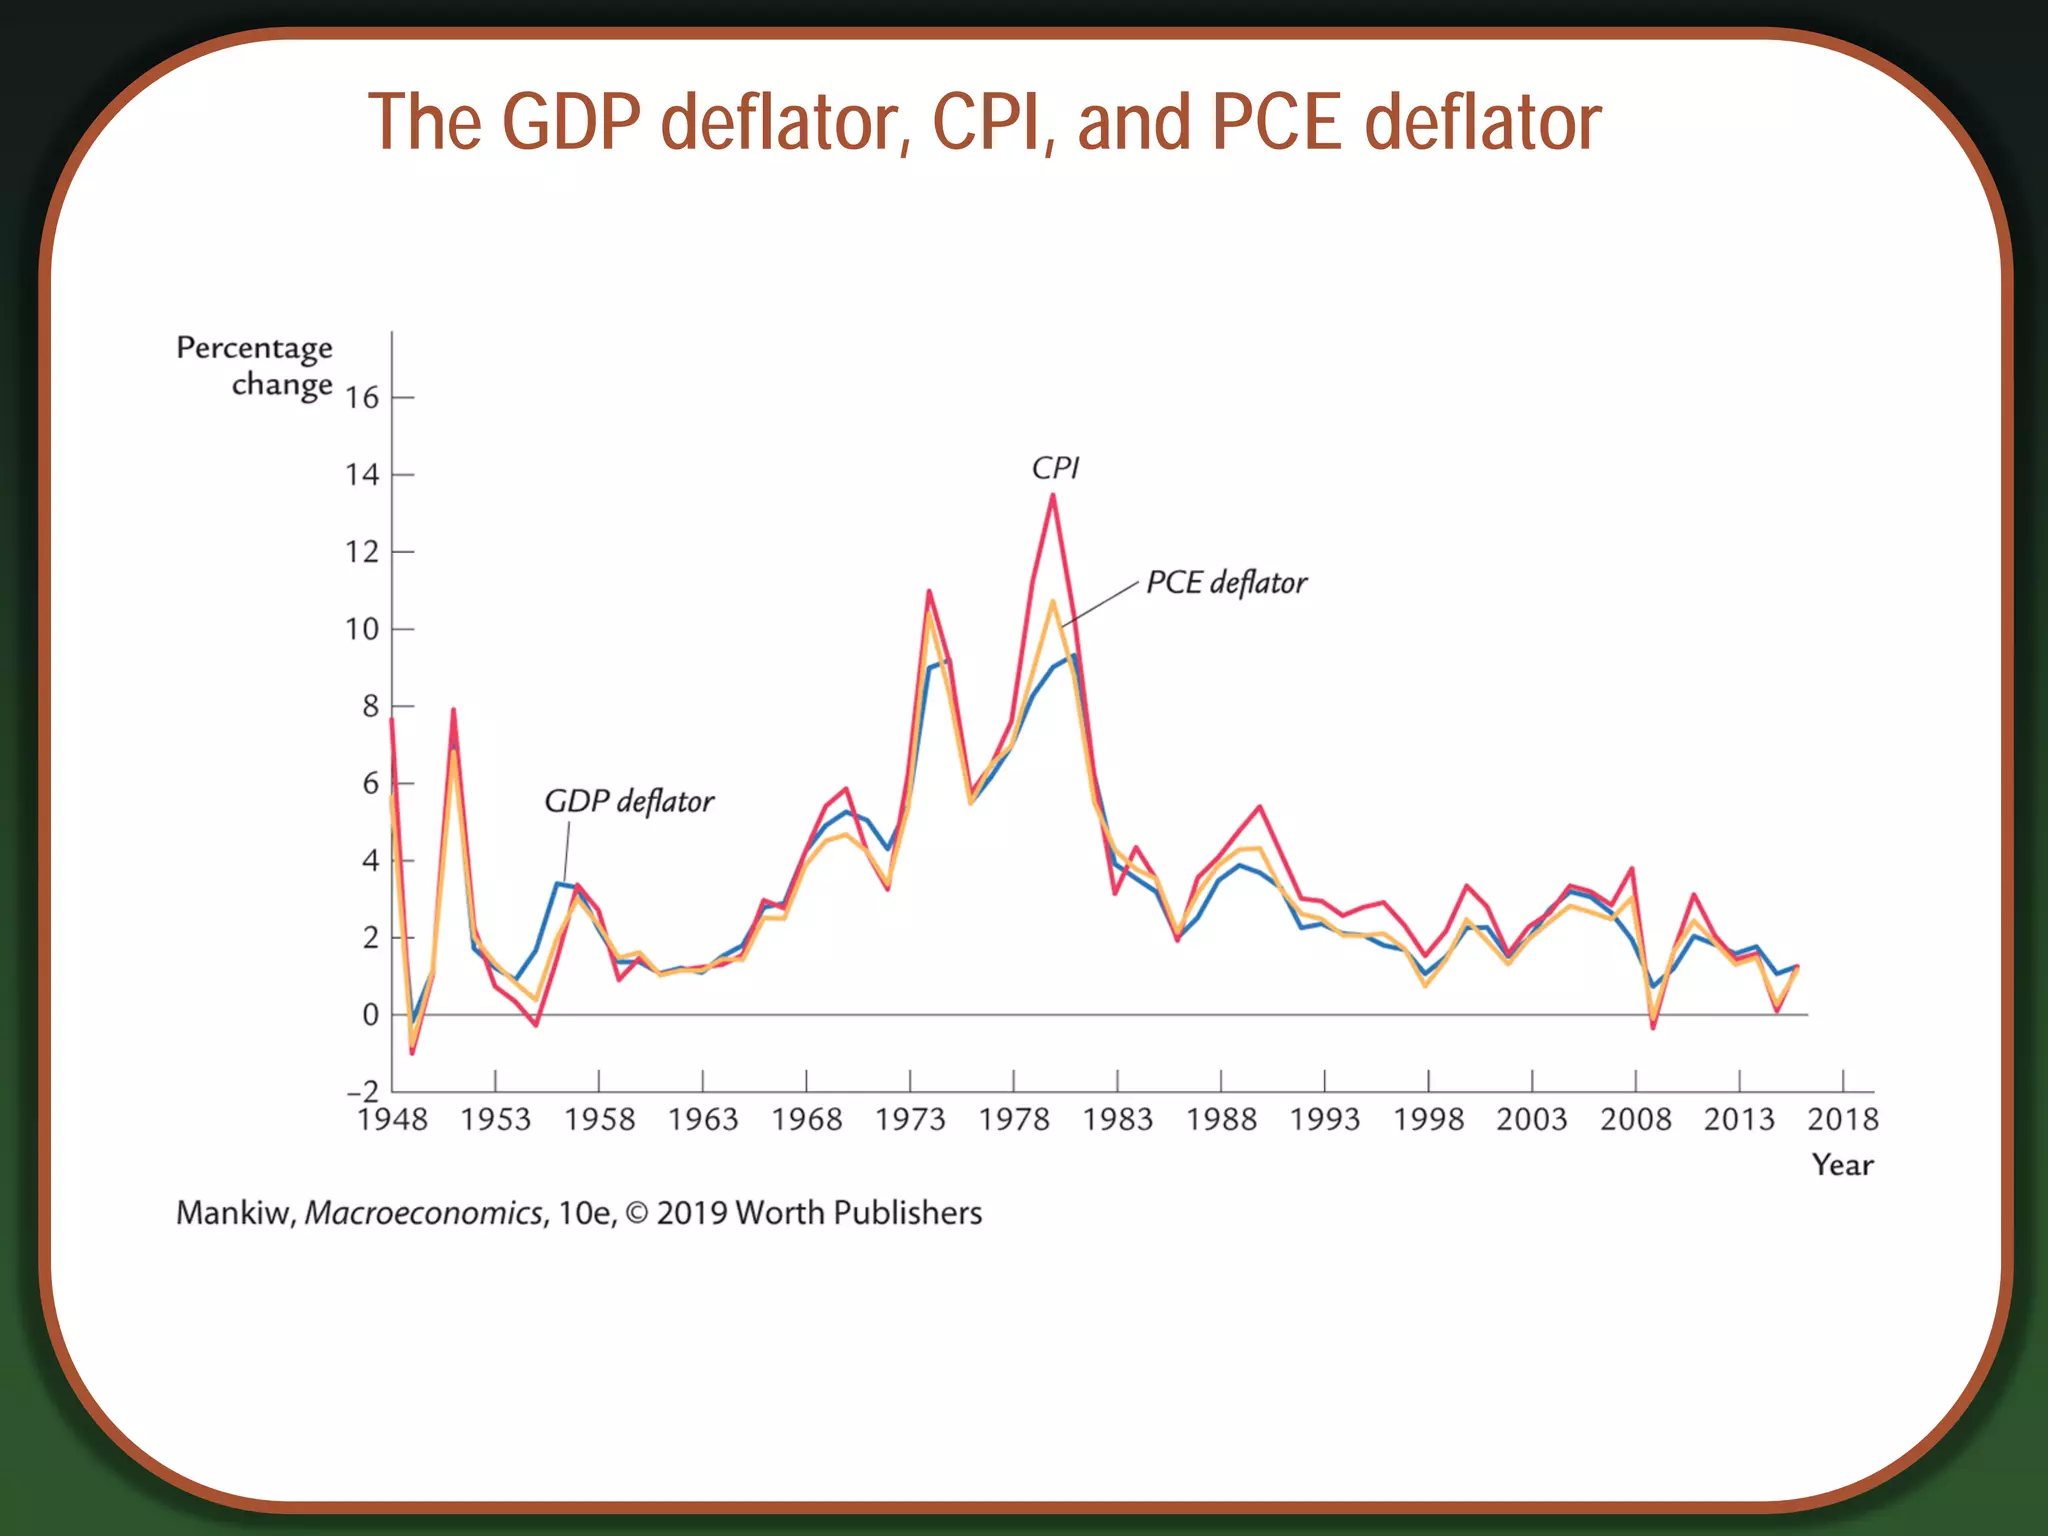
CPI vs. GDPdeflator
Prices of capital goods:
• included in GDP deflator (if produced domestically)
• excluded from CPI
Prices of imported consumer goods:
• included in CPI
• excluded from GDP deflator
The basket of goods:
• CPI: fixed
• GDP deflator: changes every year
51.
The PCE deflator
•Another measure of the price level: personal consumption
expenditures (PCE) deflator, the ratio of nominal to real
consumer spending
• How the PCE is like the CPI:
- only includes consumer spending
- includes imported consumer goods
• How the PCE is like the GDP deflator:
- the “basket” changes over time
• The Federal Reserve prefers PCE.
Categories of thepopulation
• Employed
working at a paid job
• Unemployed
not employed but looking for a job
• Labor force
the amount of labor available for producing goods and
services; all employed plus unemployed persons
• Not in the labor force
not employed, not looking for work
54.
Two important labor-forceconcepts
• Unemployment rate
percentage of the labor force that is unemployed
• Labor-force participation rate
fraction of the adult population that “participates” in the
labor force—that is, is working or looking for work
55.
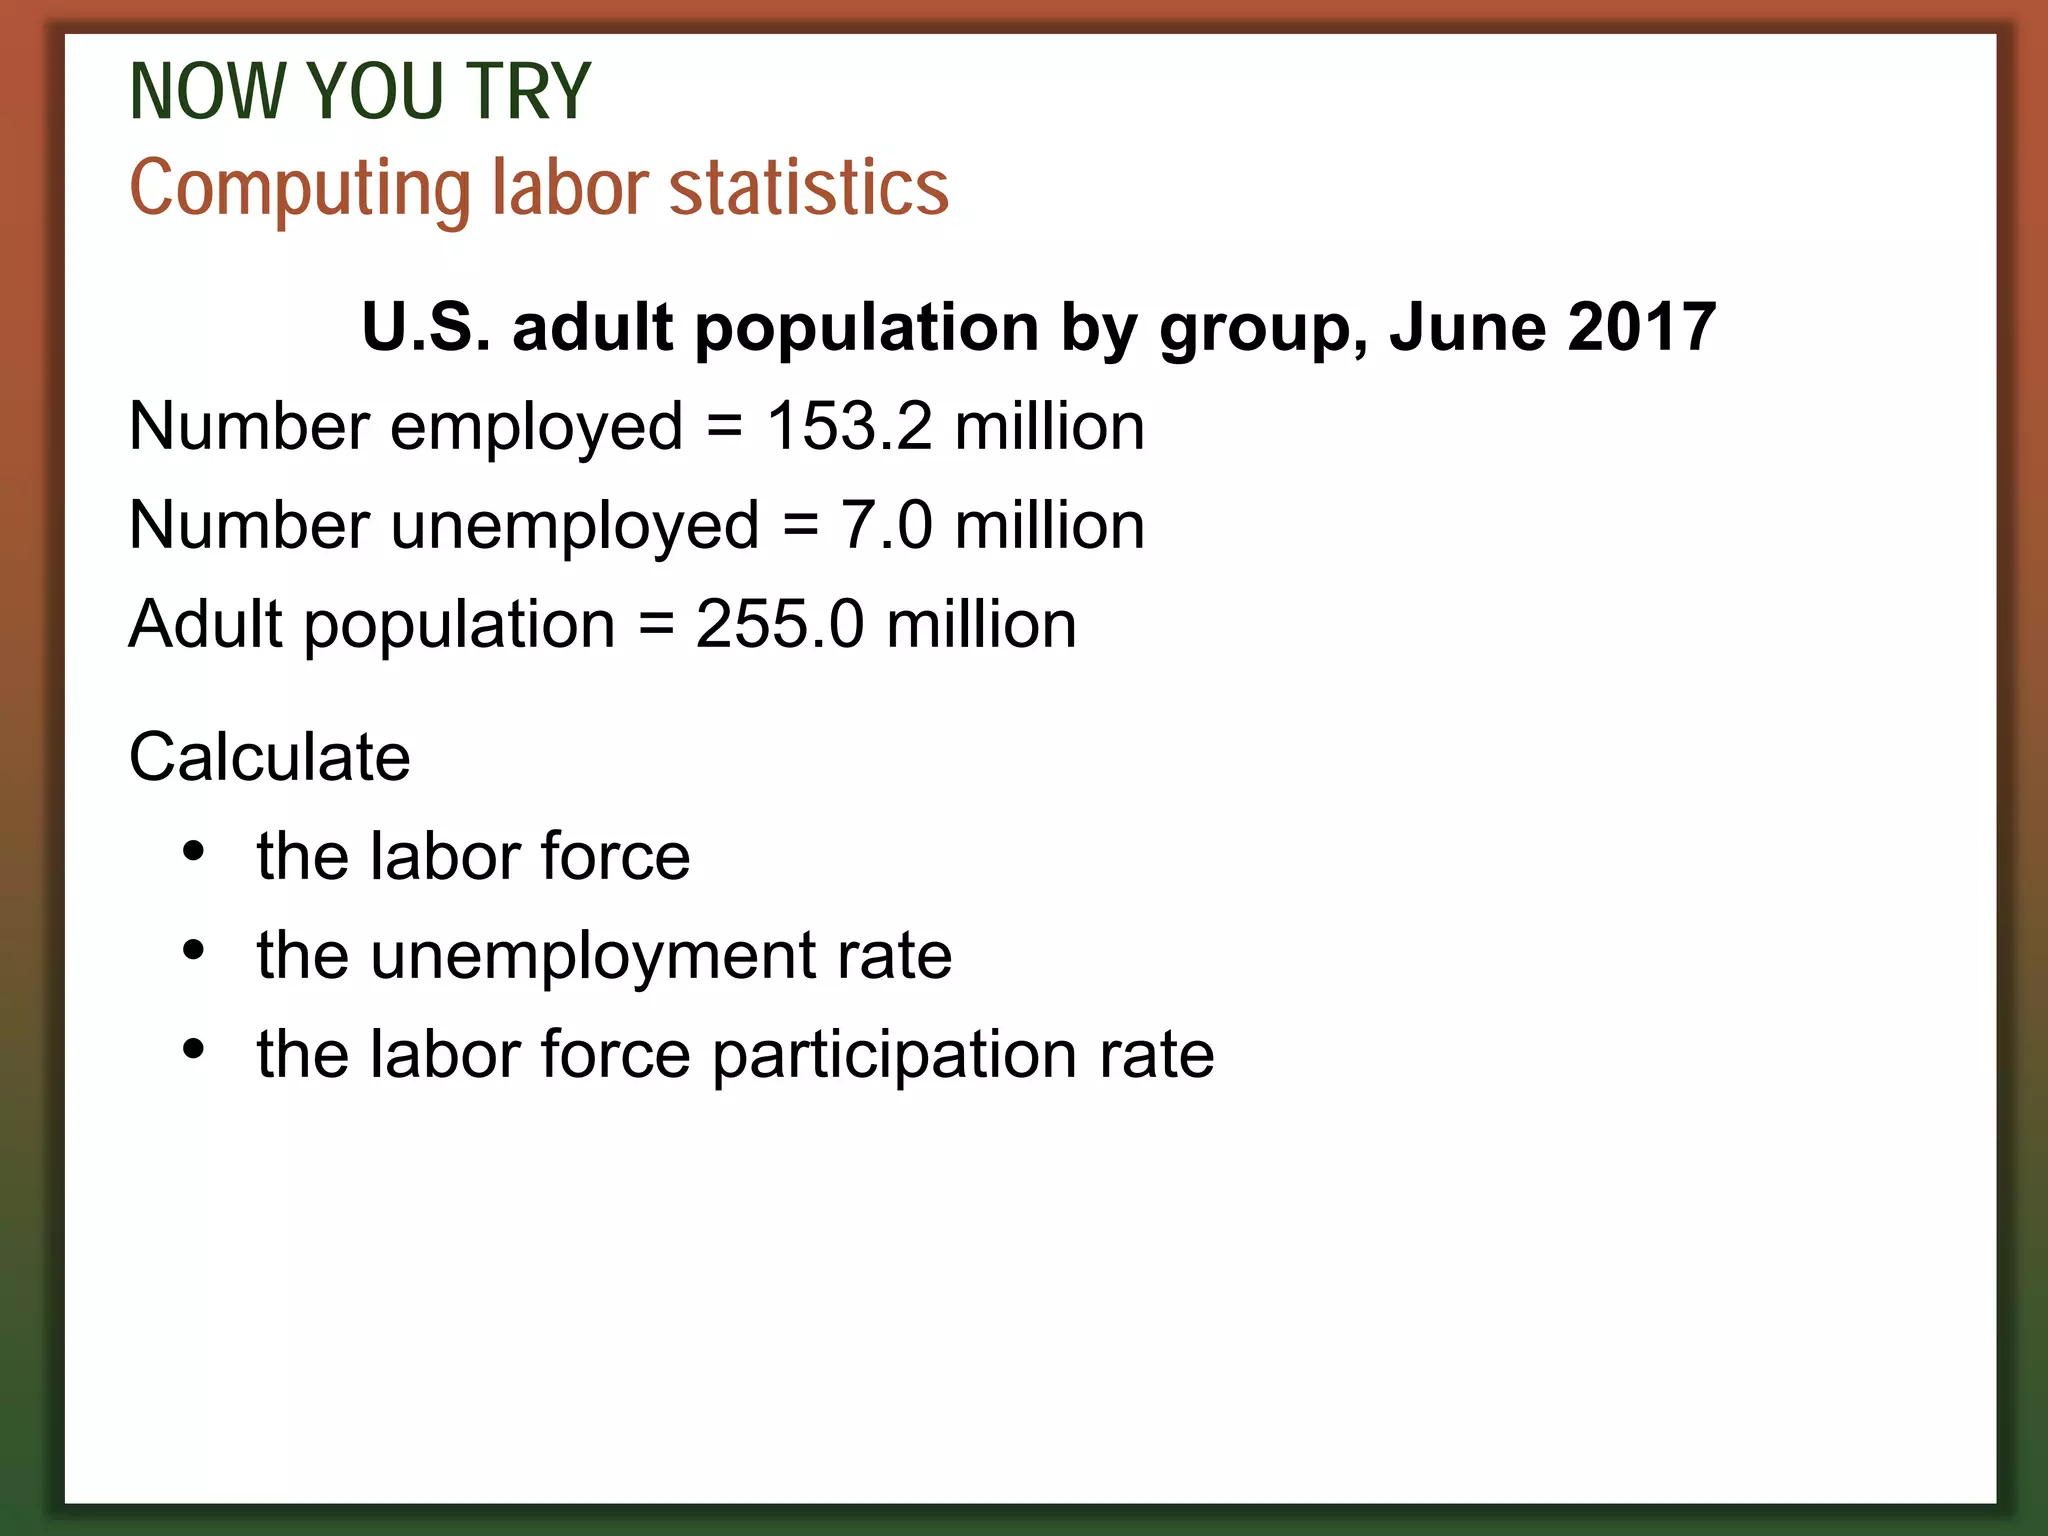
NOW YOU TRY
Computinglabor statistics
U.S. adult population by group, June 2017
Number employed = 153.2 million
Number unemployed = 7.0 million
Adult population = 255.0 million
Calculate
• the labor force
• the unemployment rate
• the labor force participation rate
56.
NOW YOU TRY
Computinglabor statistics, answers
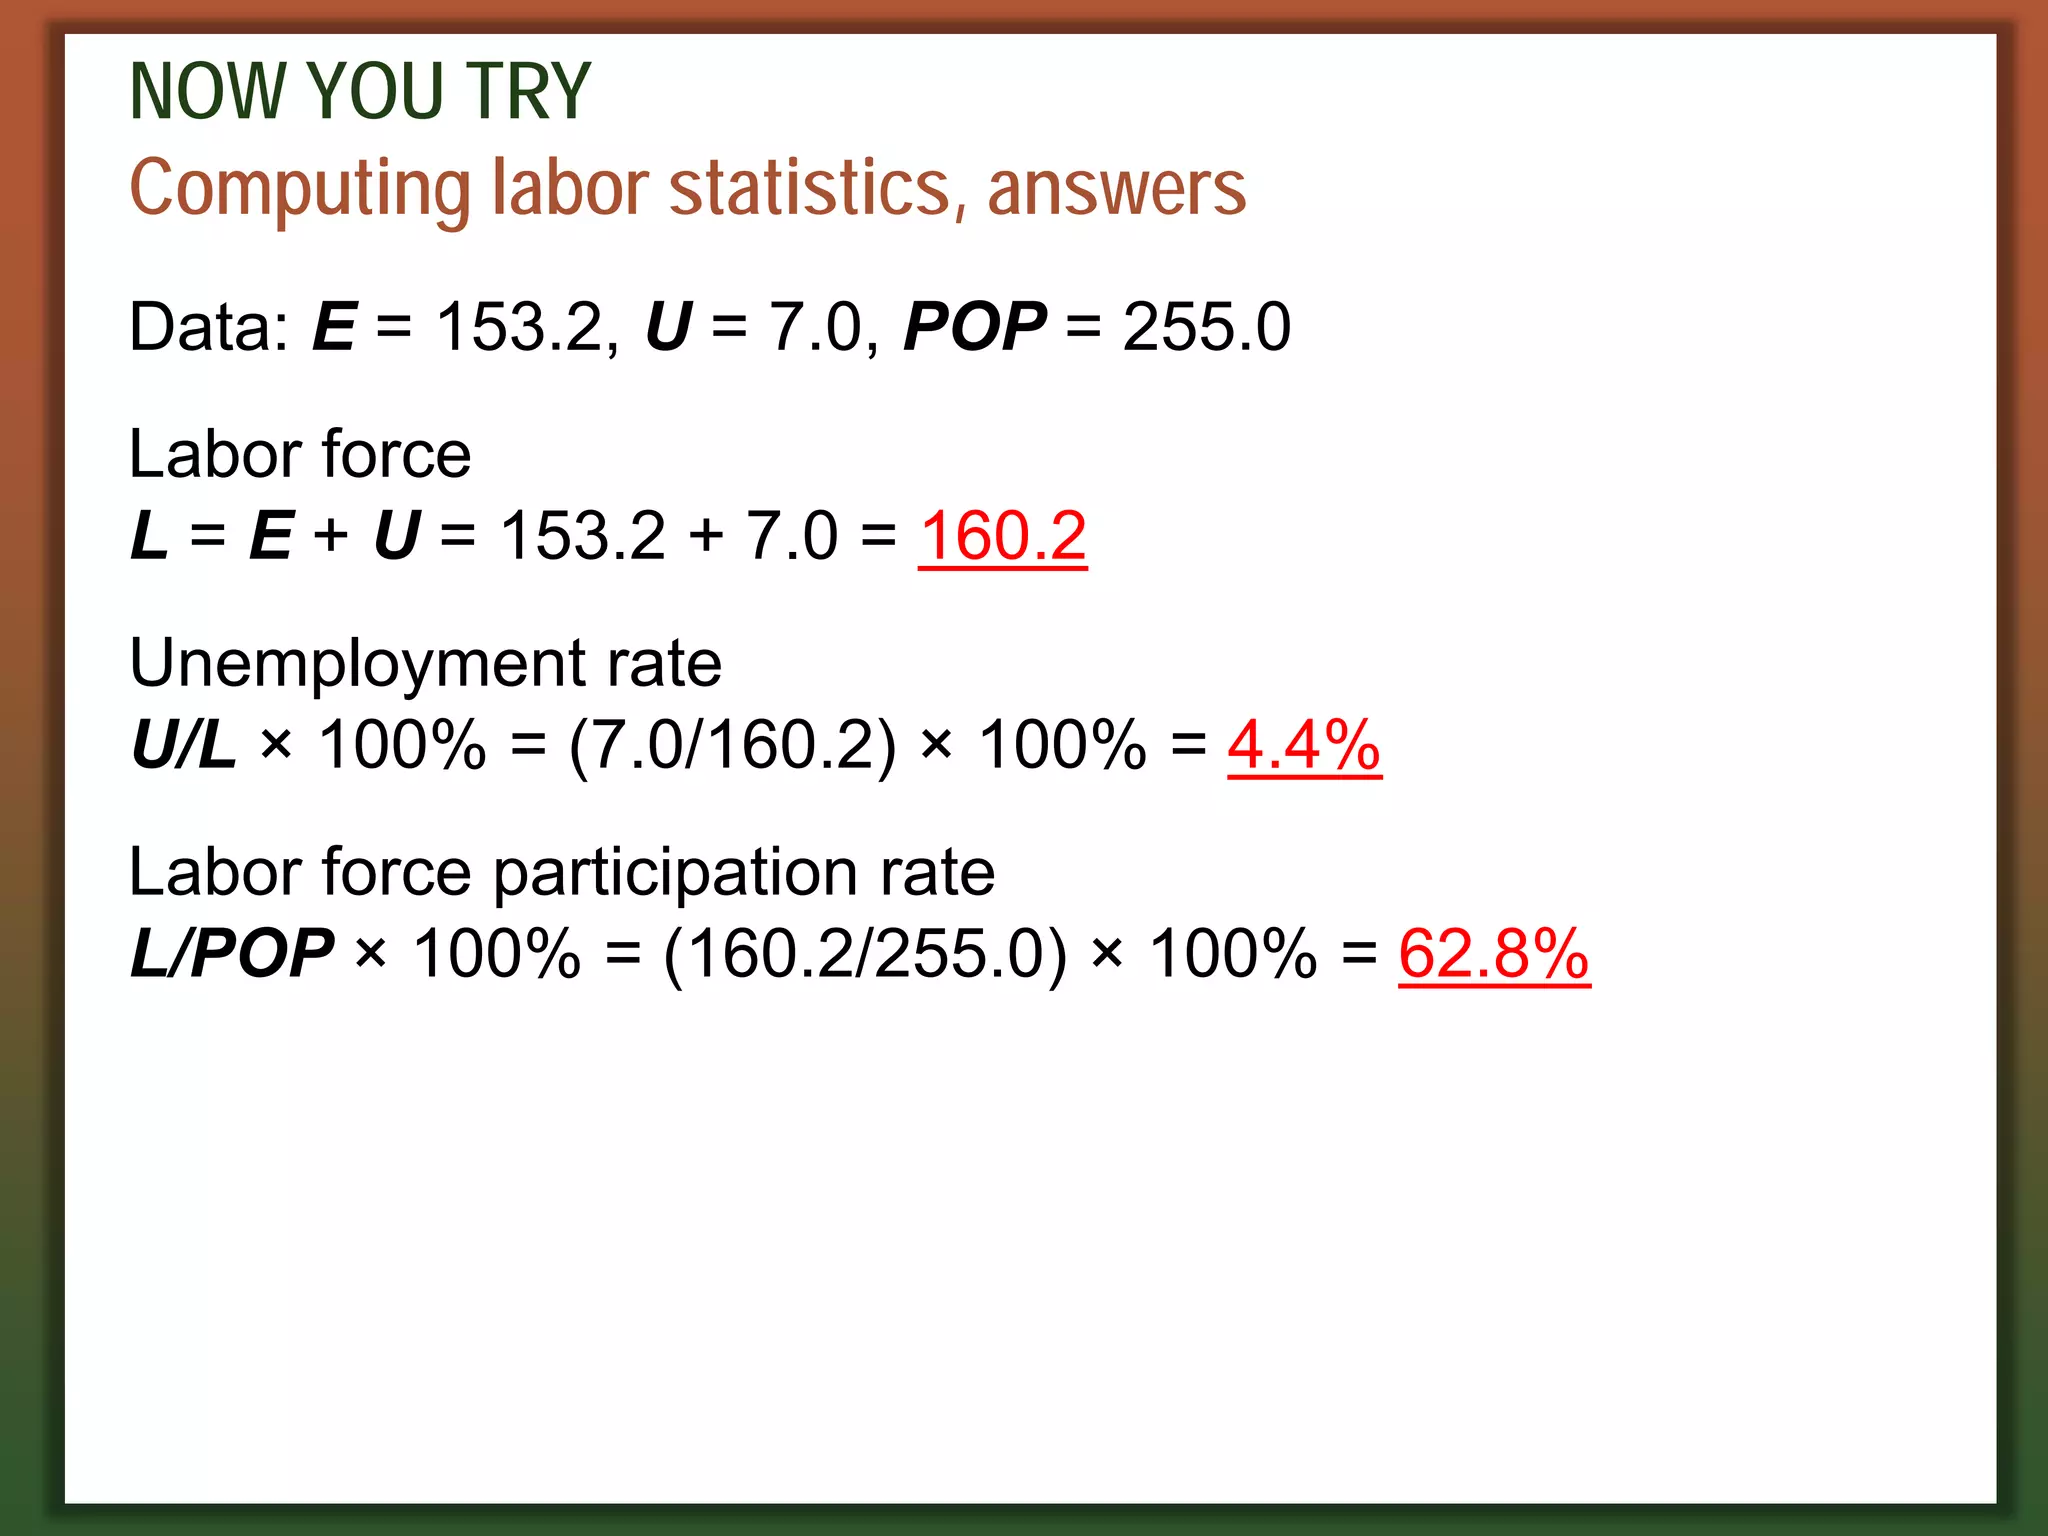
Data: E = 153.2, U = 7.0, POP = 255.0
Labor force
L = E + U = 153.2 + 7.0 = 160.2
Unemployment rate
U/L × 100% = (7.0/160.2) × 100% = 4.4%
Labor force participation rate
L/POP × 100% = (160.2/255.0) × 100% = 62.8%
57.
NOW YOU TRY
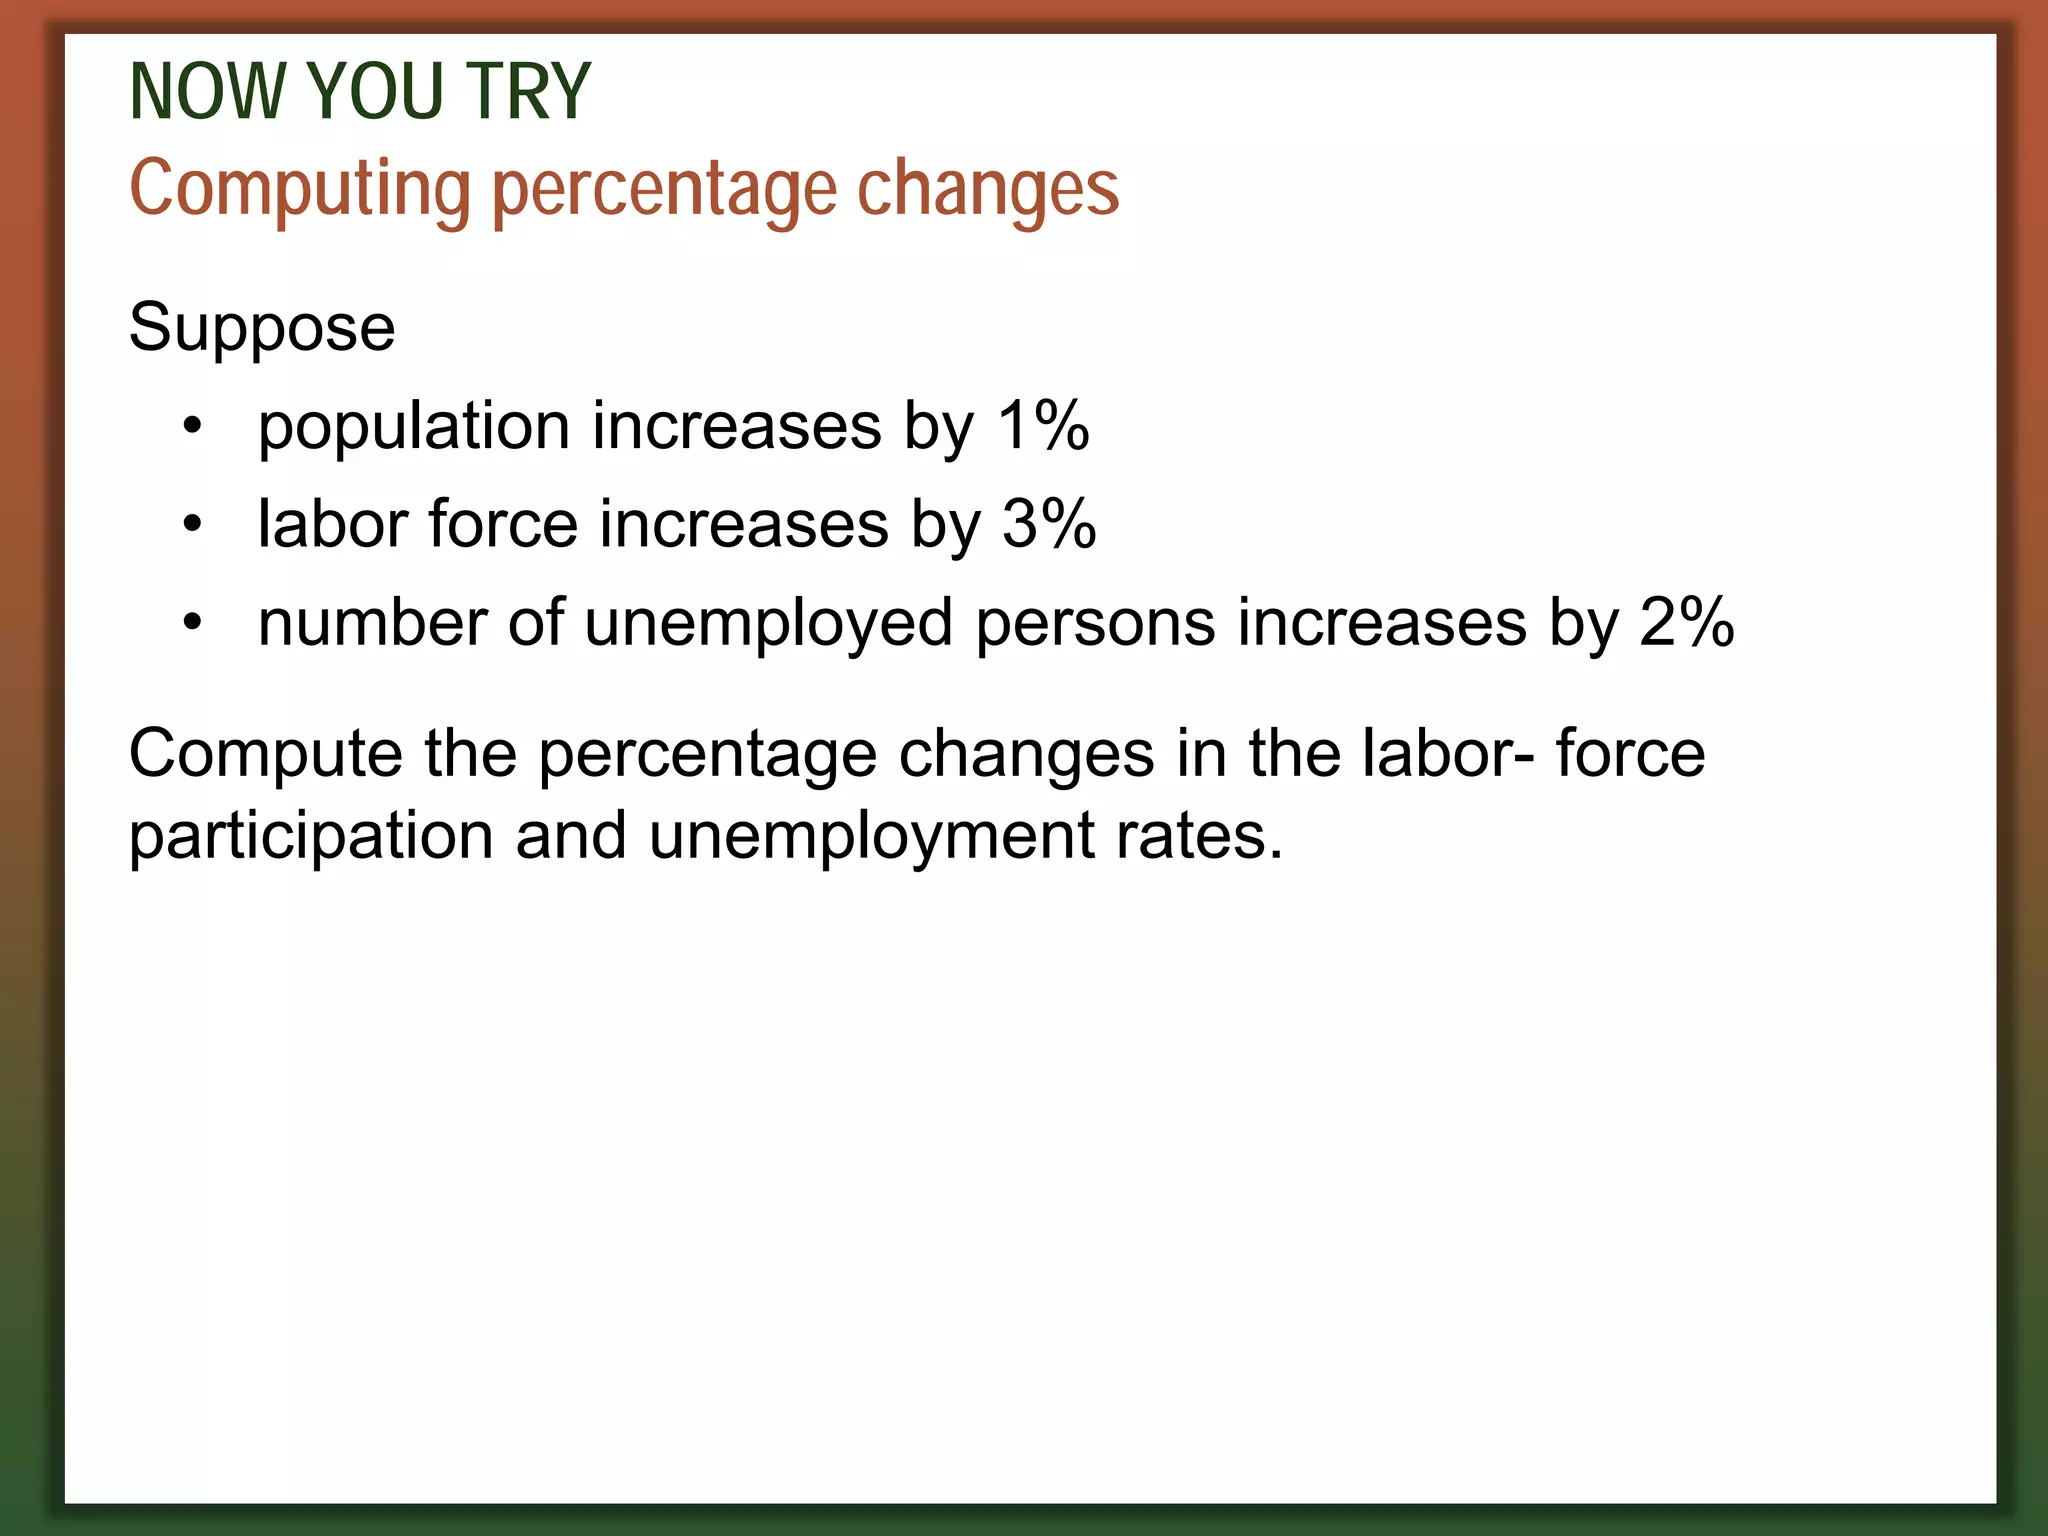
Computingpercentage changes
Suppose
• population increases by 1%
• labor force increases by 3%
• number of unemployed persons increases by 2%
Compute the percentage changes in the labor- force
participation and unemployment rates.
58.
NOW YOU TRY
Computingpercentage changes, answers
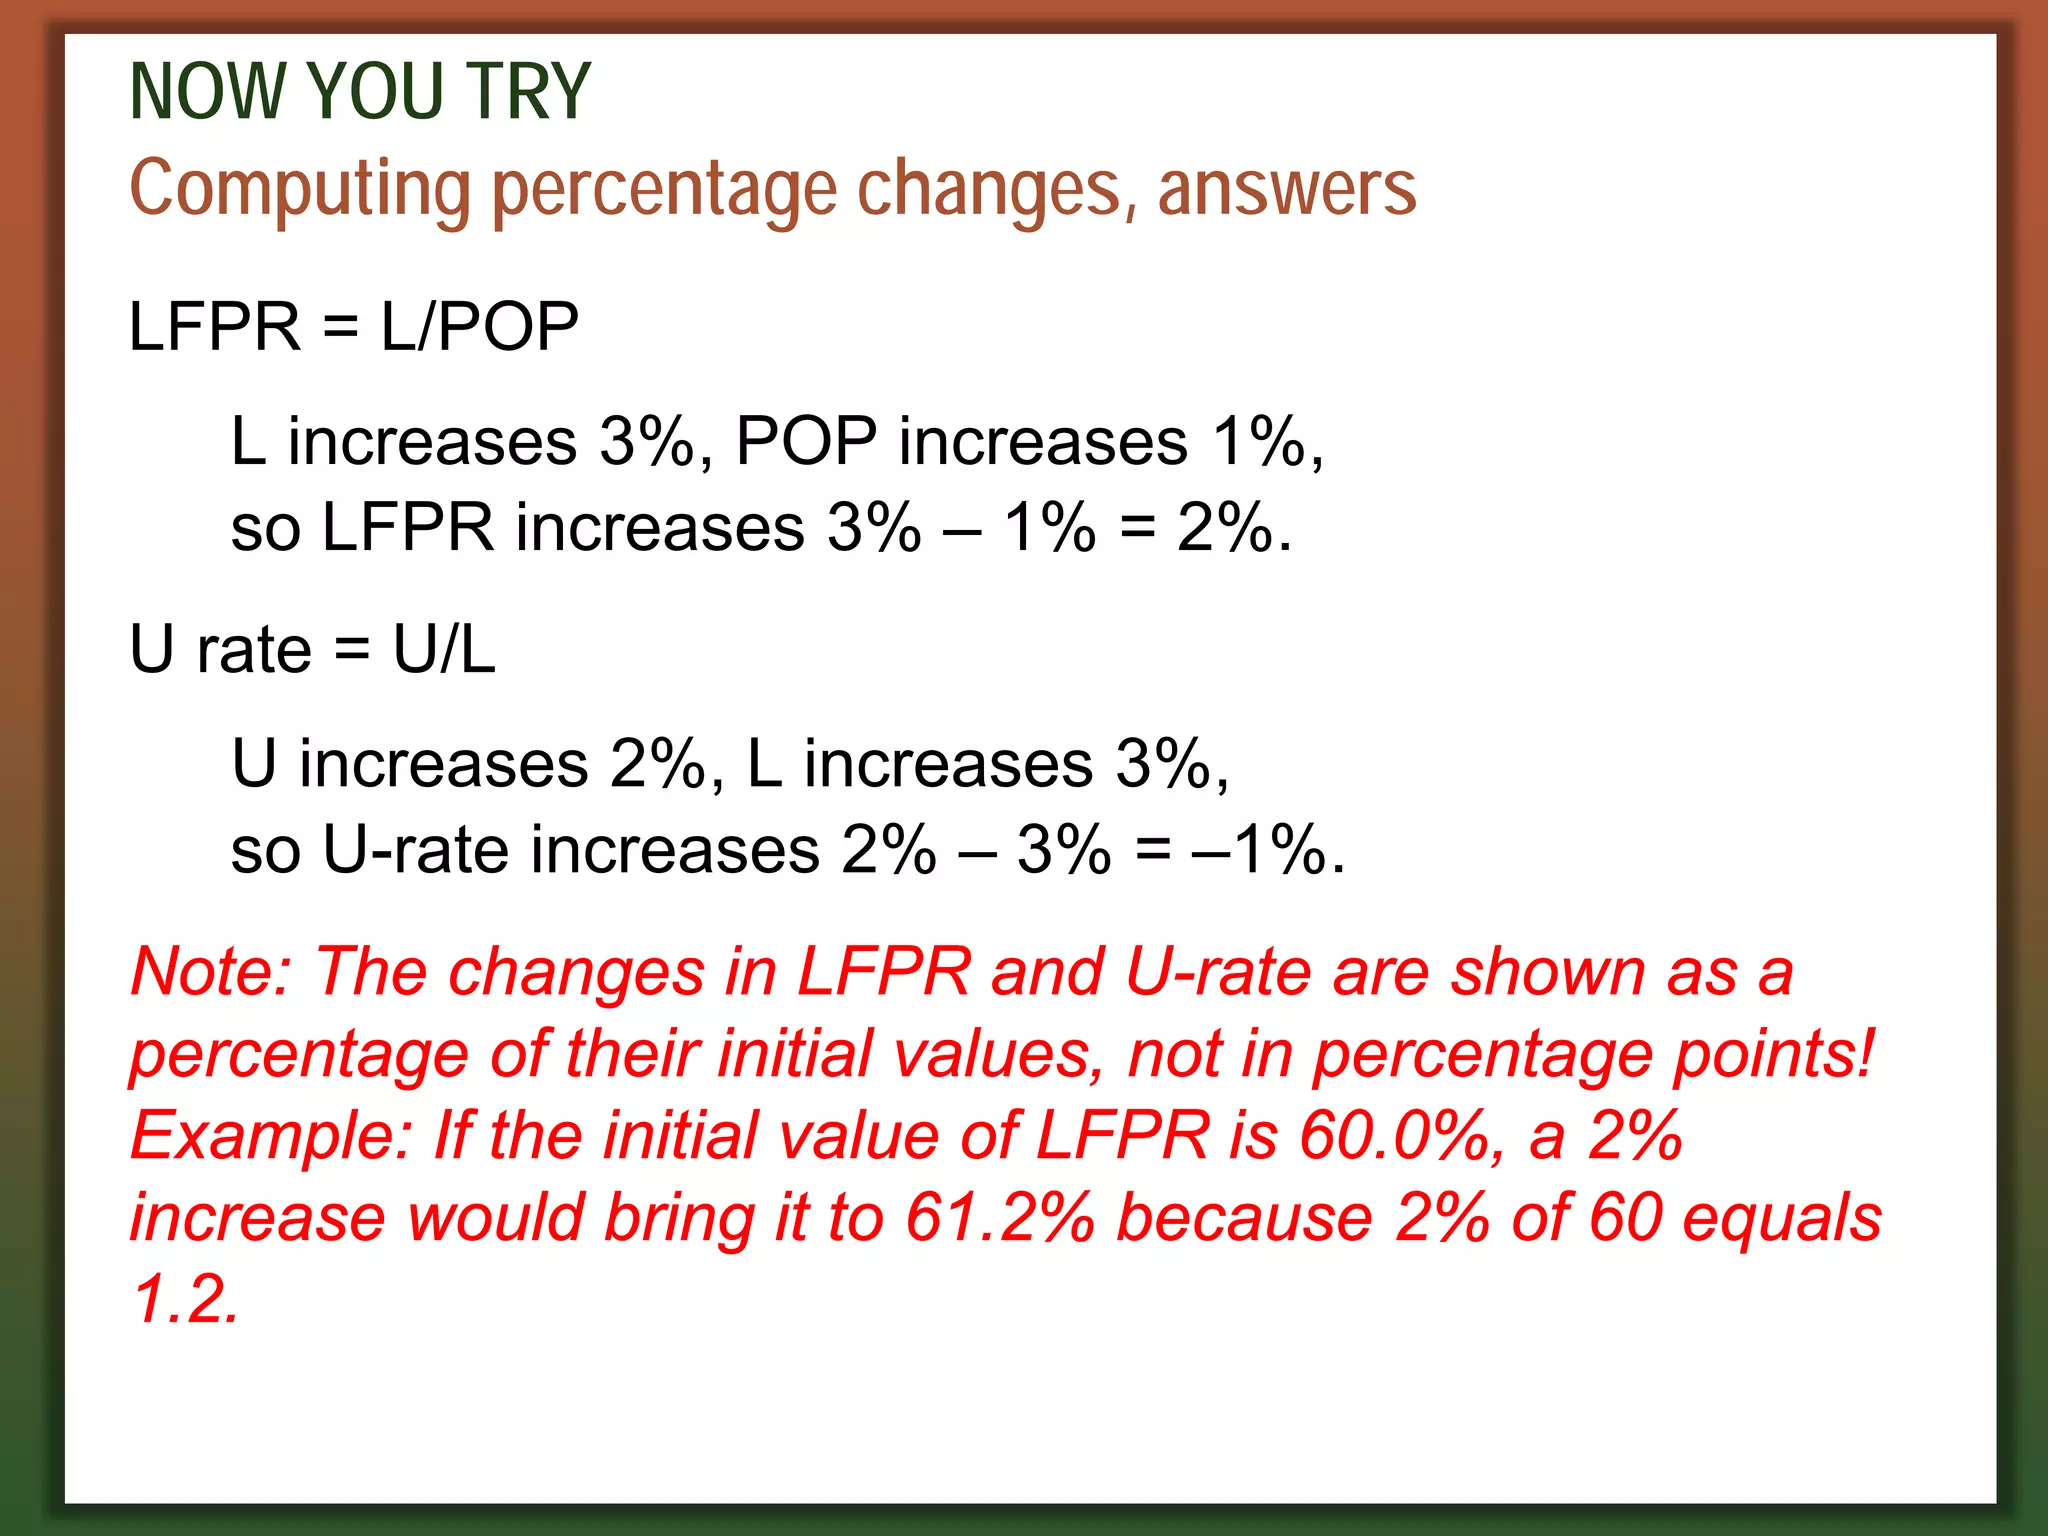
LFPR = L/POP
L increases 3%, POP increases 1%,
so LFPR increases 3% – 1% = 2%.
U rate = U/L
U increases 2%, L increases 3%,
so U-rate increases 2% – 3% = –1%.
Note: The changes in LFPR and U-rate are shown as a
percentage of their initial values, not in percentage points!
Example: If the initial value of LFPR is 60.0%, a 2%
increase would bring it to 61.2% because 2% of 60 equals
1.2.
59.
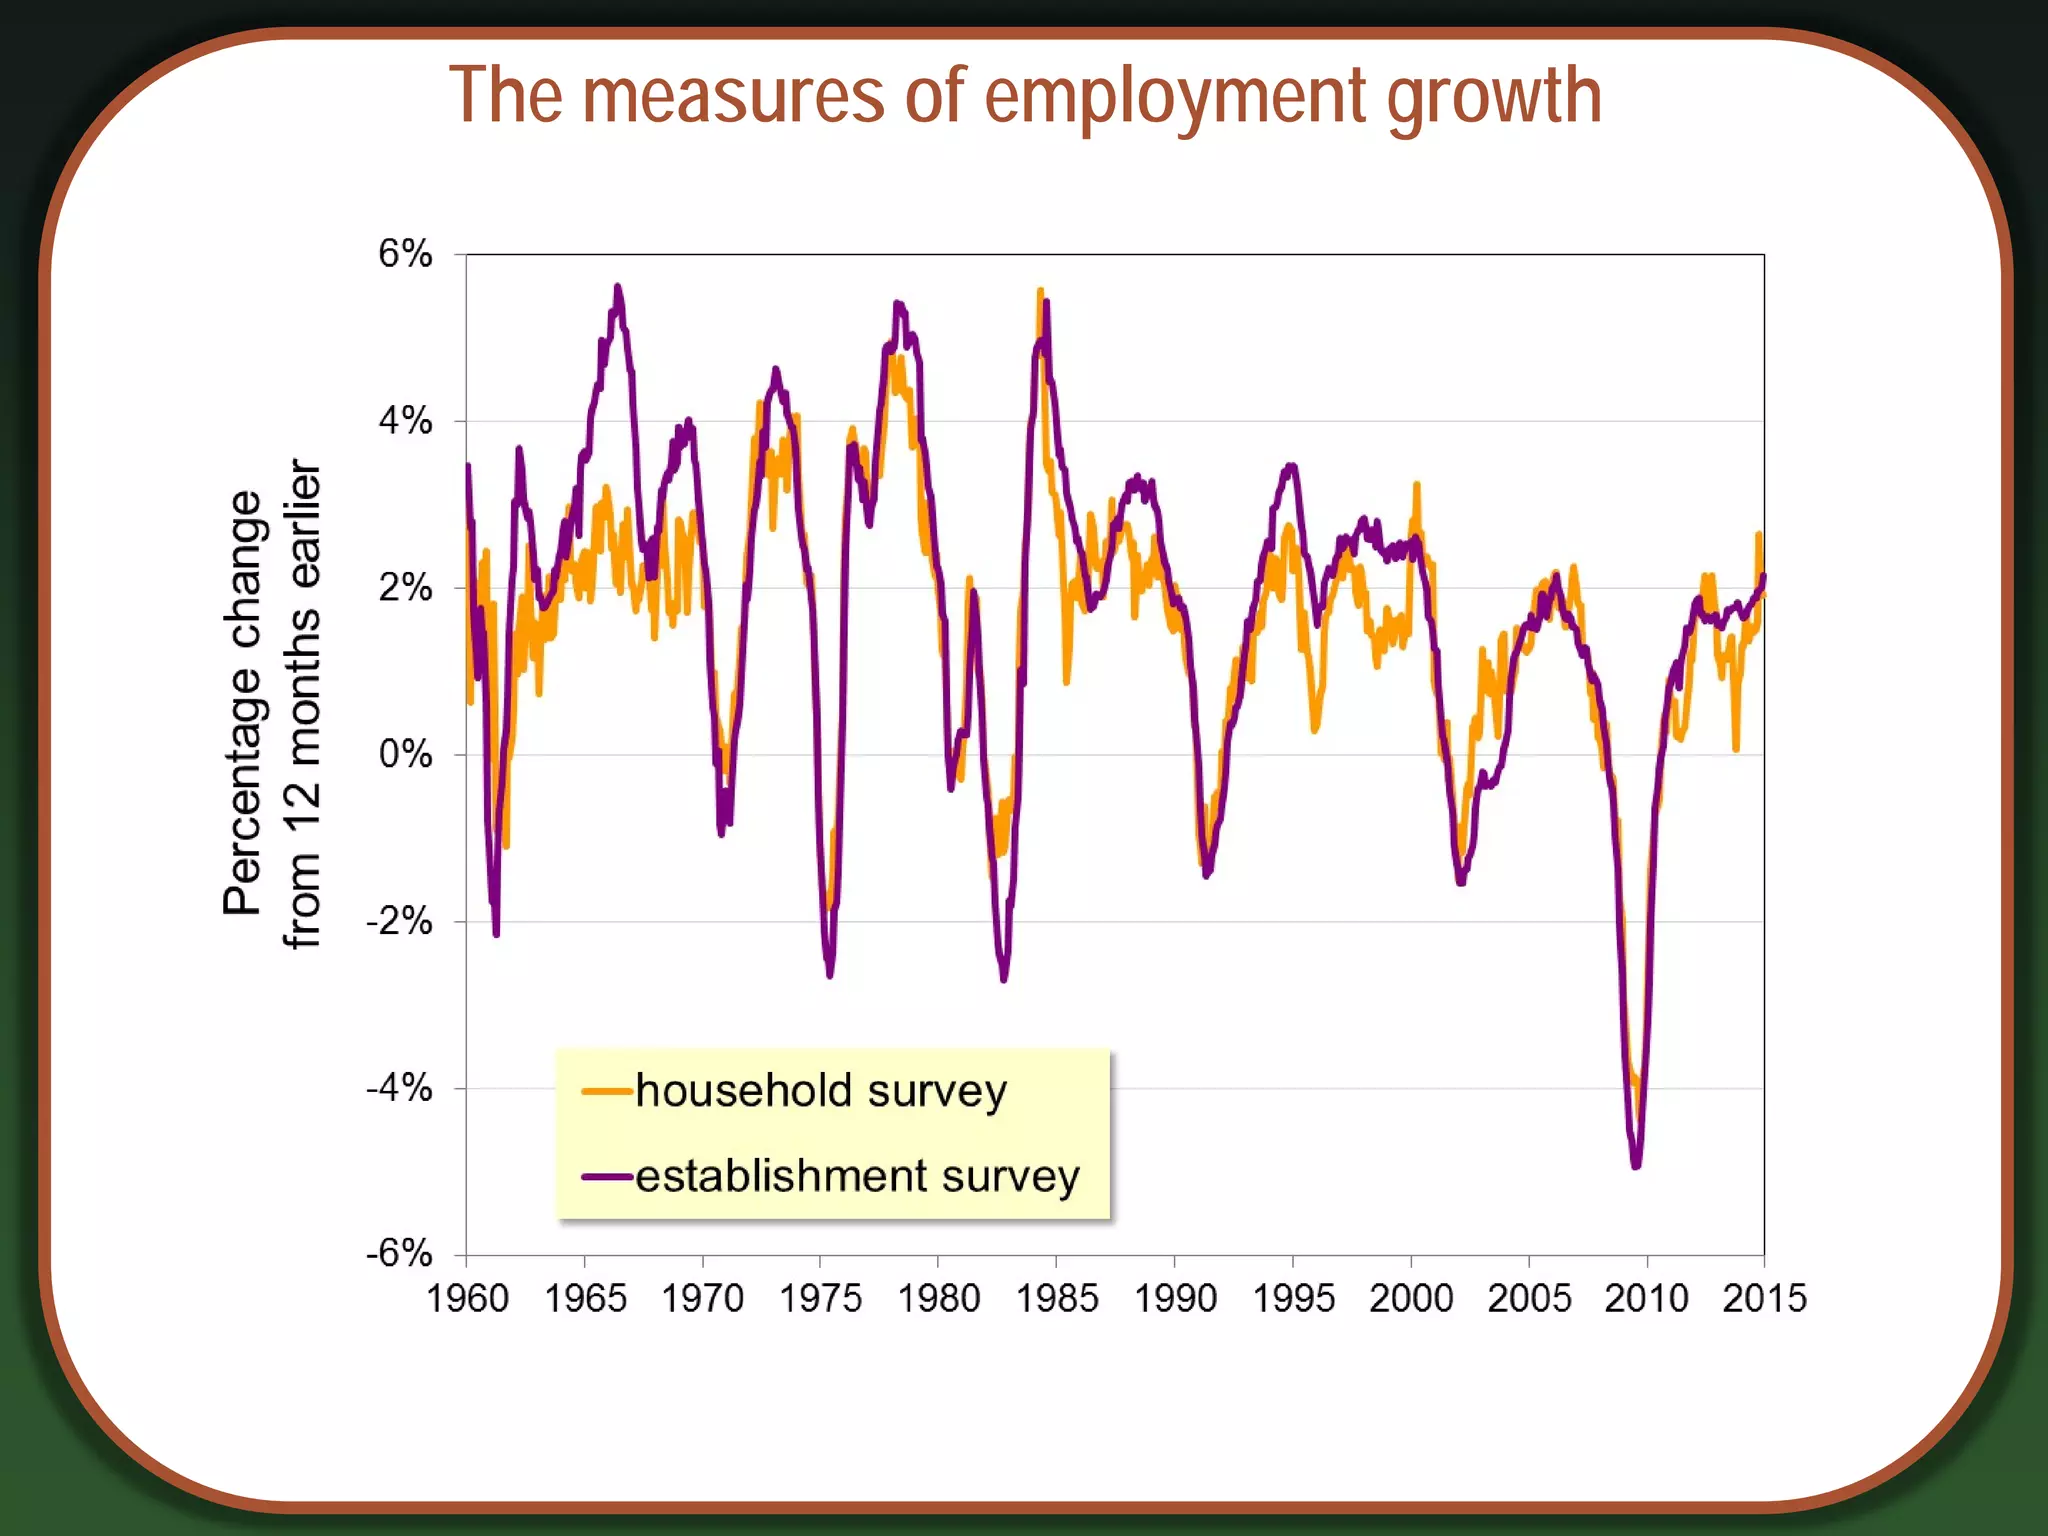
The establishment survey
•The BLS obtains a second measure of employment by
surveying businesses, asking how many workers are on
their payrolls.
• Neither measure is perfect, and they occasionally diverge
due to:
• treatment of self-employed persons
• new firms not counted in establishment survey
• technical issues involving population inferences from
sample data
CHAPTER 3 NationalIncome
CHAPTER 1 The Science of Macroeconomics
CHAPTER 2 The Data of Macroeconomics
C H A P T E R S U M M A R Y , P A R T 1
• Gross domestic product (GDP) measures both total
income and total expenditure on the economy’s
output of goods and services.
• Nominal GDP values output at current prices; real
GDP values output at constant prices. Changes in
output affect both measures, but changes in prices
affect only nominal GDP.
• GDP is the sum of consumption, investment,
government purchases, and net exports.
62.
CHAPTER 3 NationalIncome
CHAPTER 1 The Science of Macroeconomics
CHAPTER 2 The Data of Macroeconomics
C H A P T E R S U M M A R Y
• The overall level of prices can be measured
by either:
the consumer price index (CPI), the price of a fixed
basket of goods purchased by the typical consumer,
or
the GDP deflator, the ratio of nominal to real GDP.
• The unemployment rate is the fraction of the labor
force that is not employed.