Chapter 2 of 'Macroeconomics' by N. Gregory Mankiw covers key macroeconomic statistics such as GDP, CPI, and the unemployment rate. It explains GDP as a measure of total income, total output, and total expenditure, detailing its components like consumption, investment, government spending, and net exports. The chapter also discusses real vs. nominal GDP, the inflation measurement through CPI and GDP deflator, and provides insights on the labor force and unemployment metrics.


![Investment (I)
CHAPTER 2 The Data of Macroeconomics slide 9
Definition 1: Spending on [the factor of production]
capital.
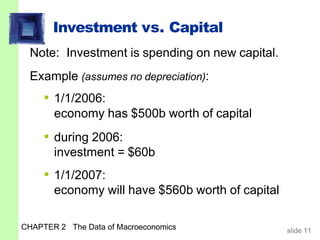
Definition 2: Spending on goods bought for future use
Includes:
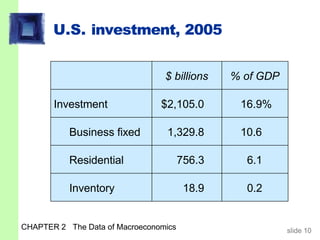
▪ business fixed investment
Spending on plant and equipment that firms will use
to produce other goods & services.
▪ residential fixed investment
Spending on housing units by consumers and
landlords.
▪ inventory investment
The change in the value of all firms’ inventories.](https://image.slidesharecdn.com/macroeconomicchapter2-240520161202-fedcfd1d/85/macroeconomic-chapter2-all-details-on-this-chapter-9-320.jpg)