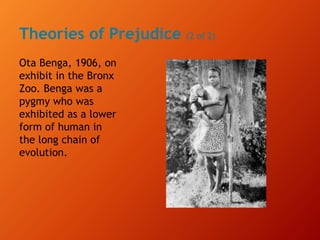
This document summarizes key concepts in sociological understanding of race and ethnicity. It discusses the myths of race and contrasts race with ethnicity. It also covers minority and dominant groups, prejudice and discrimination, theories of prejudice, and patterns of intergroup relations globally and within the US, including for European Americans, Latinos, African Americans, Asian Americans, and Native Americans. It concludes by discussing the future of immigration, affirmative action, and a multicultural society in the US.


![Educational Achievement by Racial-Ethnic
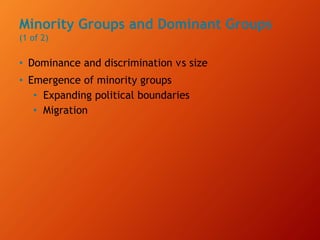
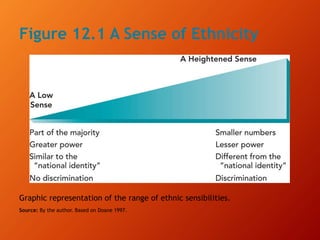
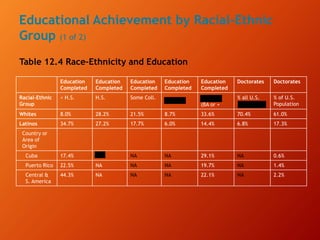
Group (2 of 2)
Table 12.4 [continued]
blank
Education
Completed
Education
Completed
Education
Completed
Education
Completed
Education
Completed
Doctorates Doctorates
Racial-Ethnic
Group
< H.S. H.S. Some Coll. Associate degree
College degree
(BA or +
% all U.S.
Doctorates 1
% of U.S.
Population
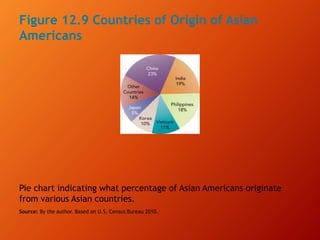
Latinos
Country or
Area of Origin
Blank Blank Blank Blank Blank Blank Blank
Mexico 29.2% NA NA NA 10.5% NA 10.4%
African
Americans
15.6% 31.6% 25.1% 8.0% 19.7% 8.1% 13.2%
Asian
Americans
13.7% 15.5% 12.6% 6.7% 51.5% 12.3% 5.4%
Native
Americans
20.7% 31.9% 25.2% 8.4% 13.9% 0.6% 1.2%
after the doctorates awarded to nonresidents and those claiming two or more races are deducted from the total.
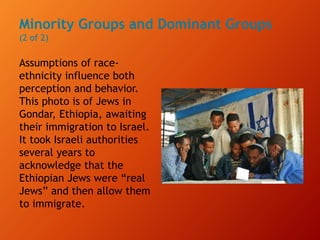
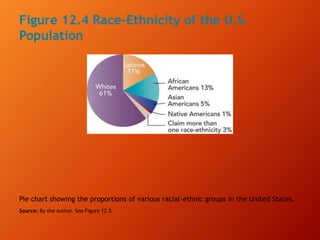
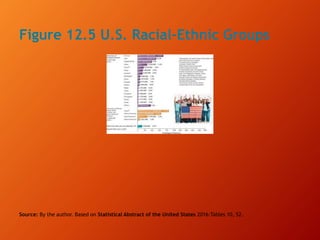
Source: By the author. Based on Statistical Abstract of the United States 2017:Tables 35, 36, 315, and Figure 12.5 of
this chapter.
Assoc.° College°
1
Doctorates
1
Percentage
2
Not Available.](https://image.slidesharecdn.com/chapter12lecturenotes-220928122802-63a62e14/85/Chapter-12-Lecture-Notes-pptx-40-320.jpg)