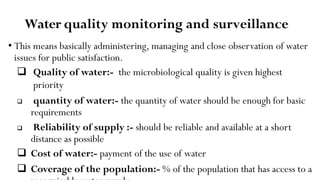
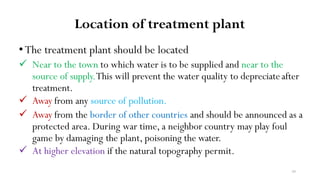
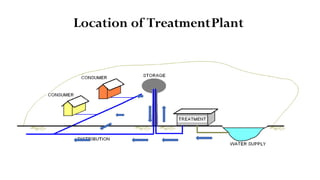
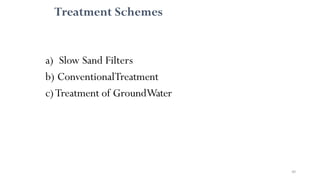
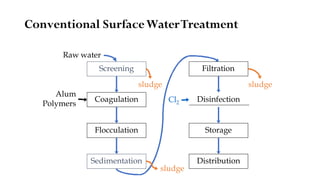
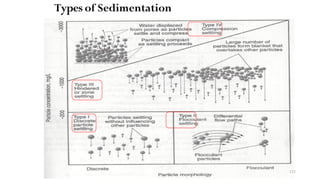
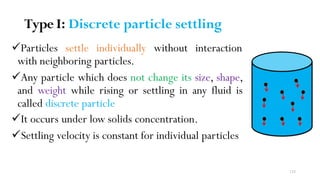
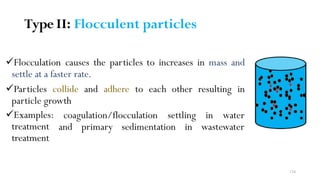
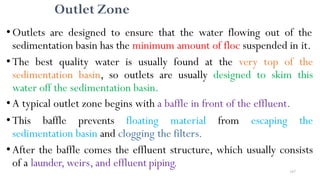
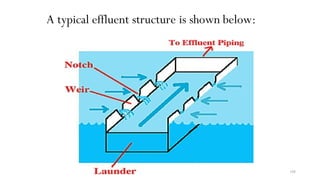
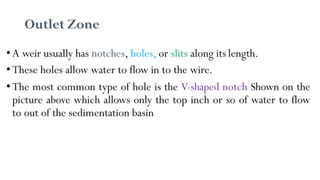
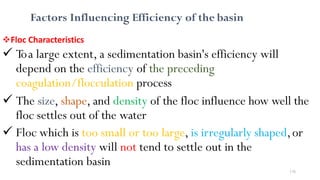
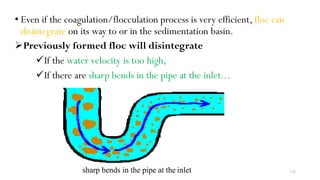
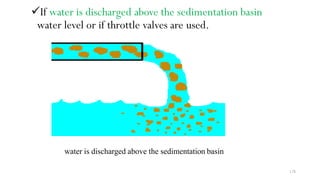
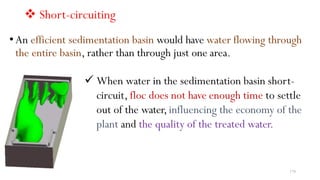
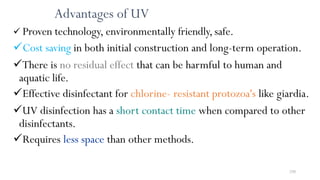
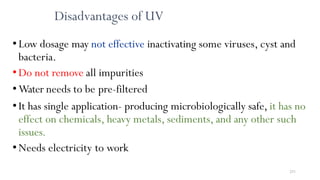
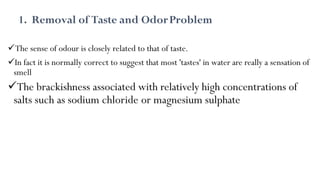
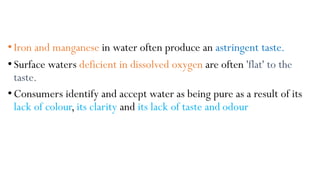
This document provides an outline for a course on water treatment. It discusses the target groups for the course, which are 3rd year water supply and environmental engineering students. It then outlines the various topics to be covered in the course, including preliminary treatment, sedimentation, coagulation and flocculation, filtration, disinfection, and miscellaneous water treatment processes. The document provides context on water sources, quality parameters, uses of water, water pollution, waterborne diseases, and drinking water quality standards. It emphasizes the importance of water treatment in removing impurities to make water safe for drinking and other uses.


![98
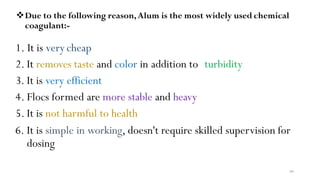
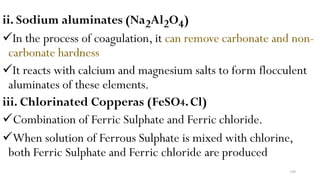
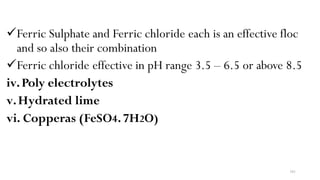
The following are the coagulants most commonly used:
i.Aluminum sulfate [Al2 (SO4)3.18H2O].
It is also calledAlum
It is the most widely used chemical coagulant in water purification work
Alum reacts with water only in the presence of alkalinity.If natural
alkalinity is not present, lime may be added to develop alkalinity
The chemical is found to be most effective between pH range of 6.5 to
8.5.
Its dose may vary from 5 to 30mg/lit, for normal water usually dose
being 14mg/l.](https://image.slidesharecdn.com/watertreatment-220810080040-7a5830ab/85/Water-Treatment-pdf-98-320.jpg)

![229
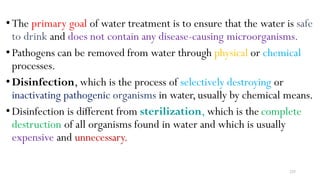
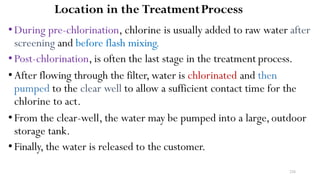
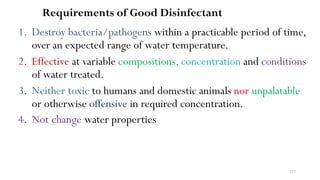
Methods of Disinfection
• The disinfection of water can be done by one of the following
methods:
a) Boiling of water
b) Ultra–Violate rays
c) Iodine and bromine
d) Ozone O3
e) Excess lime
f) Potassium permanganate [KMnO4]
g) Chlorine](https://image.slidesharecdn.com/watertreatment-220810080040-7a5830ab/85/Water-Treatment-pdf-229-320.jpg)
![230
The most common method of disinfection is the use of chlorine
i.e.chlorination.
The various chlorine compounds which are available in the
market and used as disinfectants are:
1. Calcium hypo chlorite [Ca (OCl) 2] – poweder form
2. Sodium hypo chlorite [NaOCl] –liquid form
3. Free chlorine Cl2- Gaseous form](https://image.slidesharecdn.com/watertreatment-220810080040-7a5830ab/85/Water-Treatment-pdf-230-320.jpg)


![Chapter 1. introduction[1]](https://cdn.slidesharecdn.com/ss_thumbnails/chapter1-171220222030-thumbnail.jpg?width=640&height=640&fit=bounds)


