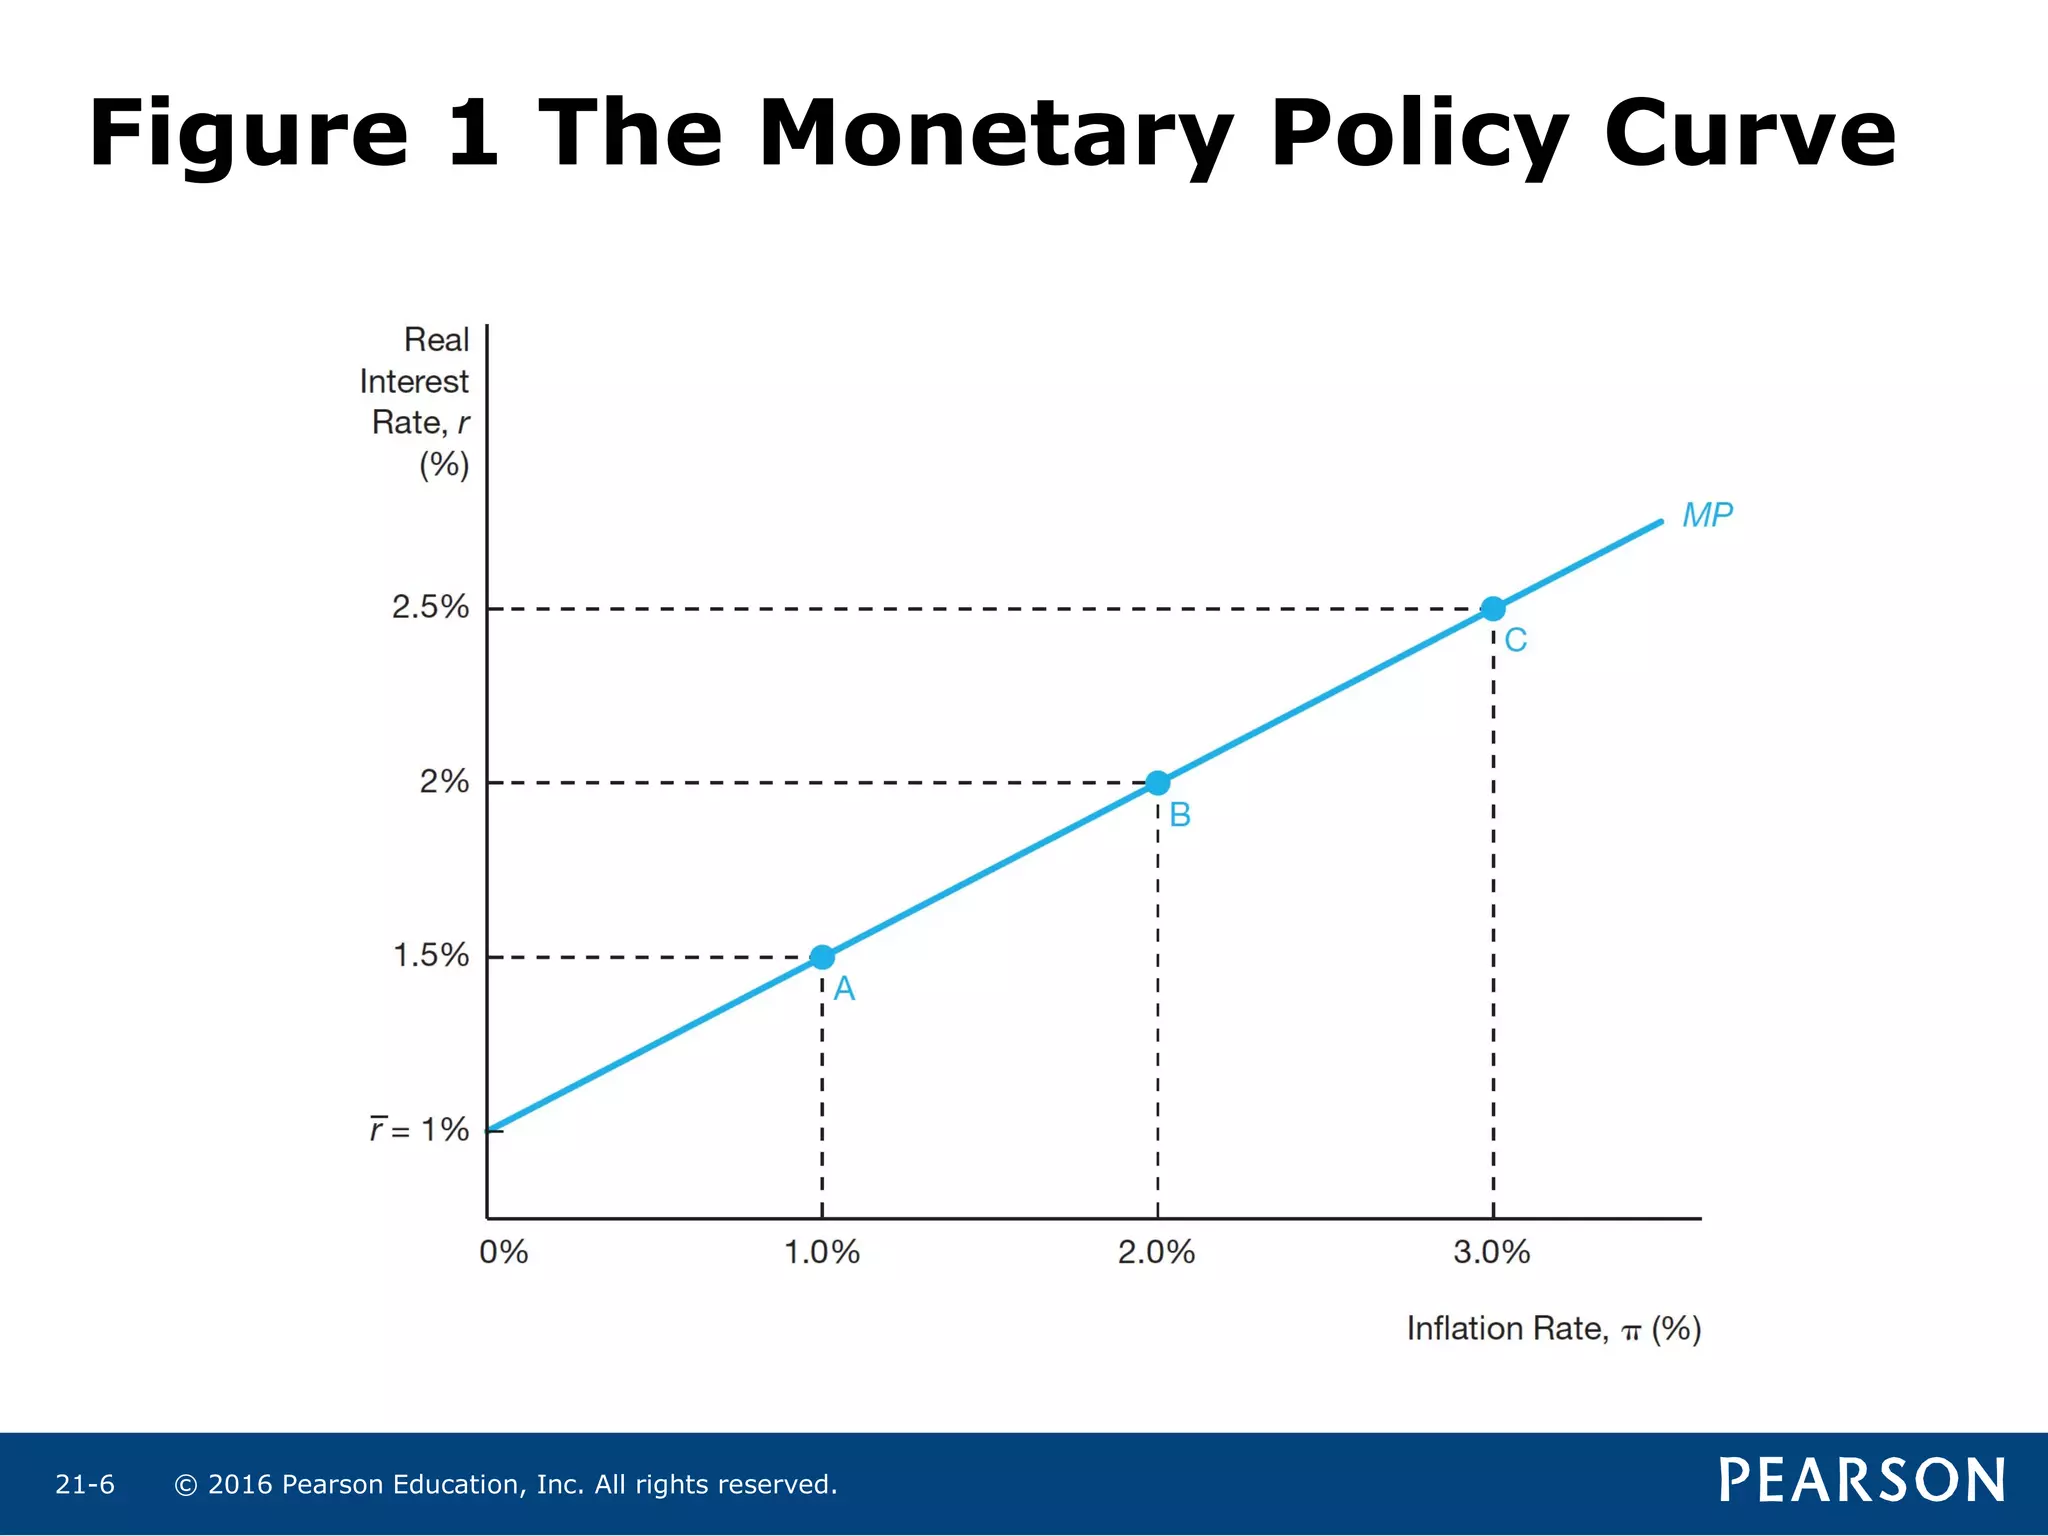
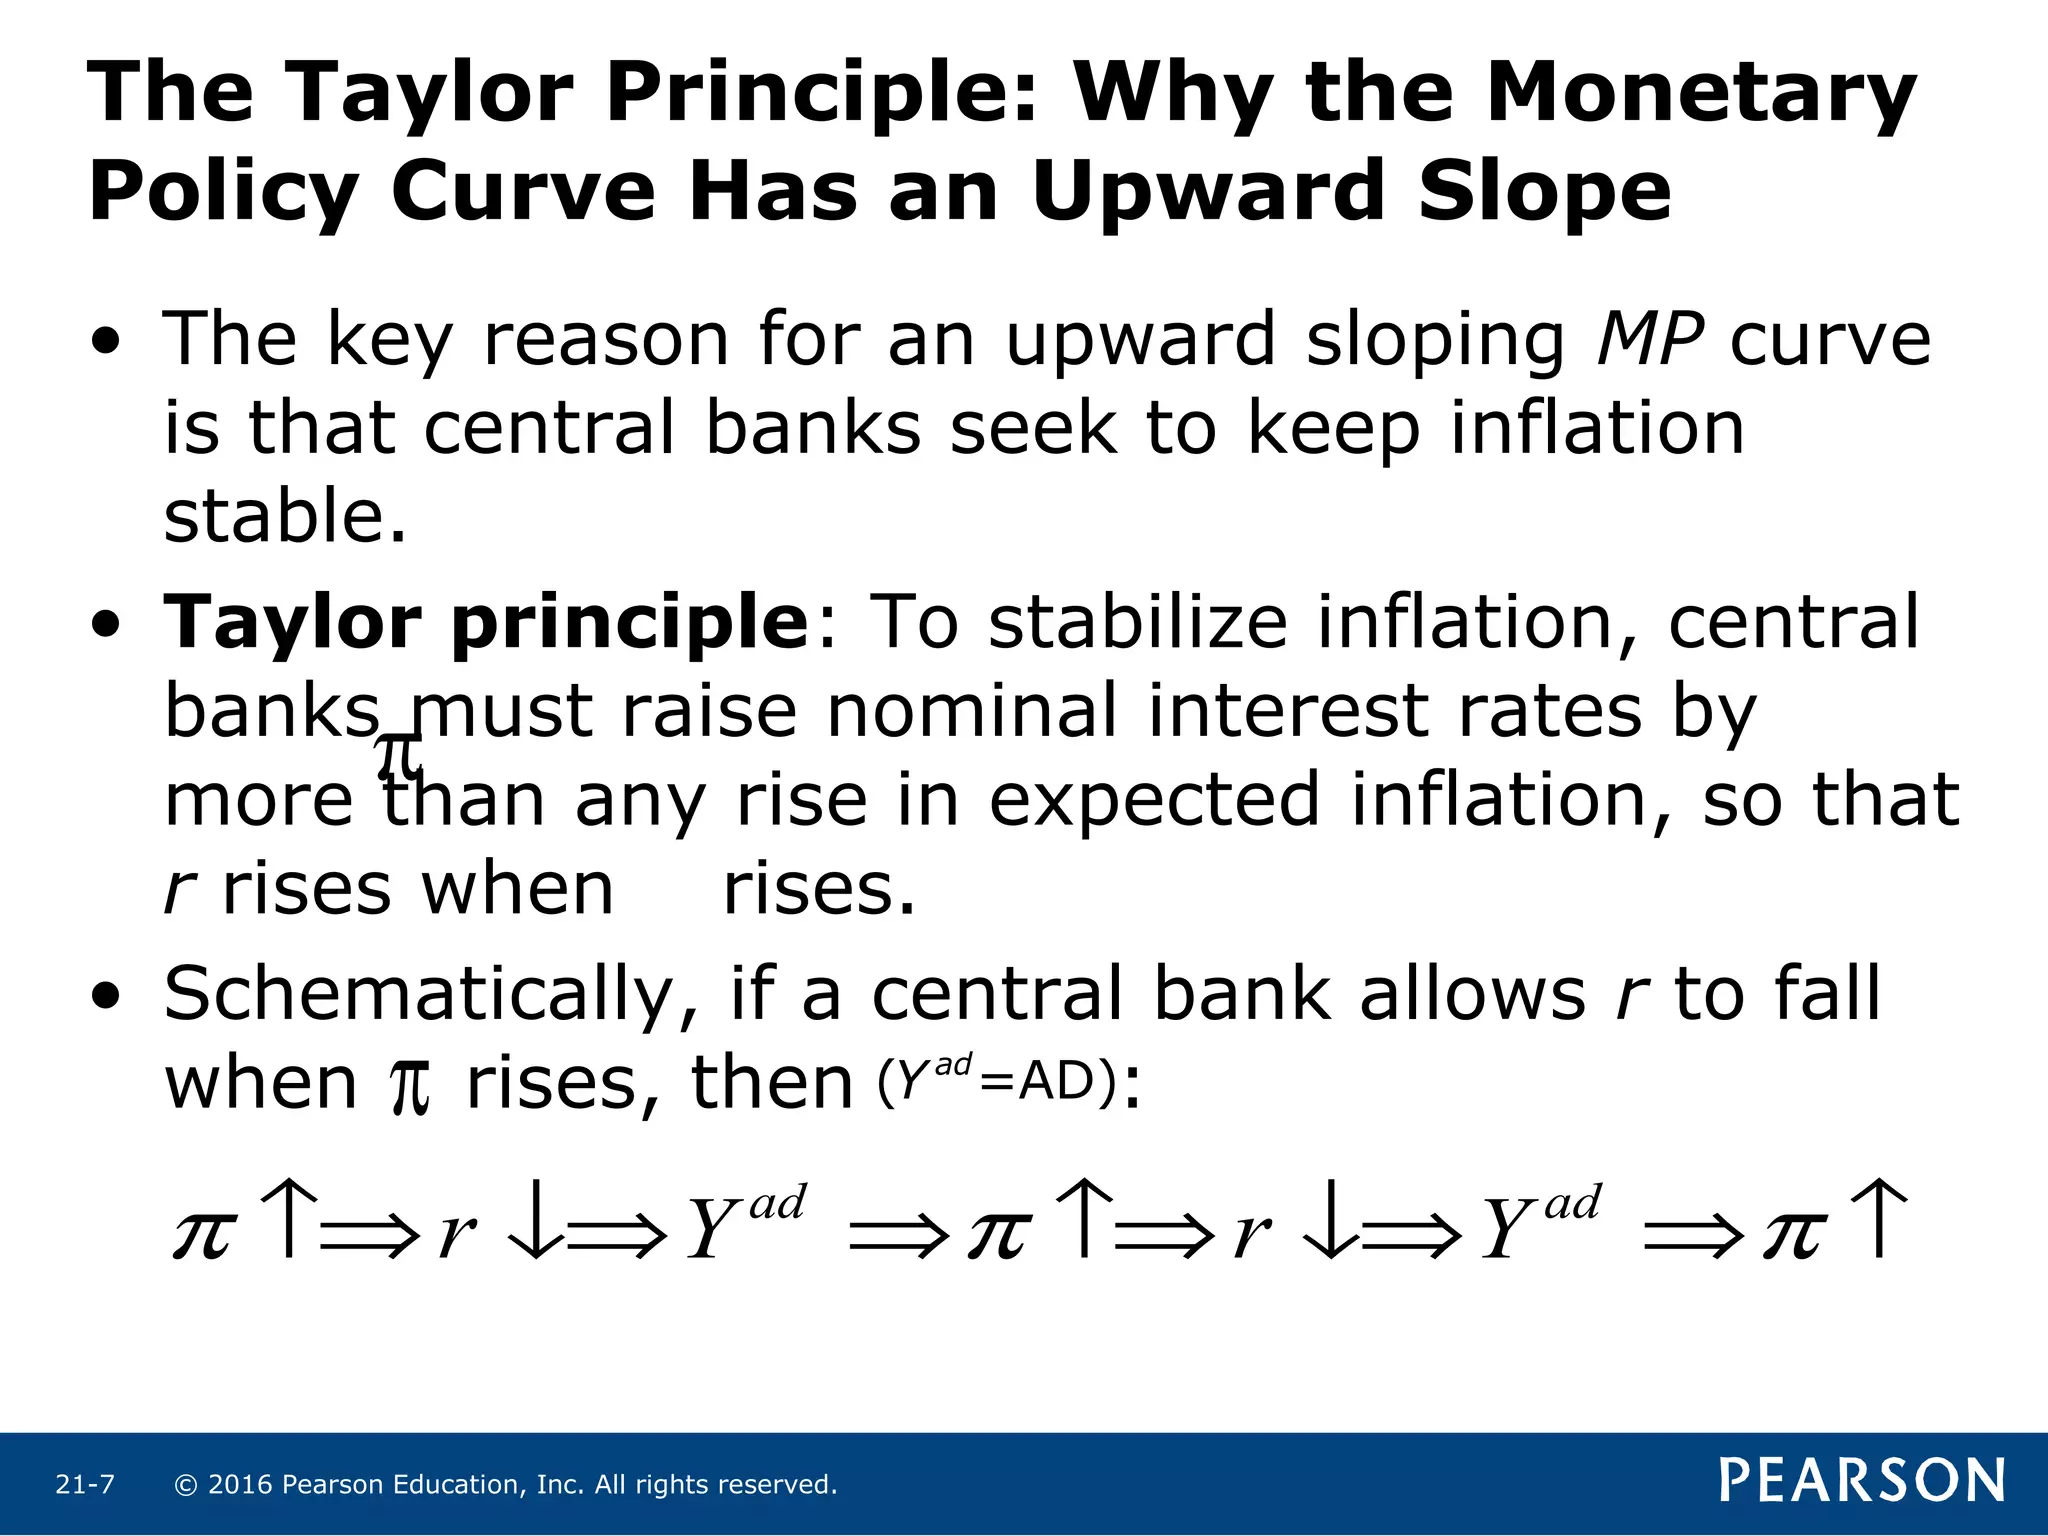
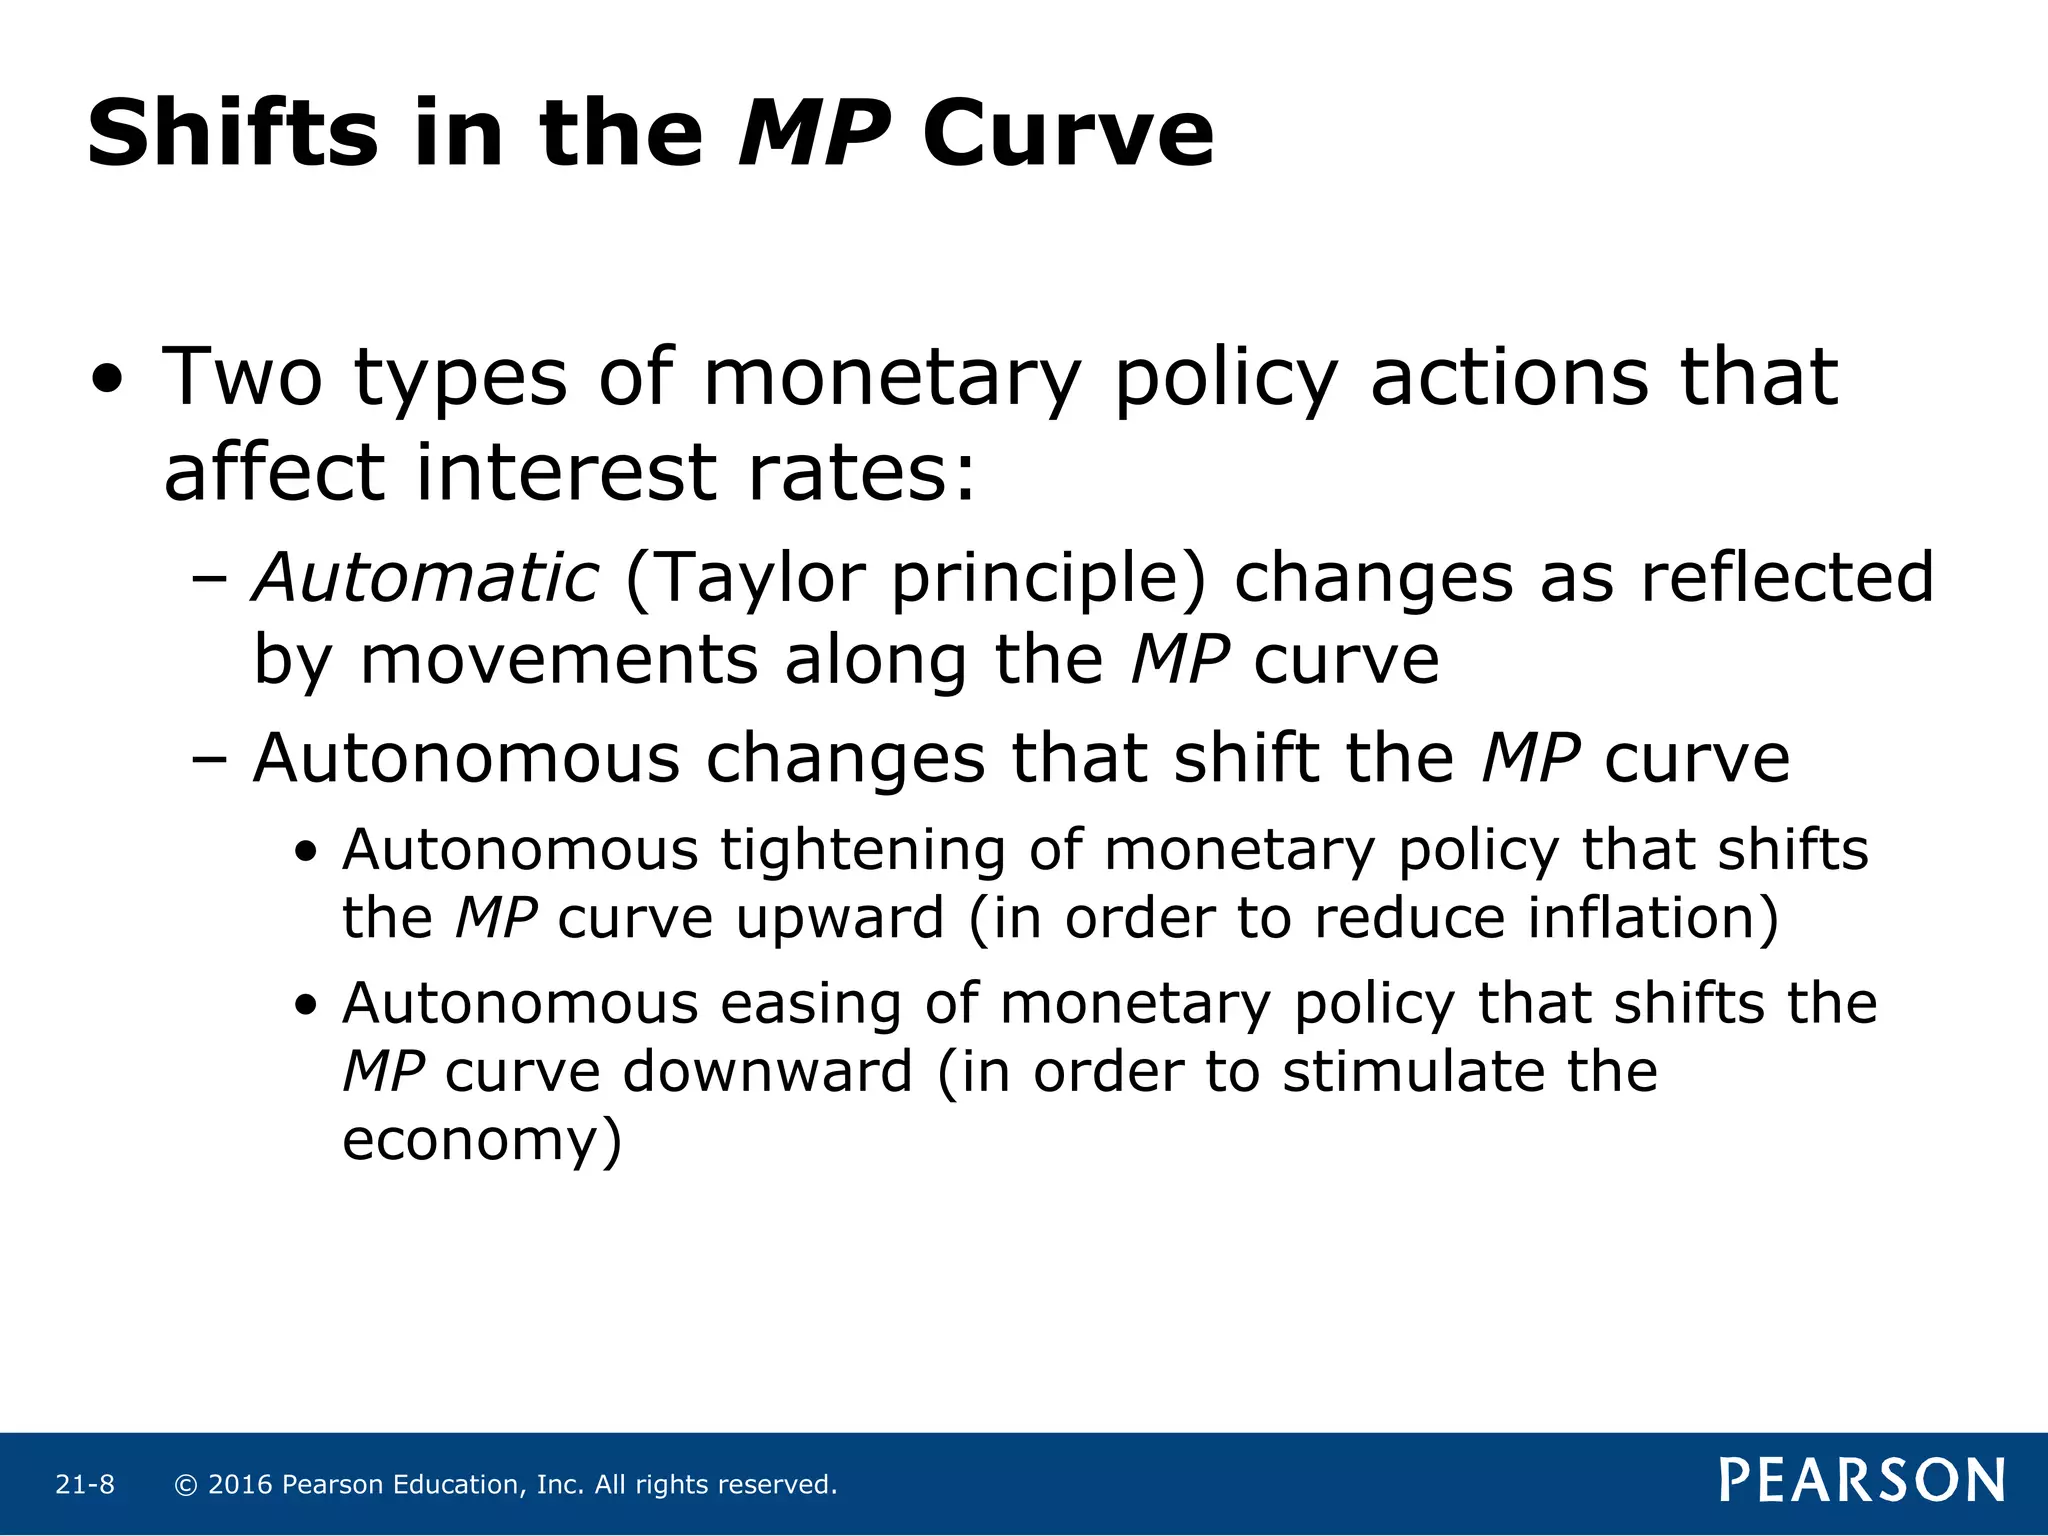
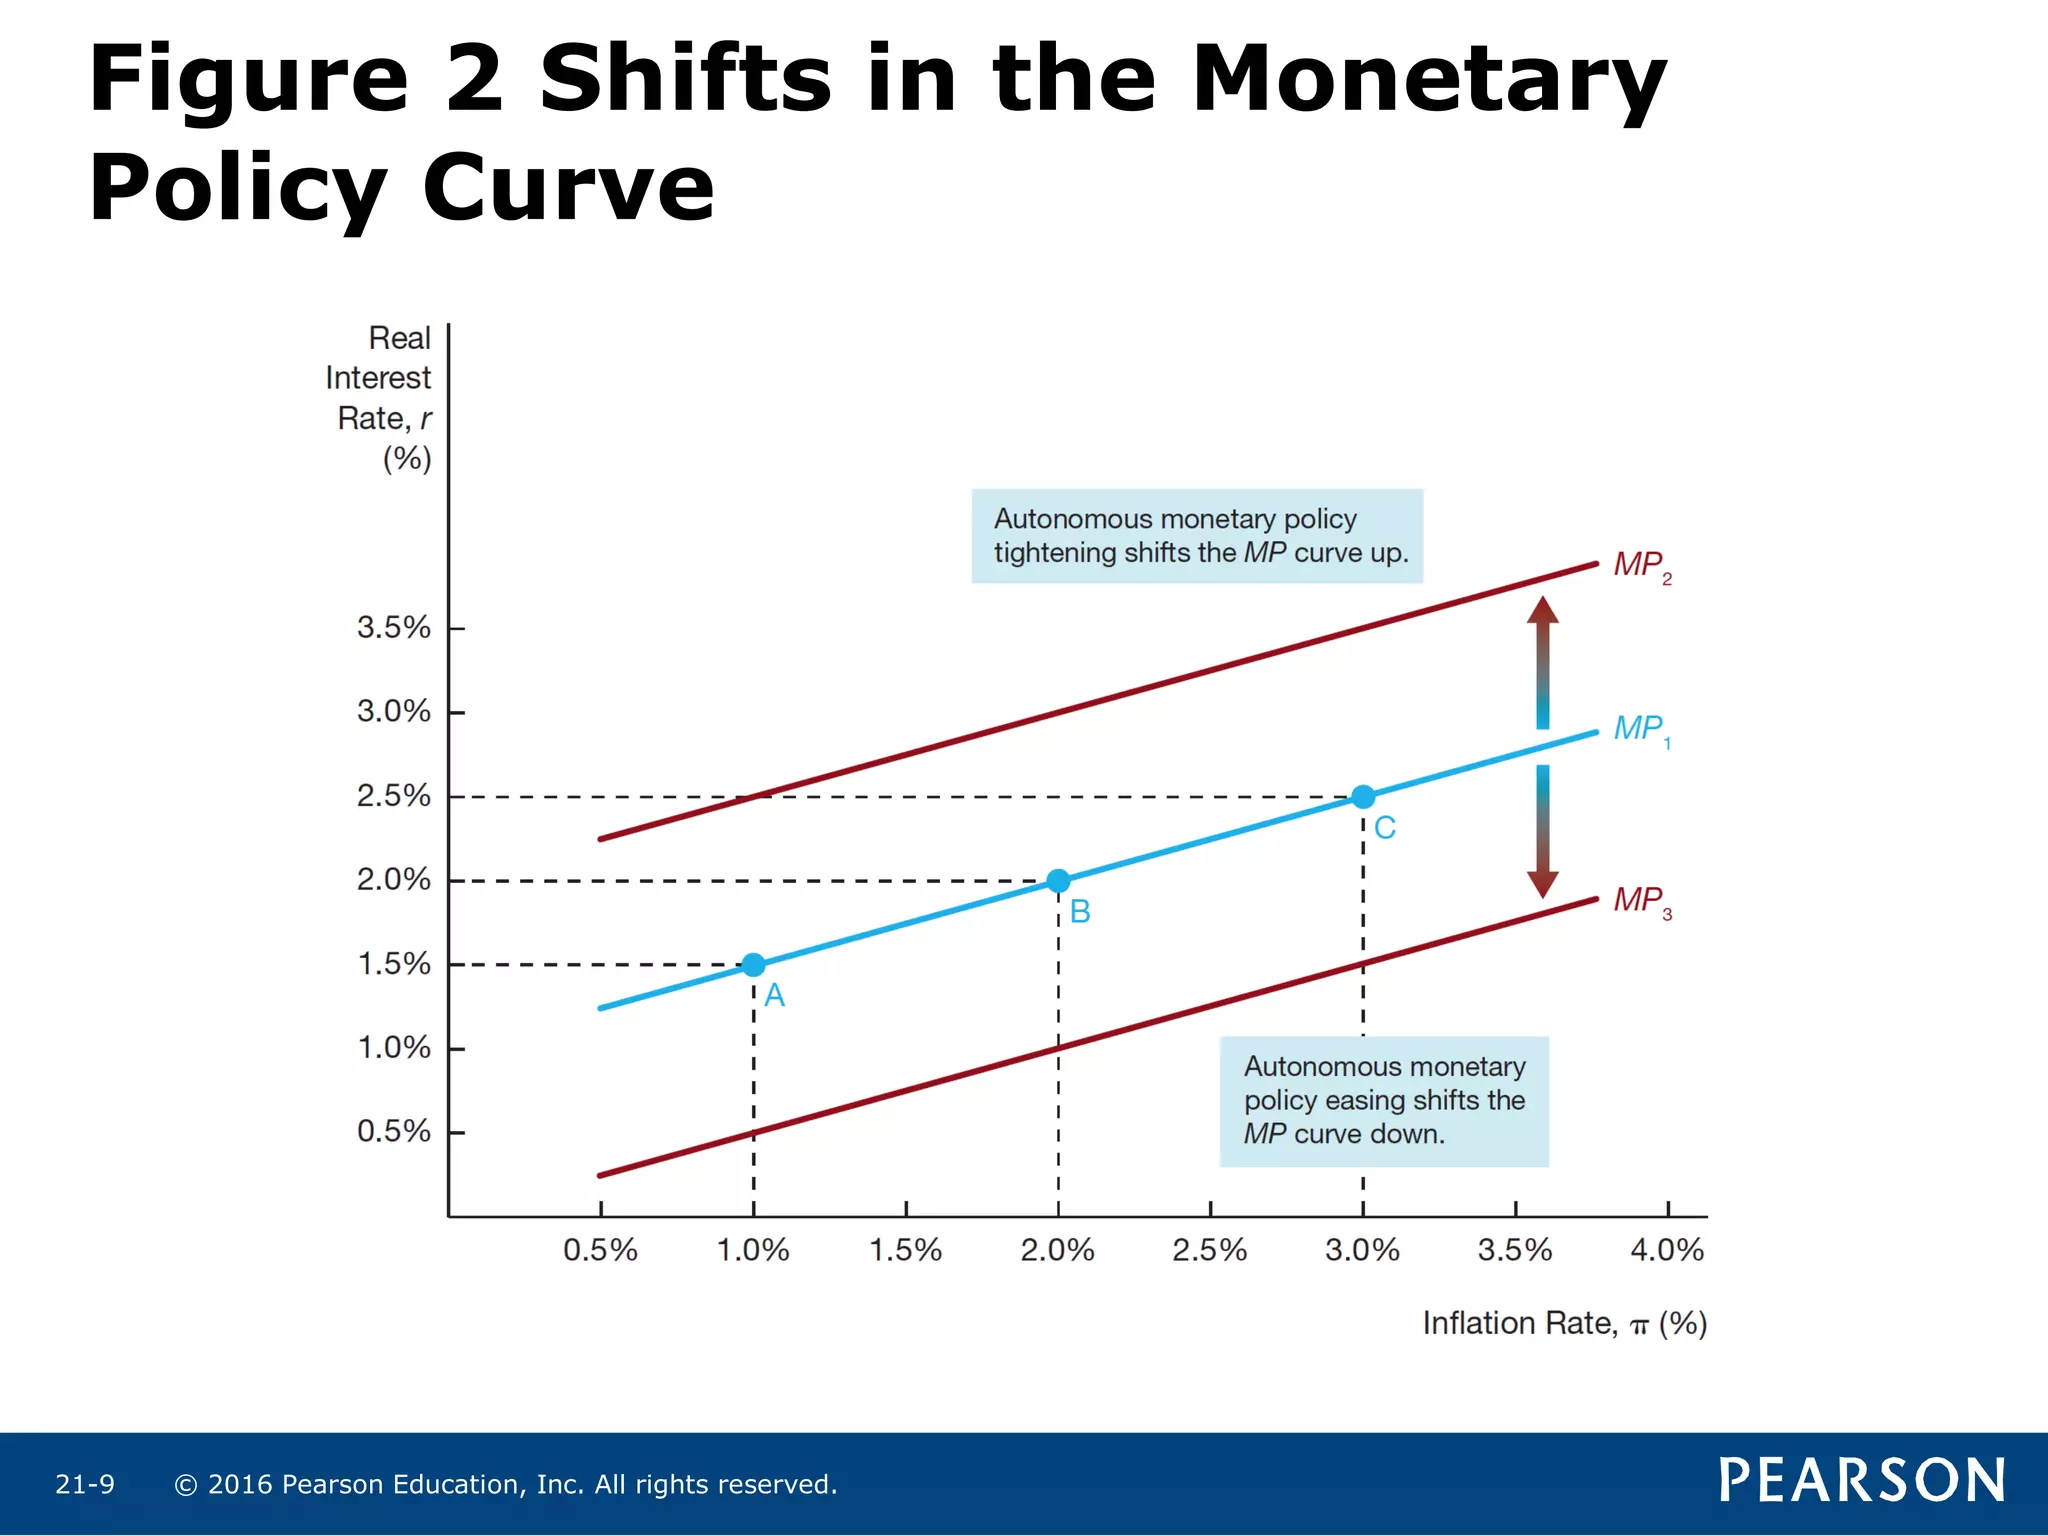
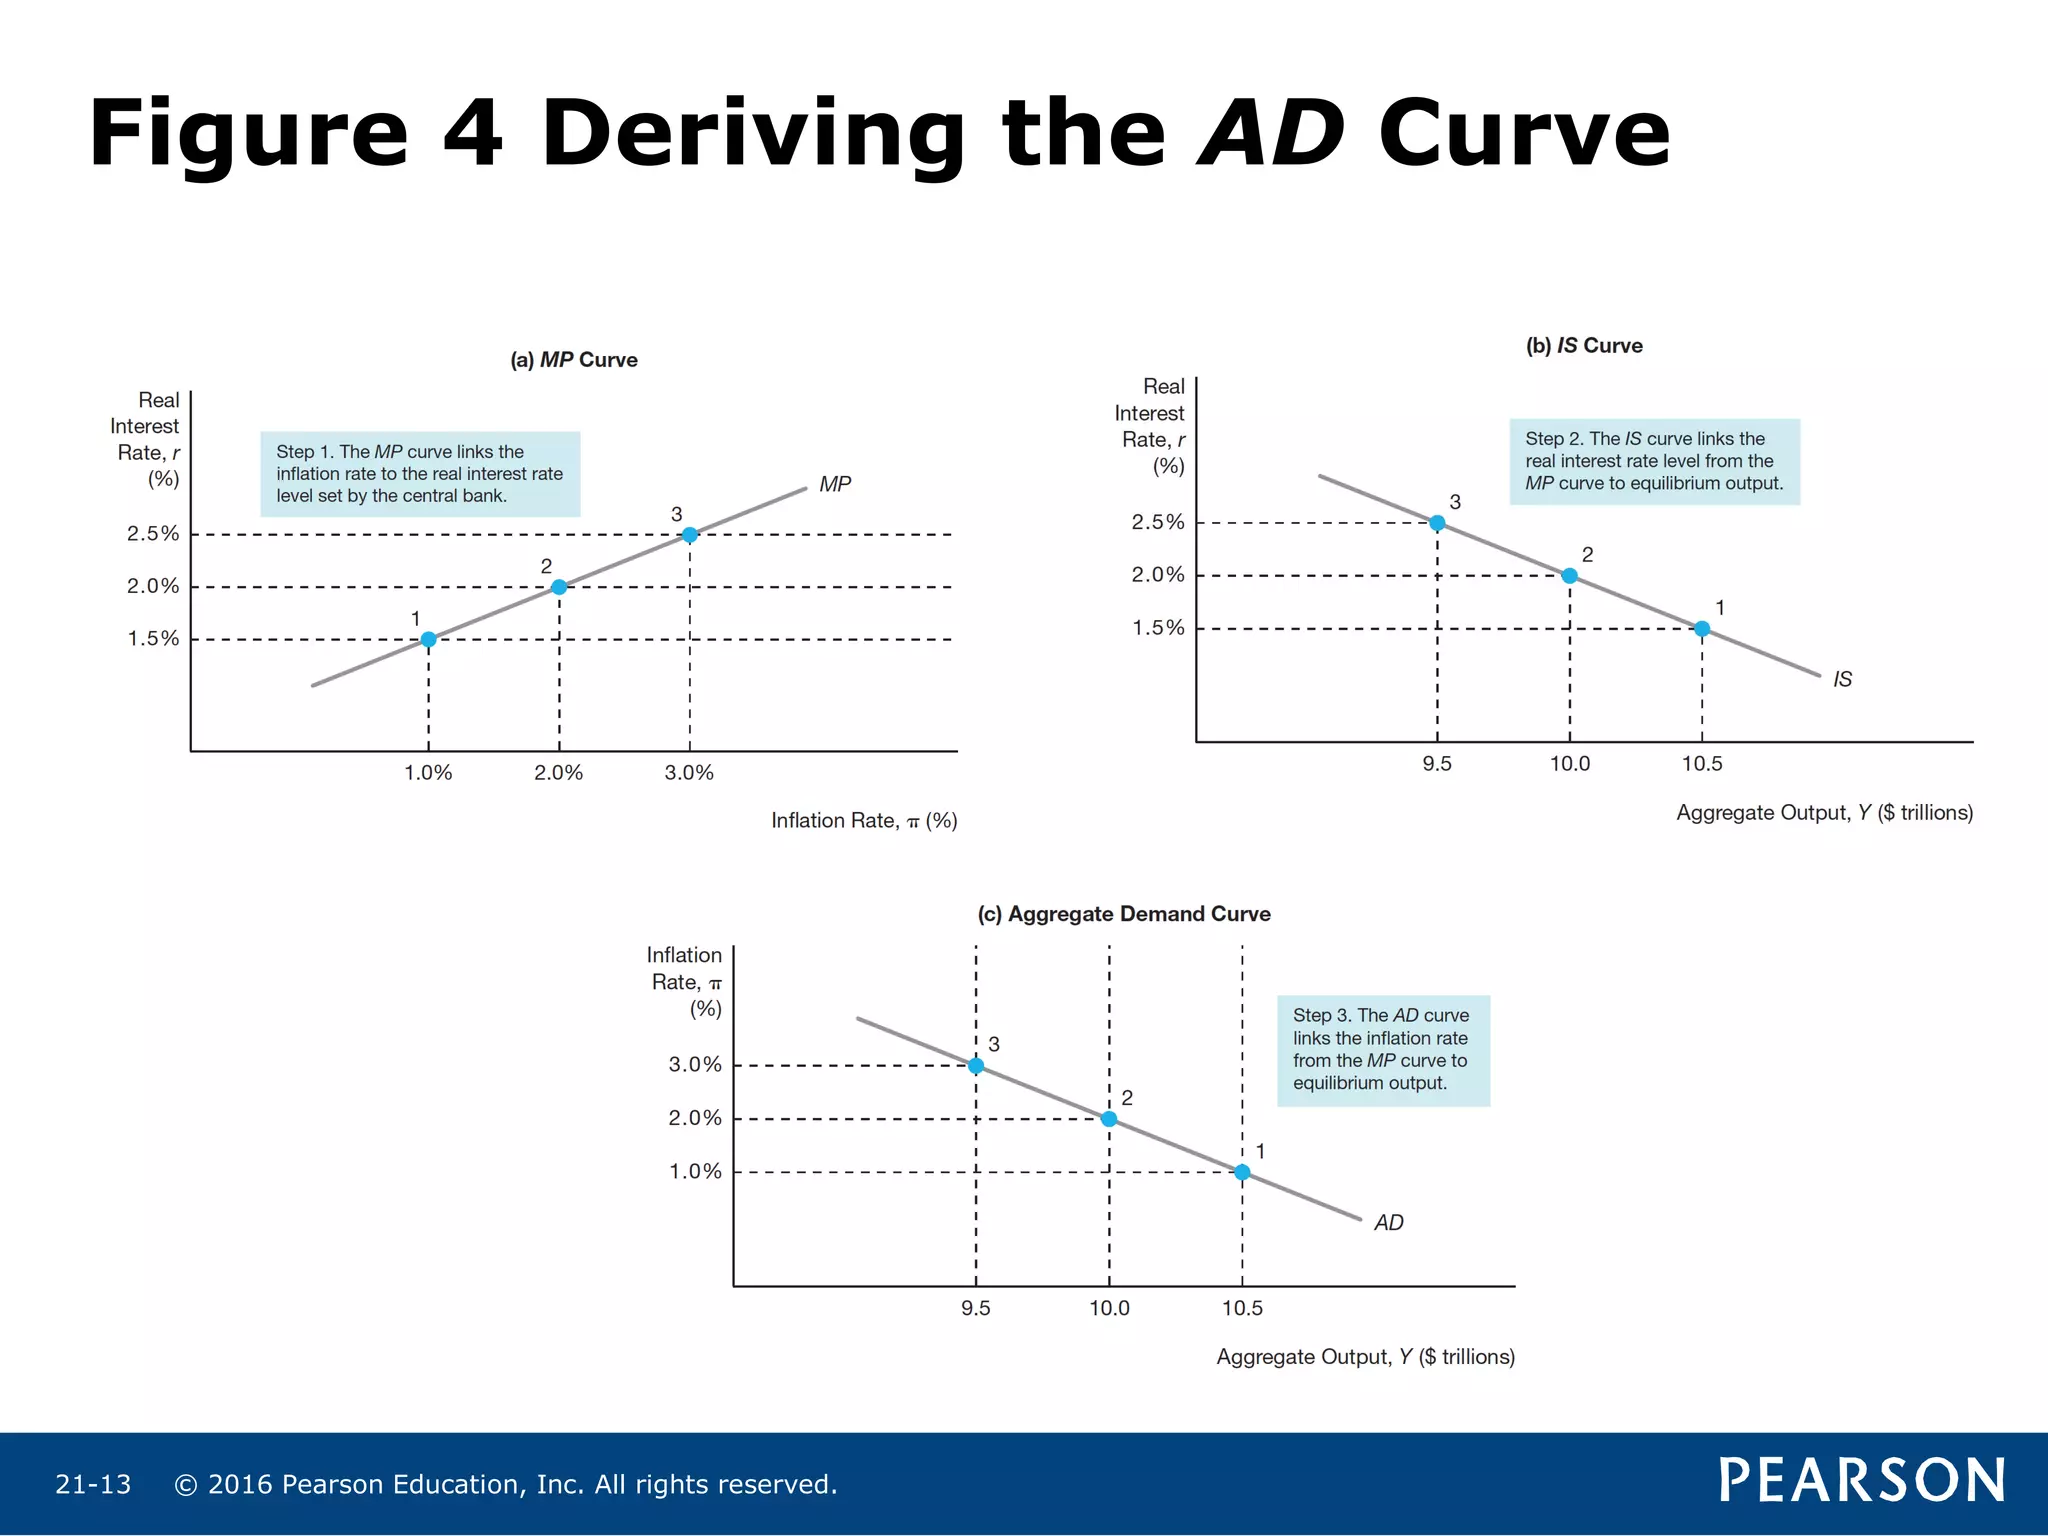
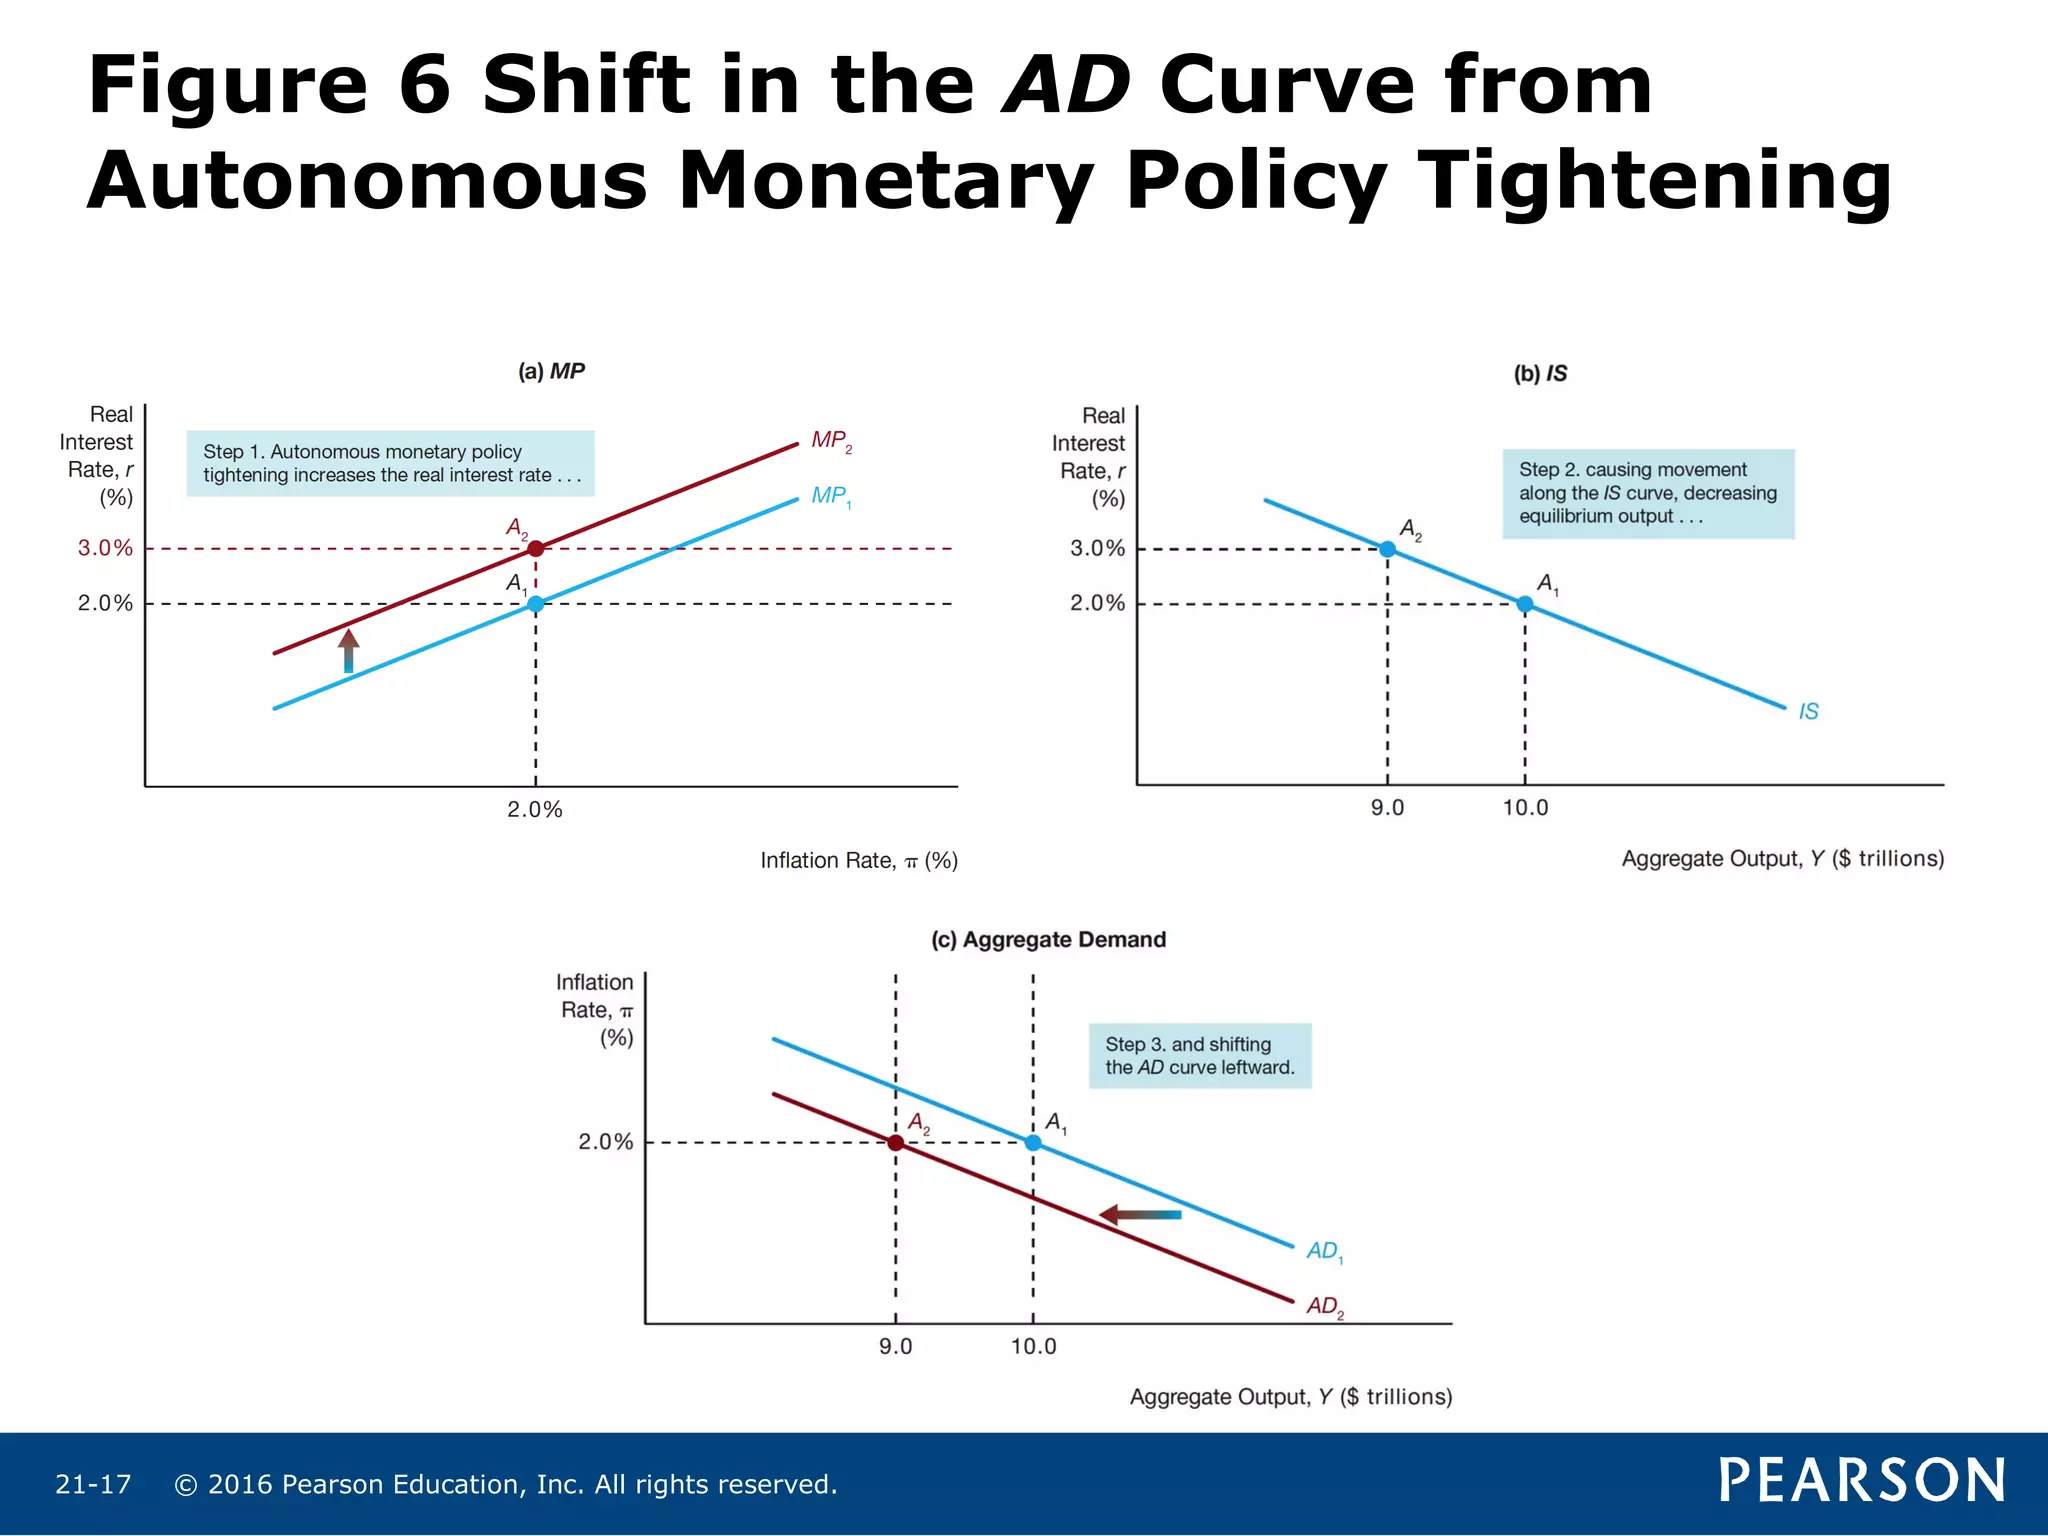
Chapter 21
The Monetary
Policy and
Aggregate
Demand Curves
© 2016 Pearson Education, Inc. All rights reserved.21-2
Preview
• This chapter develops an explanation for
why monetary policymakers put upward
pressure on interest rates when inflation
increases.
• This relationship is then used to develop the
monetary policy curve.
• The monetary policy curve is then used in
conjunction with the IS schedule to derive
an aggregate demand curve, which shall be
used in the discussions that follow.
© 2016 Pearson Education, Inc. All rights reserved.21-3
Learning Objectives
• Recognize the impact of changes in the
nominal federal funds rate on short-term
real interest rates.
• Define and illustrate the monetary policy
(MP) curve, and explain shifts in the MP
curve.
• Explain why the aggregate demand (AD)
curve slopes downward, and explain shifts in
the AD curve.
© 2016 Pearson Education, Inc. All rights reserved.21-4
The Federal Reserve and Monetary
Policy
• The Fed of the United States conducts
monetary policy by setting the federal funds
rate—the interest rate at which banks lend
to each other.
• When the Federal Reserve lowers the federal
funds rate, real interest rates fall.
• When the Federal Reserve raises the federal
funds rate, real interest rates rise.
© 2016 Pearson Education, Inc. All rights reserved.21-5
The Monetary Policy Curve
• The monetary policy (MP) curve shows how
monetary policy, measured by the real
interest rate, reacts to the inflation rate, :
• The MP curve is upward sloping. Real
interest rates rise when the inflation rate
rises.
where
autonomous component of
responsiveness of to inflation
r r
r r
r
= + λπ
=
λ =
π
© 2016 Pearson Education, Inc. All rights reserved.21-6
Figure 1 The Monetary Policy Curve
© 2016 Pearson Education, Inc. All rights reserved.21-7
The Taylor Principle: Why the Monetary
Policy Curve Has an Upward Slope
• The key reason for an upward sloping MP curve
is that central banks seek to keep inflation
stable.
• Taylor principle: To stabilize inflation, central
banks must raise nominal interest rates by
more than any rise in expected inflation, so that
r rises when rises.
• Schematically, if a central bank allows r to fall
when rises, then :( =AD)ad
Y
π
π
ad ad
r Y r Yπ π π↑⇒ ↓⇒ ⇒ ↑⇒ ↓⇒ ⇒ ↑
© 2016 Pearson Education, Inc. All rights reserved.21-8
Shifts in the MP Curve
• Two types of monetary policy actions that
affect interest rates:
– Automatic (Taylor principle) changes as reflected
by movements along the MP curve
– Autonomous changes that shift the MP curve
• Autonomous tightening of monetary policy that shifts
the MP curve upward (in order to reduce inflation)
• Autonomous easing of monetary policy that shifts the
MP curve downward (in order to stimulate the
economy)
© 2016 Pearson Education, Inc. All rights reserved.21-9
Figure 2 Shifts in the Monetary
Policy Curve
© 2016 Pearson Education, Inc. All rights reserved.21-10
Figure 3 The Federal Funds Rate and
Inflation Rate, 2003–2014
© 2016 Pearson Education, Inc. All rights reserved.21-11
The Aggregate Demand Curve
• The aggregate demand curve represents the
relationship between the inflation rate and
aggregate demand when the goods market
is in equilibrium.
• The aggregate demand curve is central to
aggregate demand and supply analysis,
which allows us to explain short-run
fluctuations in both aggregate output and
inflation.
© 2016 Pearson Education, Inc. All rights reserved.21-12
Deriving the Aggregate Demand
Curve Graphically
• The AD curve is derived from:
– The MP curve
– The IS curve
• The AD curve has a downward slope: As
inflation rises, the real interest rate rises, so
that spending and equilibrium aggregate
output fall.
© 2016 Pearson Education, Inc. All rights reserved.21-13
Figure 4 Deriving the AD Curve
© 2016 Pearson Education, Inc. All rights reserved.21-14
Factors That Shift the Aggregate
Demand Curve
• Shifts in the IS curve
– Autonomous consumption expenditure
– Autonomous investment spending
– Government purchases
– Taxes
– Autonomous net exports
• Any factor that shifts the IS curve shifts the
aggregate demand curve in the same
direction.
© 2016 Pearson Education, Inc. All rights reserved.21-15
Figure 5 Shift in the AD Curve From
Shifts in the IS Curve
© 2016 Pearson Education, Inc. All rights reserved.21-16
• Shifts in the MP curve
– An autonomous tightening of monetary policy,
that is a rise in real interest rate at any given
inflation rate, shifts the aggregate demand curve
to the left
– Similarly, an autonomous easing of monetary
policy shifts the aggregate demand curve to the
right
Factors That Shift the Aggregate
Demand Curve
© 2016 Pearson Education, Inc. All rights reserved.21-17
Figure 6 Shift in the AD Curve from
Autonomous Monetary Policy Tightening

Ch21 mish11 embfm

  • 1.
    Chapter 21 The Monetary Policyand Aggregate Demand Curves
  • 2.
    © 2016 PearsonEducation, Inc. All rights reserved.21-2 Preview • This chapter develops an explanation for why monetary policymakers put upward pressure on interest rates when inflation increases. • This relationship is then used to develop the monetary policy curve. • The monetary policy curve is then used in conjunction with the IS schedule to derive an aggregate demand curve, which shall be used in the discussions that follow.
  • 3.
    © 2016 PearsonEducation, Inc. All rights reserved.21-3 Learning Objectives • Recognize the impact of changes in the nominal federal funds rate on short-term real interest rates. • Define and illustrate the monetary policy (MP) curve, and explain shifts in the MP curve. • Explain why the aggregate demand (AD) curve slopes downward, and explain shifts in the AD curve.
  • 4.
    © 2016 PearsonEducation, Inc. All rights reserved.21-4 The Federal Reserve and Monetary Policy • The Fed of the United States conducts monetary policy by setting the federal funds rate—the interest rate at which banks lend to each other. • When the Federal Reserve lowers the federal funds rate, real interest rates fall. • When the Federal Reserve raises the federal funds rate, real interest rates rise.
  • 5.
    © 2016 PearsonEducation, Inc. All rights reserved.21-5 The Monetary Policy Curve • The monetary policy (MP) curve shows how monetary policy, measured by the real interest rate, reacts to the inflation rate, : • The MP curve is upward sloping. Real interest rates rise when the inflation rate rises. where autonomous component of responsiveness of to inflation r r r r r = + λπ = λ = π
  • 6.
    © 2016 PearsonEducation, Inc. All rights reserved.21-6 Figure 1 The Monetary Policy Curve
  • 7.
    © 2016 PearsonEducation, Inc. All rights reserved.21-7 The Taylor Principle: Why the Monetary Policy Curve Has an Upward Slope • The key reason for an upward sloping MP curve is that central banks seek to keep inflation stable. • Taylor principle: To stabilize inflation, central banks must raise nominal interest rates by more than any rise in expected inflation, so that r rises when rises. • Schematically, if a central bank allows r to fall when rises, then :( =AD)ad Y π π ad ad r Y r Yπ π π↑⇒ ↓⇒ ⇒ ↑⇒ ↓⇒ ⇒ ↑
  • 8.
    © 2016 PearsonEducation, Inc. All rights reserved.21-8 Shifts in the MP Curve • Two types of monetary policy actions that affect interest rates: – Automatic (Taylor principle) changes as reflected by movements along the MP curve – Autonomous changes that shift the MP curve • Autonomous tightening of monetary policy that shifts the MP curve upward (in order to reduce inflation) • Autonomous easing of monetary policy that shifts the MP curve downward (in order to stimulate the economy)
  • 9.
    © 2016 PearsonEducation, Inc. All rights reserved.21-9 Figure 2 Shifts in the Monetary Policy Curve
  • 10.
    © 2016 PearsonEducation, Inc. All rights reserved.21-10 Figure 3 The Federal Funds Rate and Inflation Rate, 2003–2014
  • 11.
    © 2016 PearsonEducation, Inc. All rights reserved.21-11 The Aggregate Demand Curve • The aggregate demand curve represents the relationship between the inflation rate and aggregate demand when the goods market is in equilibrium. • The aggregate demand curve is central to aggregate demand and supply analysis, which allows us to explain short-run fluctuations in both aggregate output and inflation.
  • 12.
    © 2016 PearsonEducation, Inc. All rights reserved.21-12 Deriving the Aggregate Demand Curve Graphically • The AD curve is derived from: – The MP curve – The IS curve • The AD curve has a downward slope: As inflation rises, the real interest rate rises, so that spending and equilibrium aggregate output fall.
  • 13.
    © 2016 PearsonEducation, Inc. All rights reserved.21-13 Figure 4 Deriving the AD Curve
  • 14.
    © 2016 PearsonEducation, Inc. All rights reserved.21-14 Factors That Shift the Aggregate Demand Curve • Shifts in the IS curve – Autonomous consumption expenditure – Autonomous investment spending – Government purchases – Taxes – Autonomous net exports • Any factor that shifts the IS curve shifts the aggregate demand curve in the same direction.
  • 15.
    © 2016 PearsonEducation, Inc. All rights reserved.21-15 Figure 5 Shift in the AD Curve From Shifts in the IS Curve
  • 16.
    © 2016 PearsonEducation, Inc. All rights reserved.21-16 • Shifts in the MP curve – An autonomous tightening of monetary policy, that is a rise in real interest rate at any given inflation rate, shifts the aggregate demand curve to the left – Similarly, an autonomous easing of monetary policy shifts the aggregate demand curve to the right Factors That Shift the Aggregate Demand Curve
  • 17.
    © 2016 PearsonEducation, Inc. All rights reserved.21-17 Figure 6 Shift in the AD Curve from Autonomous Monetary Policy Tightening