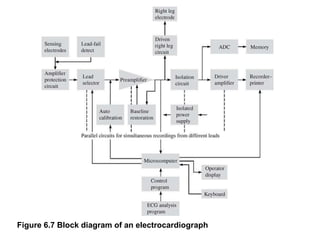
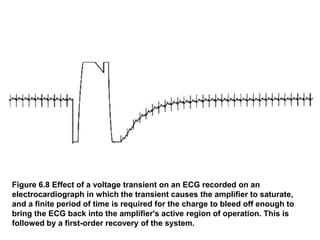
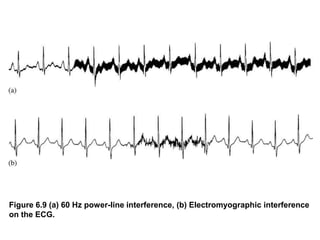
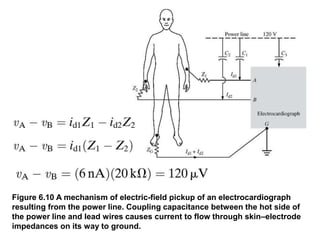
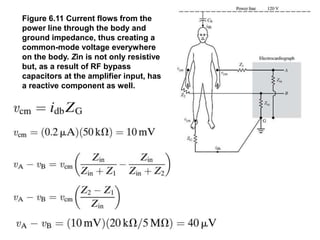
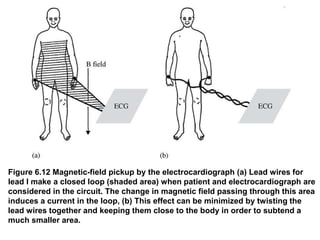
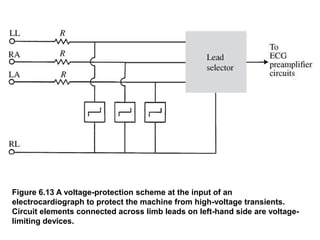
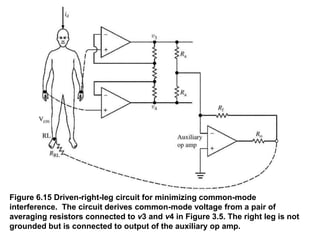
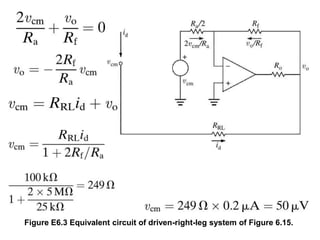
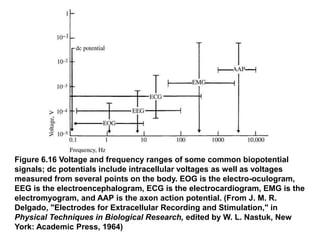
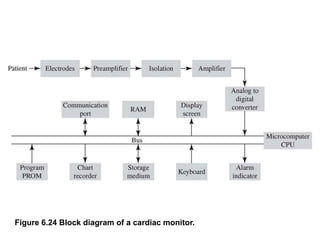
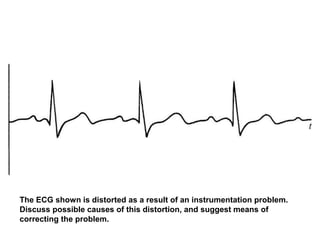
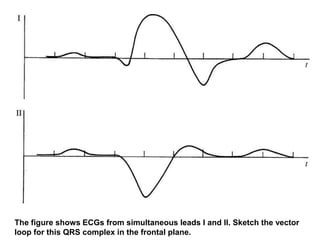
Chapter 6. Biopotential Amplifiers
Michael R. Neuman
Medical Instrumentation Application
and Design, 4th Edition
John G. Webster, Univ. of Wisconsin, Madison
ISBN: 978-0-471-67600-3
Figure 6.1 Rough sketch of the dipole field of the heart when the R wave is
maximal. The dipole consists of the points of equal positive and negative
charge separated from one another and denoted by the dipole moment vector
M.
Figure 6.2 Relationships between the two lead vectors a1 and a2 and the
cardiac vector M. The component of M in the direction of a1 is given by the
dot product of these two vectors and denoted on the figure by va1. Lead
vector a2 is perpendicular to the cardiac vector, so no voltage component is
seen in this lead.
Figure 6.3 Cardiologists use
a standard notation such
that the direction of the lead
vector for lead I is 0°, that of
lead II is 60°, and that of lead
III is 120°. An example of a
cardiac vector at 30° with its
scalar components seen for
each lead is shown.
Figure E6.1 (a) aVR (b) VR (c) Simplified circuit of (a)
Figure 6.4
Connection of
electrodes to the
body to obtain
Wilson’s central
terminal
Figure 6.5 (a), (b), (c)
Connections of
electrodes for the
three augmented
limb leads, (d)
Vector diagram
showing standard
and augmented
lead-vector
directions in the
frontal plane.
Figure 6.6 (a) Positions of precordial leads on the chest wall, (b) Directions of
precordial lead vectors in the transverse plane.
Figure 6.7 Block diagram of an electrocardiograph
Table 6.1
Table 6.1
Table 6.1
Figure 6.8 Effect of a voltage transient on an ECG recorded on an
electrocardiograph in which the transient causes the amplifier to saturate,
and a finite period of time is required for the charge to bleed off enough to
bring the ECG back into the amplifier's active region of operation. This is
followed by a first-order recovery of the system.
Figure 6.9 (a) 60 Hz power-line interference, (b) Electromyographic interference
on the ECG.
Figure 6.10 A mechanism of electric-field pickup of an electrocardiograph
resulting from the power line. Coupling capacitance between the hot side of
the power line and lead wires causes current to flow through skin–electrode
impedances on its way to ground.
Figure 6.11 Current flows from the
power line through the body and
ground impedance, thus creating a
common-mode voltage everywhere
on the body. Zin is not only resistive
but, as a result of RF bypass
capacitors at the amplifier input, has
a reactive component as well.
Figure 6.12 Magnetic-field pickup by the electrocardiograph (a) Lead wires for
lead I make a closed loop (shaded area) when patient and electrocardiograph are
considered in the circuit. The change in magnetic field passing through this area
induces a current in the loop, (b) This effect can be minimized by twisting the
lead wires together and keeping them close to the body in order to subtend a
much smaller area.
Figure 6.13 A voltage-protection scheme at the input of an
electrocardiograph to protect the machine from high-voltage transients.
Circuit elements connected across limb leads on left-hand side are voltage-
limiting devices.
Figure 6.14 Voltage-limiting devices (a) Current–voltage characteristics of a
voltage-limiting device, (b) Parallel silicon-diode voltage-limiting circuit, (c)
Back-to-back silicon Zener-diode voltage-limiting circuit, (d) Gas-discharge
tube (neon light) voltage-limiting circuit element.
Figure 6.15 Driven-right-leg circuit for minimizing common-mode
interference. The circuit derives common-mode voltage from a pair of
averaging resistors connected to v3 and v4 in Figure 3.5. The right leg is not
grounded but is connected to output of the auxiliary op amp.
Figure E6.3 Equivalent circuit of driven-right-leg system of Figure 6.15.
Figure 6.16 Voltage and frequency ranges of some common biopotential
signals; dc potentials include intracellular voltages as well as voltages
measured from several points on the body. EOG is the electro-oculogram,
EEG is the electroencephalogram, ECG is the electrocardiogram, EMG is the
electromyogram, and AAP is the axon action potential. (From J. M. R.
Delgado, "Electrodes for Extracellular Recording and Stimulation," in
Physical Techniques in Biological Research, edited by W. L. Nastuk, New
York: Academic Press, 1964)
Figure 6.17 (a) Basic arrangement for negative-input-capacitance amplifier.
Basic amplifier is on the right-hand side; equivalent source with lumped
series resistance Rs and shunt capacitance Cs is on the left, (b) Equivalent
circuit of basic negative-input-capacitance amplifier.
Figure 6.18 This ECG amplifier has a gain of 25 in the dc-coupled stages. The
high-pass filter feeds a noninverting-amplifier stage that has a gain of 32. The
total gain is 25 X 32 = 800. When mA 776 op amps were used, the circuit was
found to have a CMRR of 86 dB at 100 Hz and a noise level of 40 mV peak to
peak at the output. The frequency response was 0.04 to 150 Hz for ±3 dB and
was flat over 4 to 40 Hz. A single op amp chip, the LM 324, that contains four
individual op amps could also be used in this circuit reducing the total parts
count.
Figure 6.19 Timing diagram for beat-to-beat cardiotachometer.
Figure 6.20 The various waveforms for the EMG integrator.
Figure 6.21 Signal-
averaging
technique for
improving the SNR
in signals that are
repetitive or
respond to a
known stimulus.
Figure 6.22 Typical fetal ECG obtained from the maternal abdomen. F
represents fetal QRS complexes; M represents maternal QRS complexes.
Maternal ECG and fetal ECG (recorded directly from the fetus) are included
for comparison. (From "Monitoring of Intrapartum Phenomena," by J. F.
Roux, M. R. Neuman, and R. C. Goodlin, in CRC Critical Reviews in
Bioengineering, 2, pp. 119-158, January 1975, © CRC Press. Used by
permission of CRC Press, Inc.)
Figure 6.23 Block diagram of a scheme for isolating fetal ECG from an
abdominal signal that contains both fetal and maternal ECGs. (From
"Monitoring of Intrapartum Phenomena," by J. F. Roux, M. R. Neuman, and R.
C. Goodlin, in CRC Critical Reviews in Bioengineering, 2, pp. 119–158,
January 1975, © CRC Press. Used by permission of CRC Press, Inc.)
Figure 6.24 Block diagram of a cardiac monitor.
Figure 6.25 Block diagram of a system used with cardiac monitors to detect
increased electrode impedance, lead wire failure, or electrode fall-off.
The ECG shown is distorted as a result of an instrumentation problem.
Discuss possible causes of this distortion, and suggest means of
correcting the problem.
The figure shows ECGs from simultaneous leads I and II. Sketch the vector
loop for this QRS complex in the frontal plane.

ch06d.ppt

  • 1.
    Chapter 6. BiopotentialAmplifiers Michael R. Neuman Medical Instrumentation Application and Design, 4th Edition John G. Webster, Univ. of Wisconsin, Madison ISBN: 978-0-471-67600-3
  • 2.
    Figure 6.1 Roughsketch of the dipole field of the heart when the R wave is maximal. The dipole consists of the points of equal positive and negative charge separated from one another and denoted by the dipole moment vector M.
  • 3.
    Figure 6.2 Relationshipsbetween the two lead vectors a1 and a2 and the cardiac vector M. The component of M in the direction of a1 is given by the dot product of these two vectors and denoted on the figure by va1. Lead vector a2 is perpendicular to the cardiac vector, so no voltage component is seen in this lead.
  • 4.
    Figure 6.3 Cardiologistsuse a standard notation such that the direction of the lead vector for lead I is 0°, that of lead II is 60°, and that of lead III is 120°. An example of a cardiac vector at 30° with its scalar components seen for each lead is shown.
  • 5.
    Figure E6.1 (a)aVR (b) VR (c) Simplified circuit of (a)
  • 6.
    Figure 6.4 Connection of electrodesto the body to obtain Wilson’s central terminal
  • 7.
    Figure 6.5 (a),(b), (c) Connections of electrodes for the three augmented limb leads, (d) Vector diagram showing standard and augmented lead-vector directions in the frontal plane.
  • 8.
    Figure 6.6 (a)Positions of precordial leads on the chest wall, (b) Directions of precordial lead vectors in the transverse plane.
  • 9.
    Figure 6.7 Blockdiagram of an electrocardiograph
  • 10.
  • 11.
  • 12.
  • 13.
    Figure 6.8 Effectof a voltage transient on an ECG recorded on an electrocardiograph in which the transient causes the amplifier to saturate, and a finite period of time is required for the charge to bleed off enough to bring the ECG back into the amplifier's active region of operation. This is followed by a first-order recovery of the system.
  • 14.
    Figure 6.9 (a)60 Hz power-line interference, (b) Electromyographic interference on the ECG.
  • 15.
    Figure 6.10 Amechanism of electric-field pickup of an electrocardiograph resulting from the power line. Coupling capacitance between the hot side of the power line and lead wires causes current to flow through skin–electrode impedances on its way to ground.
  • 16.
    Figure 6.11 Currentflows from the power line through the body and ground impedance, thus creating a common-mode voltage everywhere on the body. Zin is not only resistive but, as a result of RF bypass capacitors at the amplifier input, has a reactive component as well.
  • 17.
    Figure 6.12 Magnetic-fieldpickup by the electrocardiograph (a) Lead wires for lead I make a closed loop (shaded area) when patient and electrocardiograph are considered in the circuit. The change in magnetic field passing through this area induces a current in the loop, (b) This effect can be minimized by twisting the lead wires together and keeping them close to the body in order to subtend a much smaller area.
  • 18.
    Figure 6.13 Avoltage-protection scheme at the input of an electrocardiograph to protect the machine from high-voltage transients. Circuit elements connected across limb leads on left-hand side are voltage- limiting devices.
  • 19.
    Figure 6.14 Voltage-limitingdevices (a) Current–voltage characteristics of a voltage-limiting device, (b) Parallel silicon-diode voltage-limiting circuit, (c) Back-to-back silicon Zener-diode voltage-limiting circuit, (d) Gas-discharge tube (neon light) voltage-limiting circuit element.
  • 20.
    Figure 6.15 Driven-right-legcircuit for minimizing common-mode interference. The circuit derives common-mode voltage from a pair of averaging resistors connected to v3 and v4 in Figure 3.5. The right leg is not grounded but is connected to output of the auxiliary op amp.
  • 21.
    Figure E6.3 Equivalentcircuit of driven-right-leg system of Figure 6.15.
  • 22.
    Figure 6.16 Voltageand frequency ranges of some common biopotential signals; dc potentials include intracellular voltages as well as voltages measured from several points on the body. EOG is the electro-oculogram, EEG is the electroencephalogram, ECG is the electrocardiogram, EMG is the electromyogram, and AAP is the axon action potential. (From J. M. R. Delgado, "Electrodes for Extracellular Recording and Stimulation," in Physical Techniques in Biological Research, edited by W. L. Nastuk, New York: Academic Press, 1964)
  • 23.
    Figure 6.17 (a)Basic arrangement for negative-input-capacitance amplifier. Basic amplifier is on the right-hand side; equivalent source with lumped series resistance Rs and shunt capacitance Cs is on the left, (b) Equivalent circuit of basic negative-input-capacitance amplifier.
  • 24.
    Figure 6.18 ThisECG amplifier has a gain of 25 in the dc-coupled stages. The high-pass filter feeds a noninverting-amplifier stage that has a gain of 32. The total gain is 25 X 32 = 800. When mA 776 op amps were used, the circuit was found to have a CMRR of 86 dB at 100 Hz and a noise level of 40 mV peak to peak at the output. The frequency response was 0.04 to 150 Hz for ±3 dB and was flat over 4 to 40 Hz. A single op amp chip, the LM 324, that contains four individual op amps could also be used in this circuit reducing the total parts count.
  • 25.
    Figure 6.19 Timingdiagram for beat-to-beat cardiotachometer.
  • 26.
    Figure 6.20 Thevarious waveforms for the EMG integrator.
  • 27.
    Figure 6.21 Signal- averaging techniquefor improving the SNR in signals that are repetitive or respond to a known stimulus.
  • 28.
    Figure 6.22 Typicalfetal ECG obtained from the maternal abdomen. F represents fetal QRS complexes; M represents maternal QRS complexes. Maternal ECG and fetal ECG (recorded directly from the fetus) are included for comparison. (From "Monitoring of Intrapartum Phenomena," by J. F. Roux, M. R. Neuman, and R. C. Goodlin, in CRC Critical Reviews in Bioengineering, 2, pp. 119-158, January 1975, © CRC Press. Used by permission of CRC Press, Inc.)
  • 29.
    Figure 6.23 Blockdiagram of a scheme for isolating fetal ECG from an abdominal signal that contains both fetal and maternal ECGs. (From "Monitoring of Intrapartum Phenomena," by J. F. Roux, M. R. Neuman, and R. C. Goodlin, in CRC Critical Reviews in Bioengineering, 2, pp. 119–158, January 1975, © CRC Press. Used by permission of CRC Press, Inc.)
  • 30.
    Figure 6.24 Blockdiagram of a cardiac monitor.
  • 31.
    Figure 6.25 Blockdiagram of a system used with cardiac monitors to detect increased electrode impedance, lead wire failure, or electrode fall-off.
  • 32.
    The ECG shownis distorted as a result of an instrumentation problem. Discuss possible causes of this distortion, and suggest means of correcting the problem.
  • 33.
    The figure showsECGs from simultaneous leads I and II. Sketch the vector loop for this QRS complex in the frontal plane.