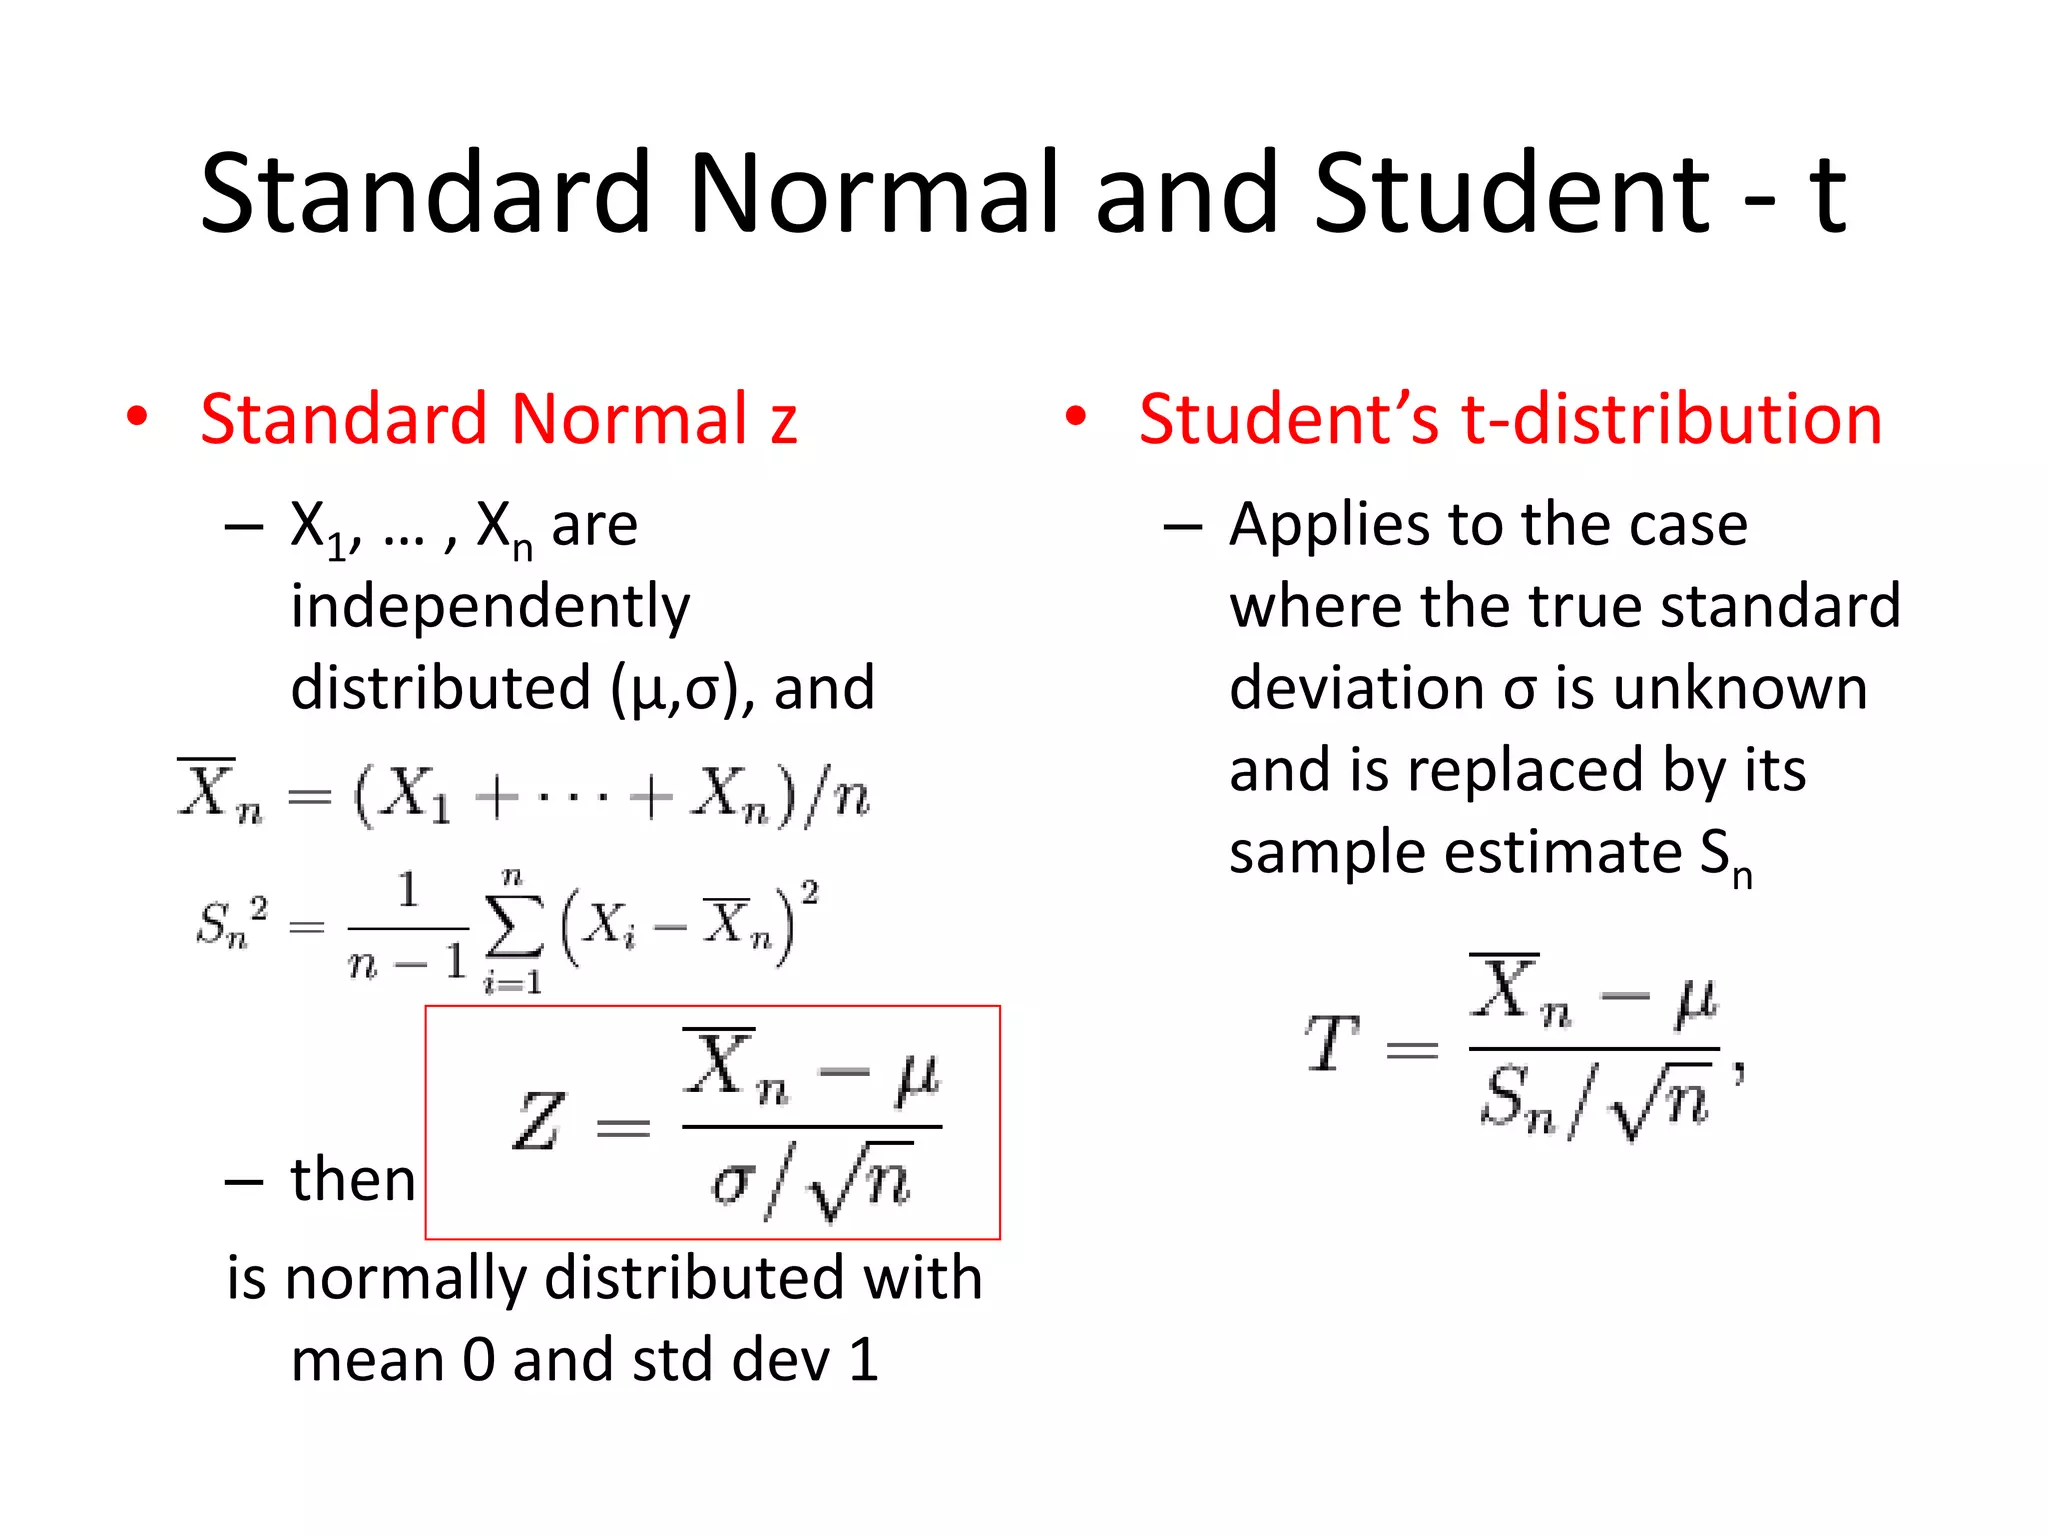
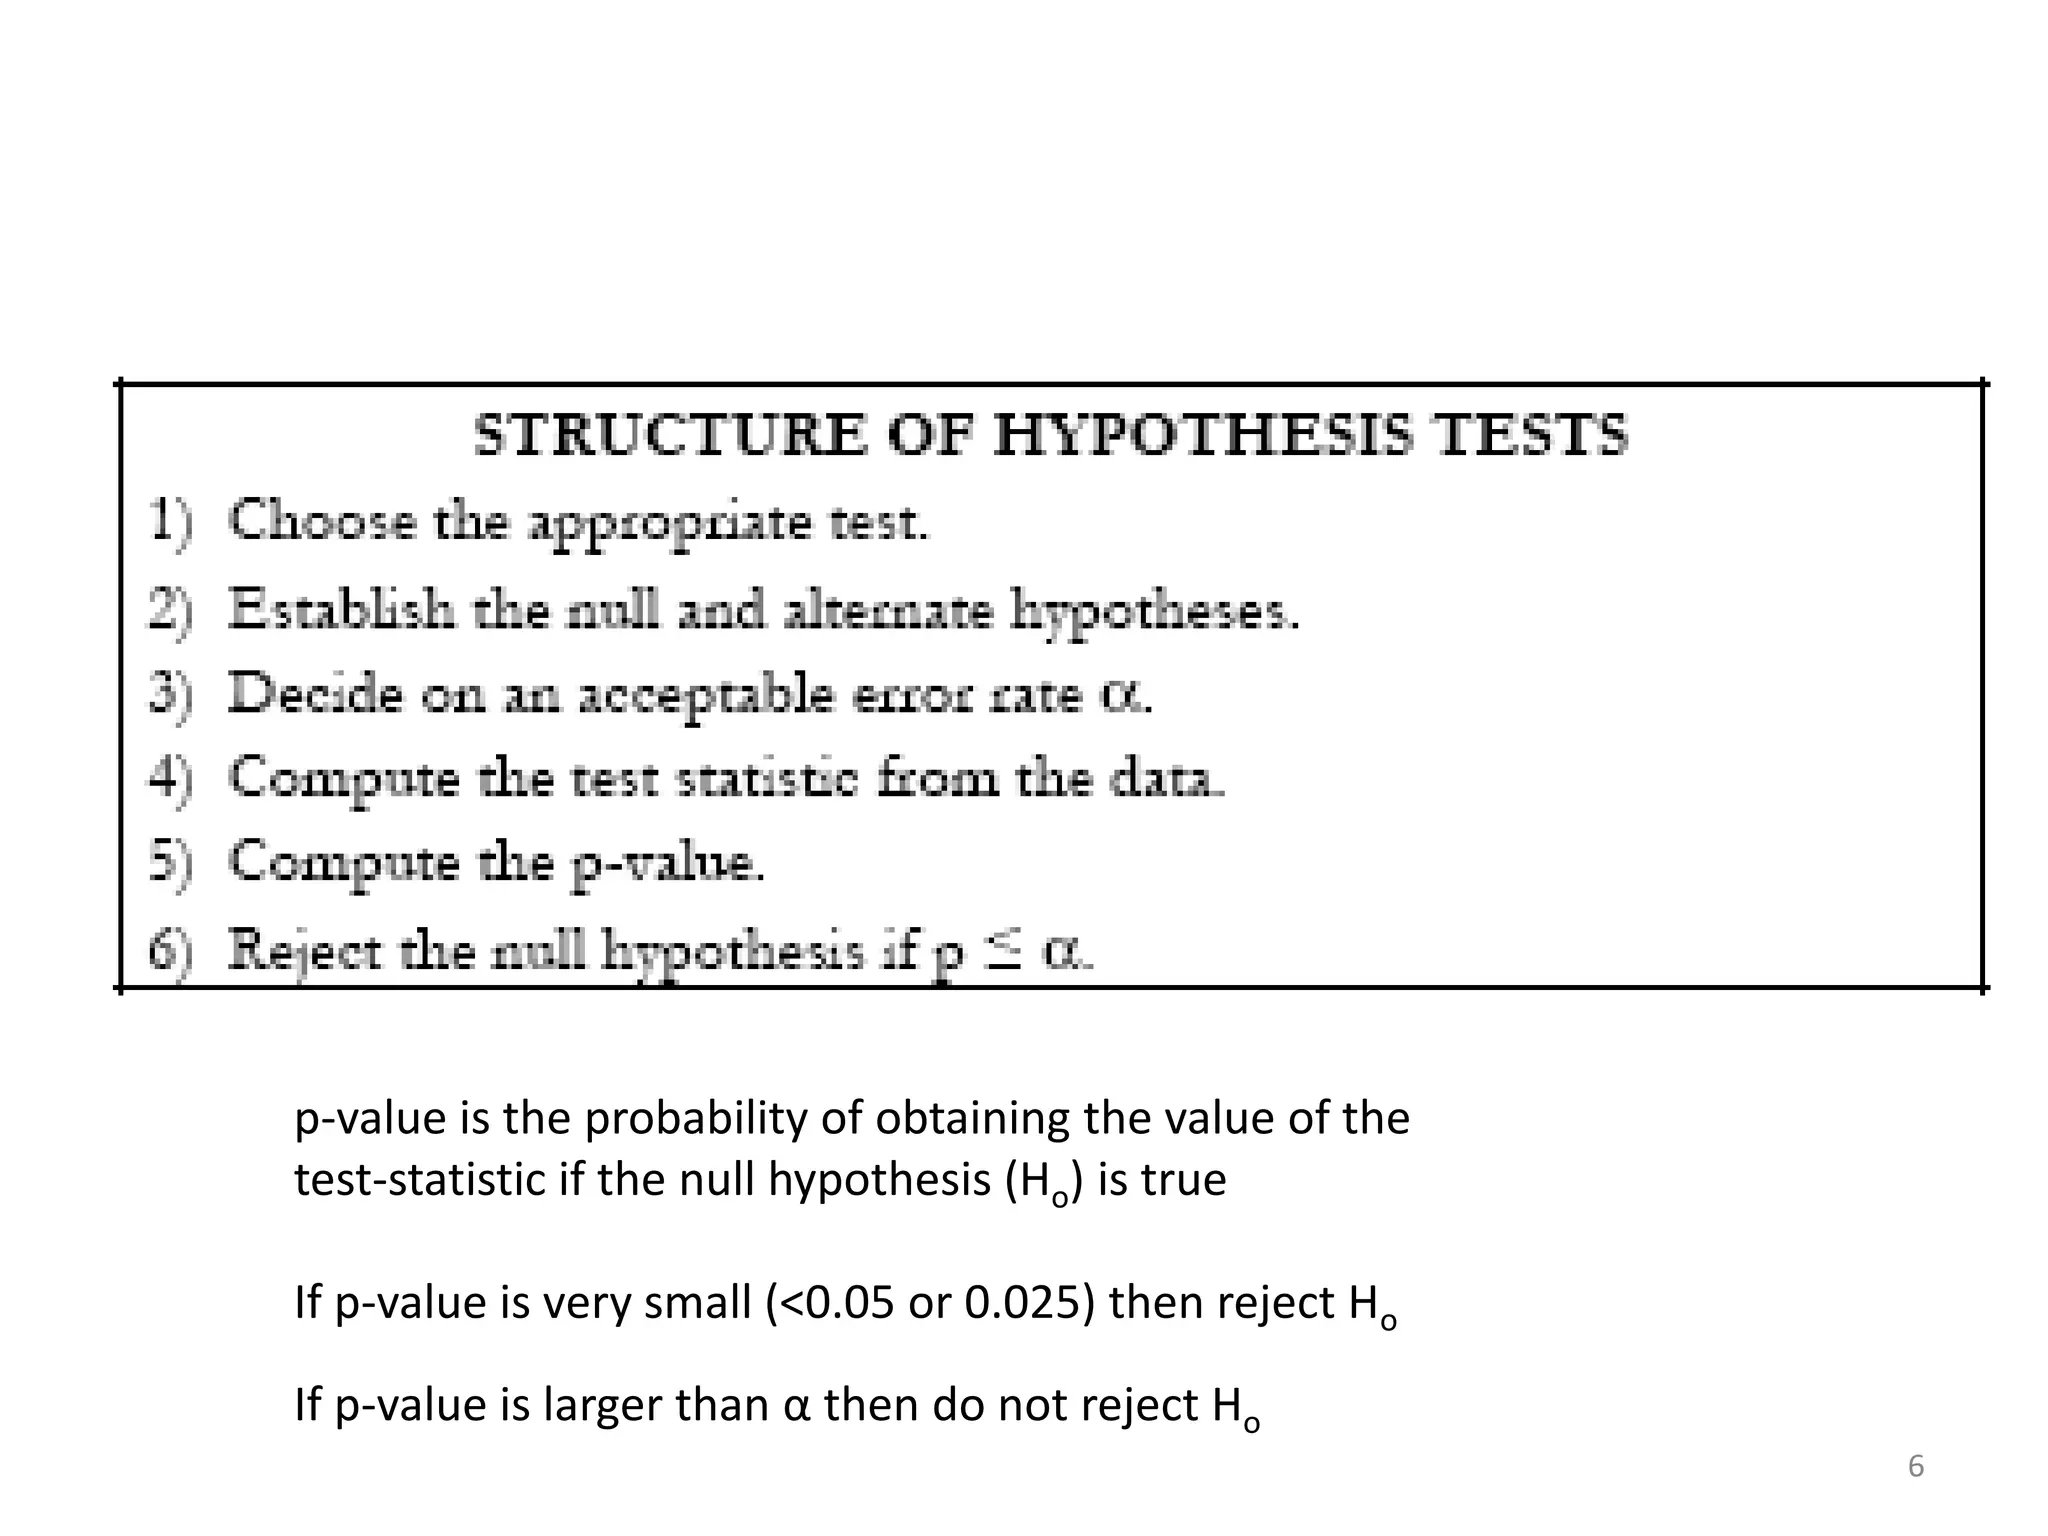
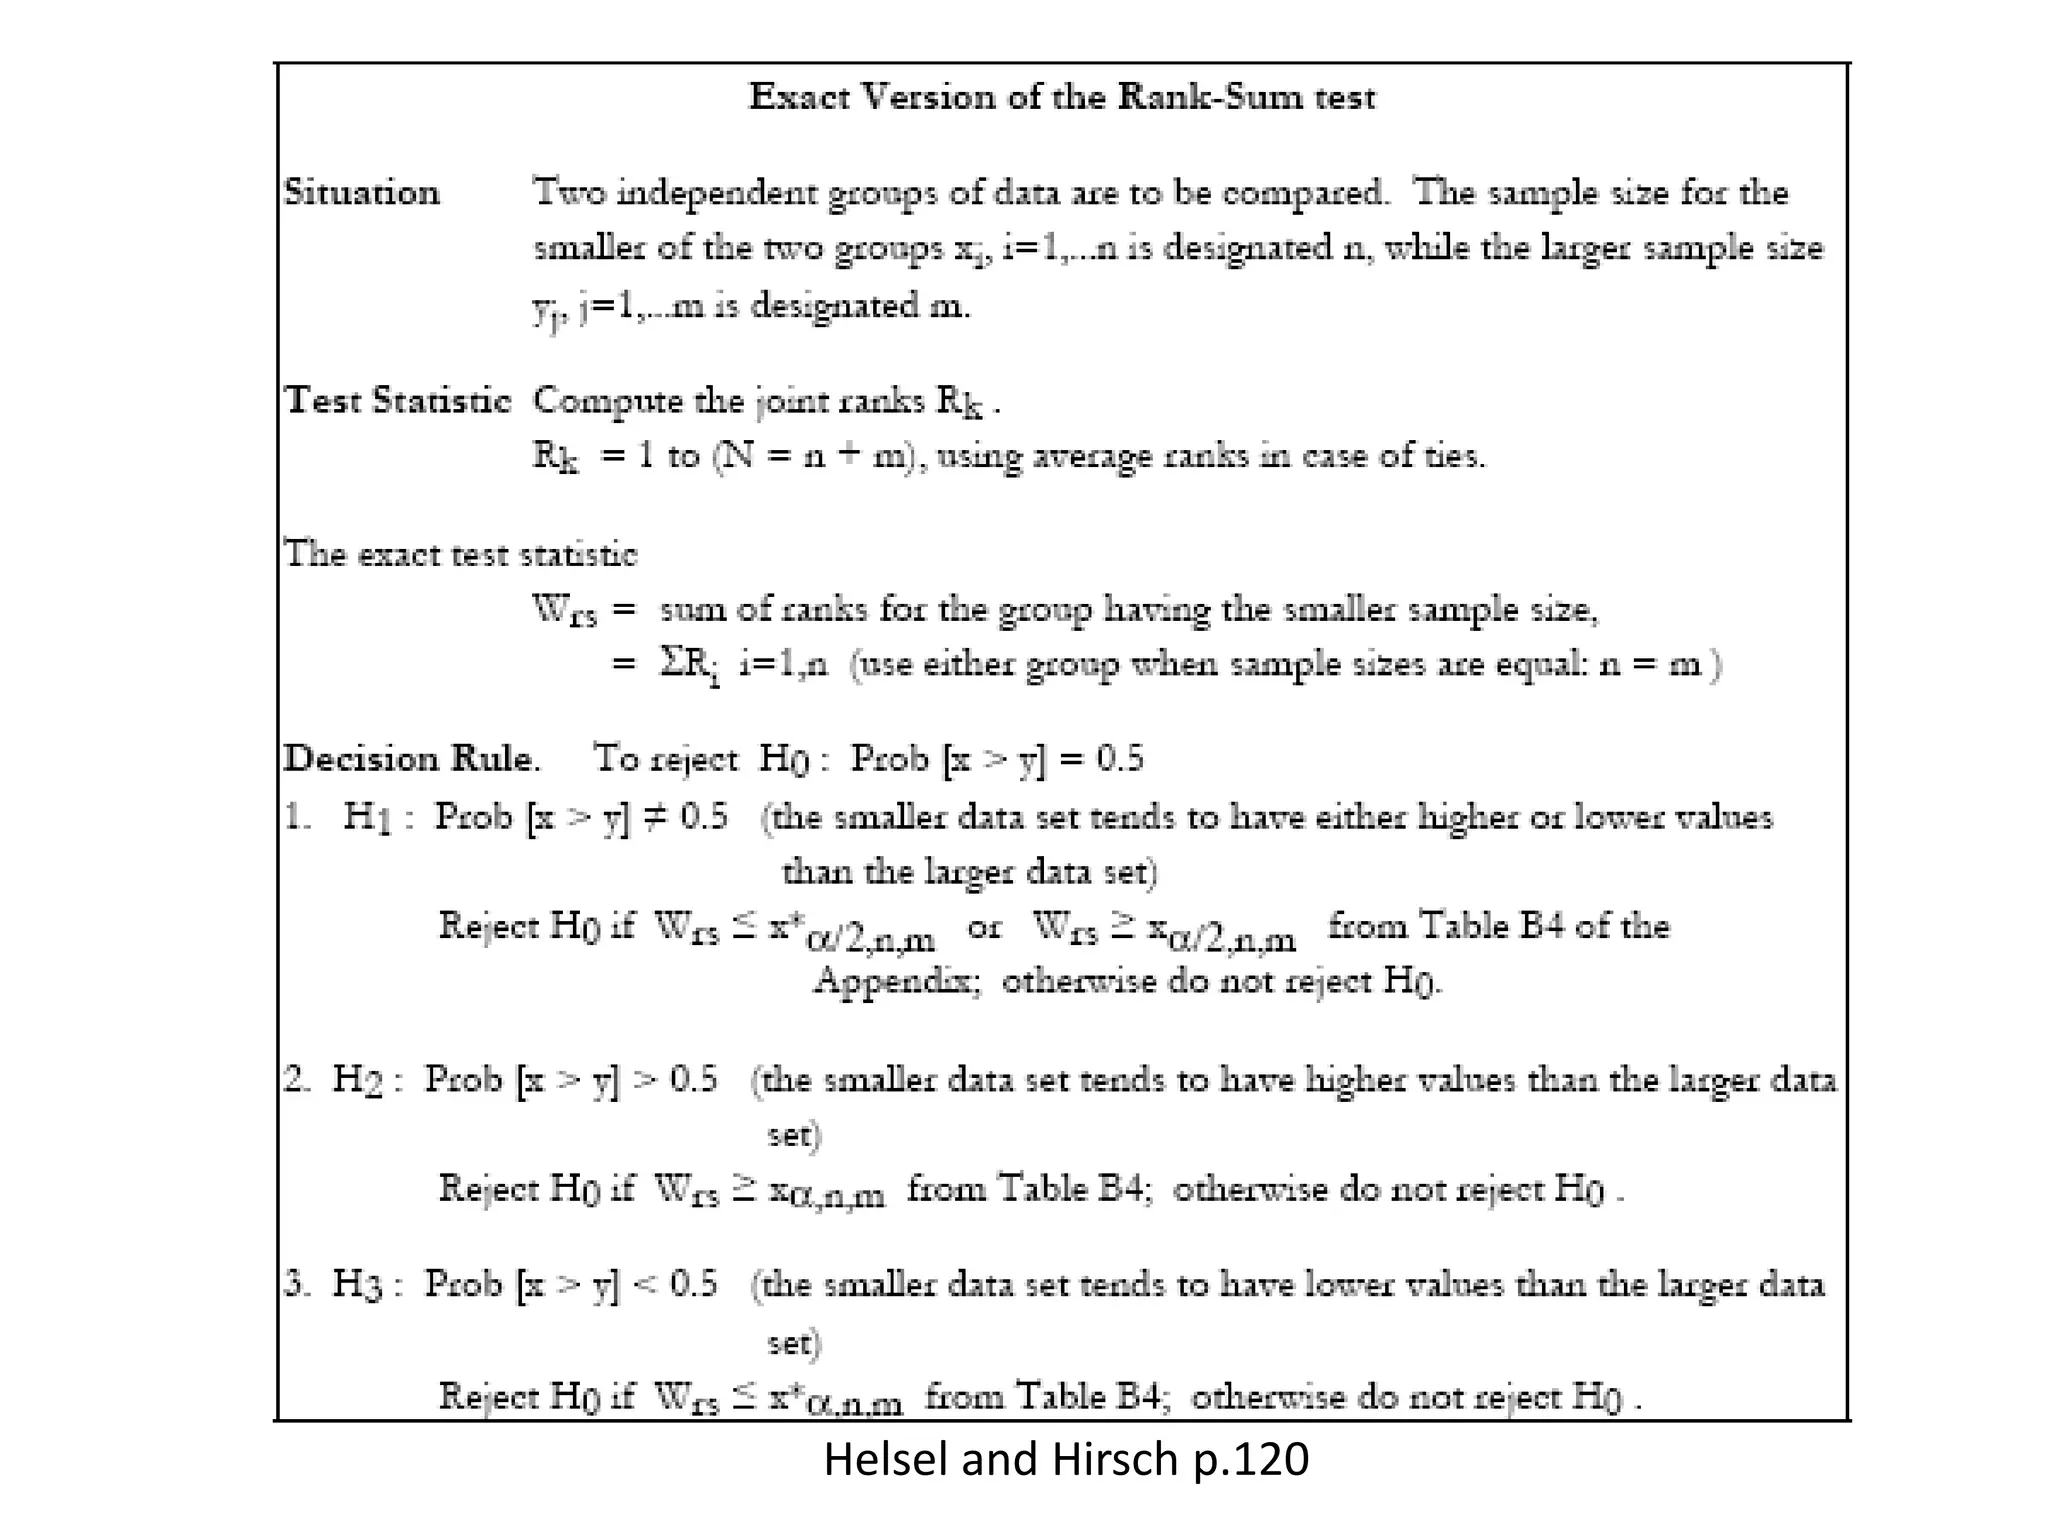
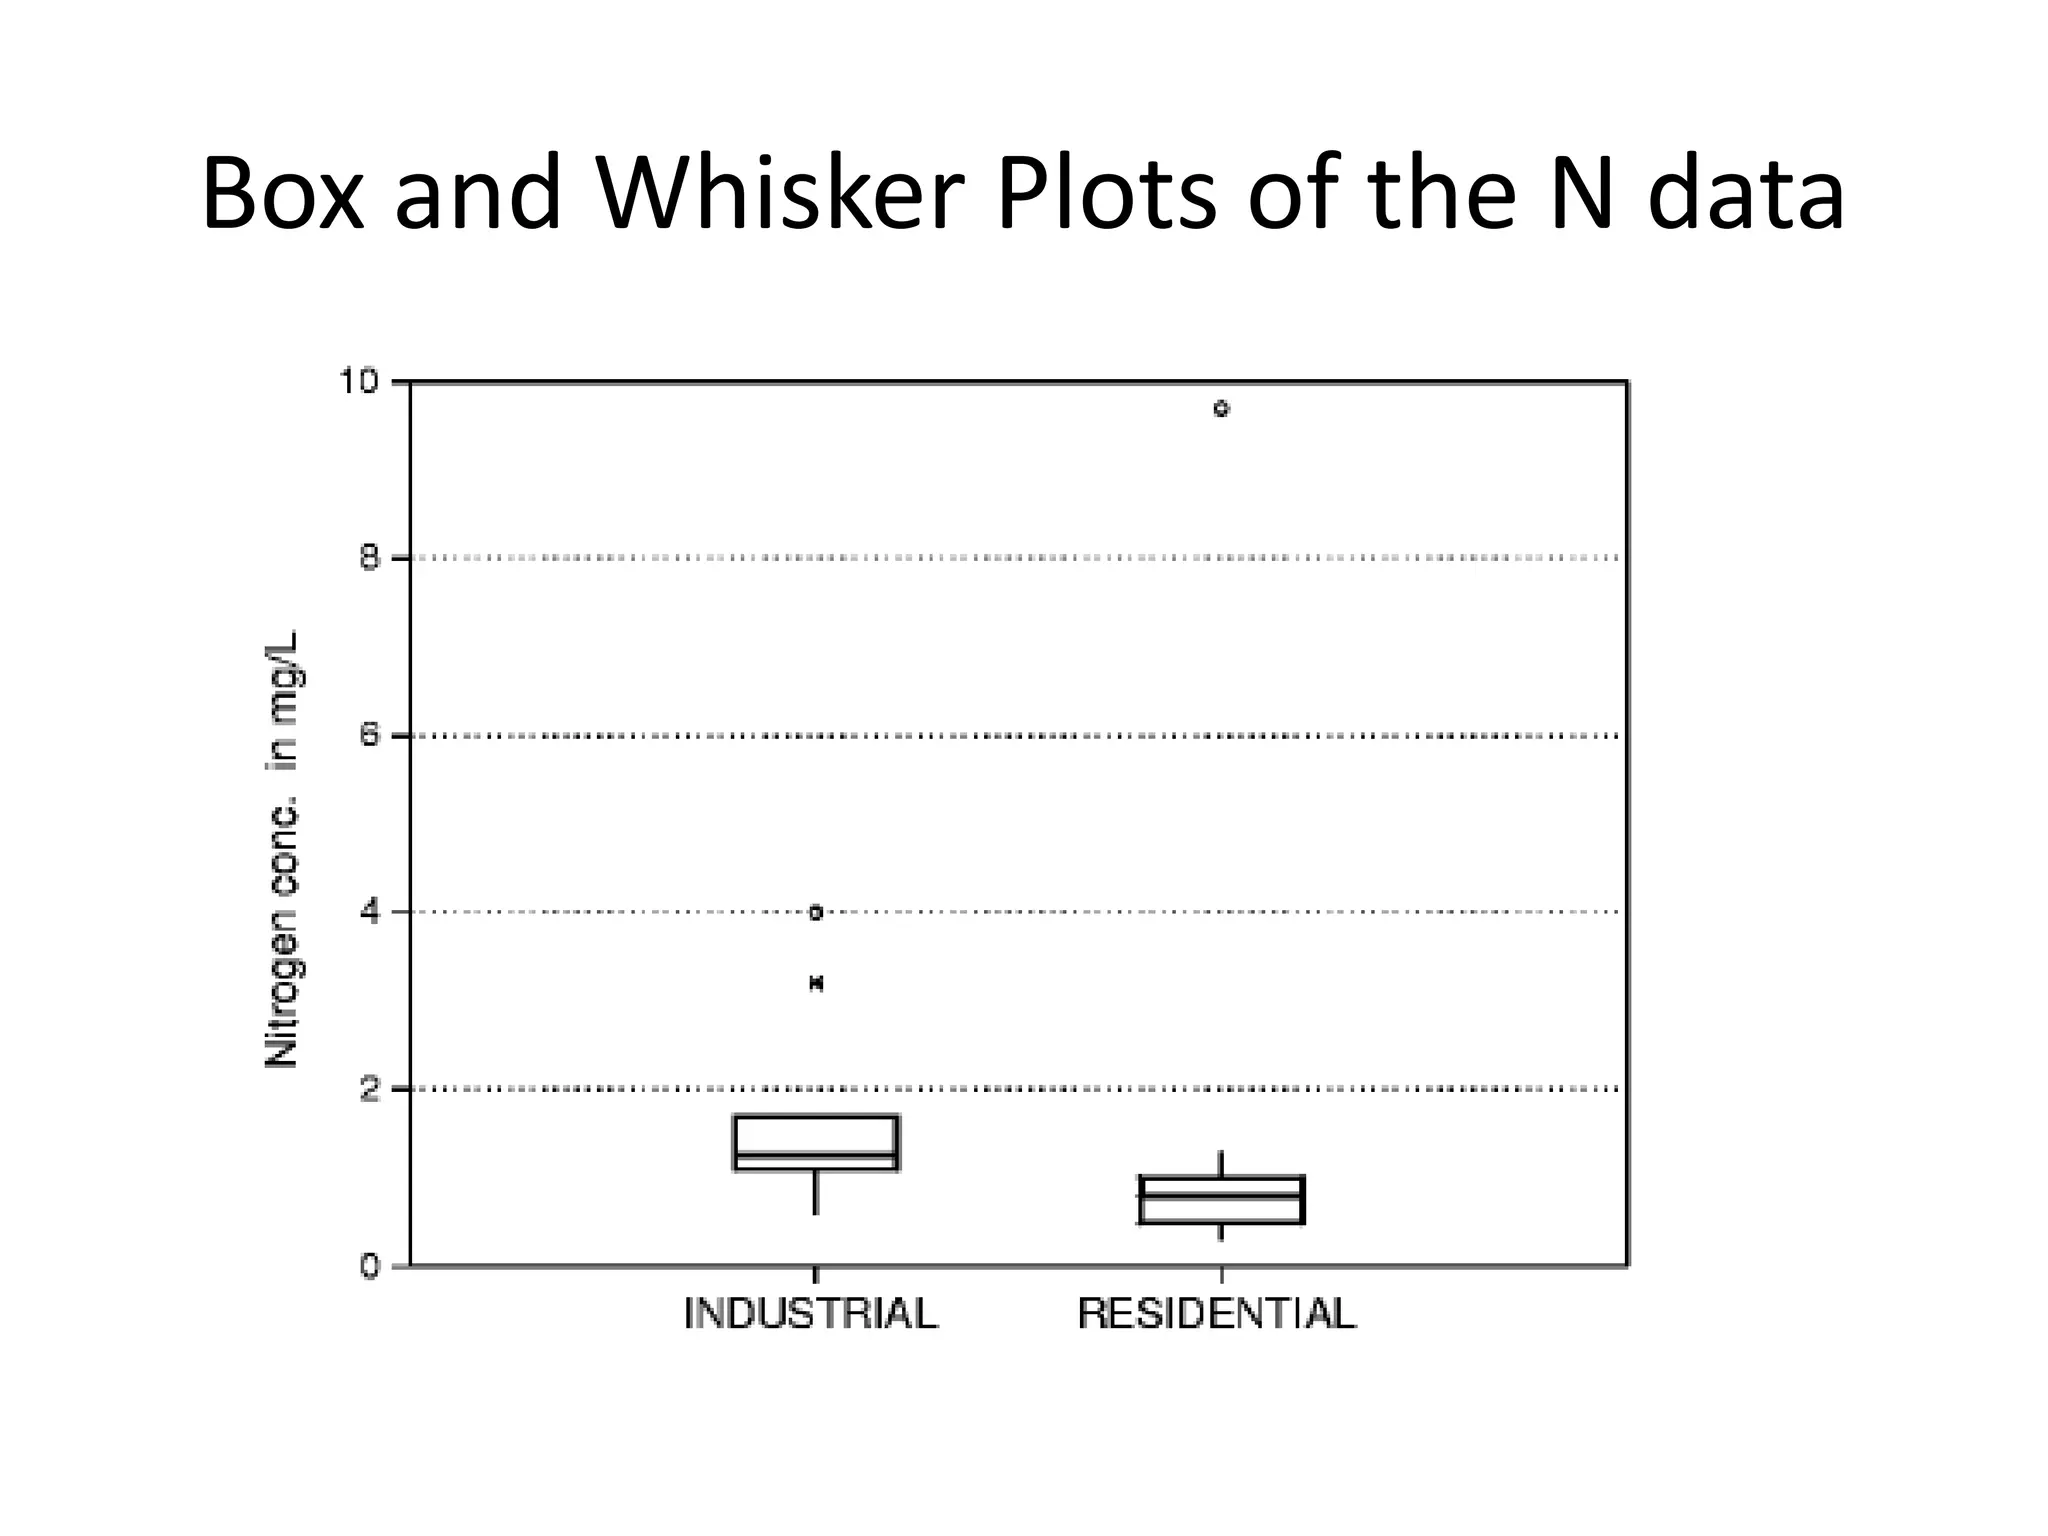
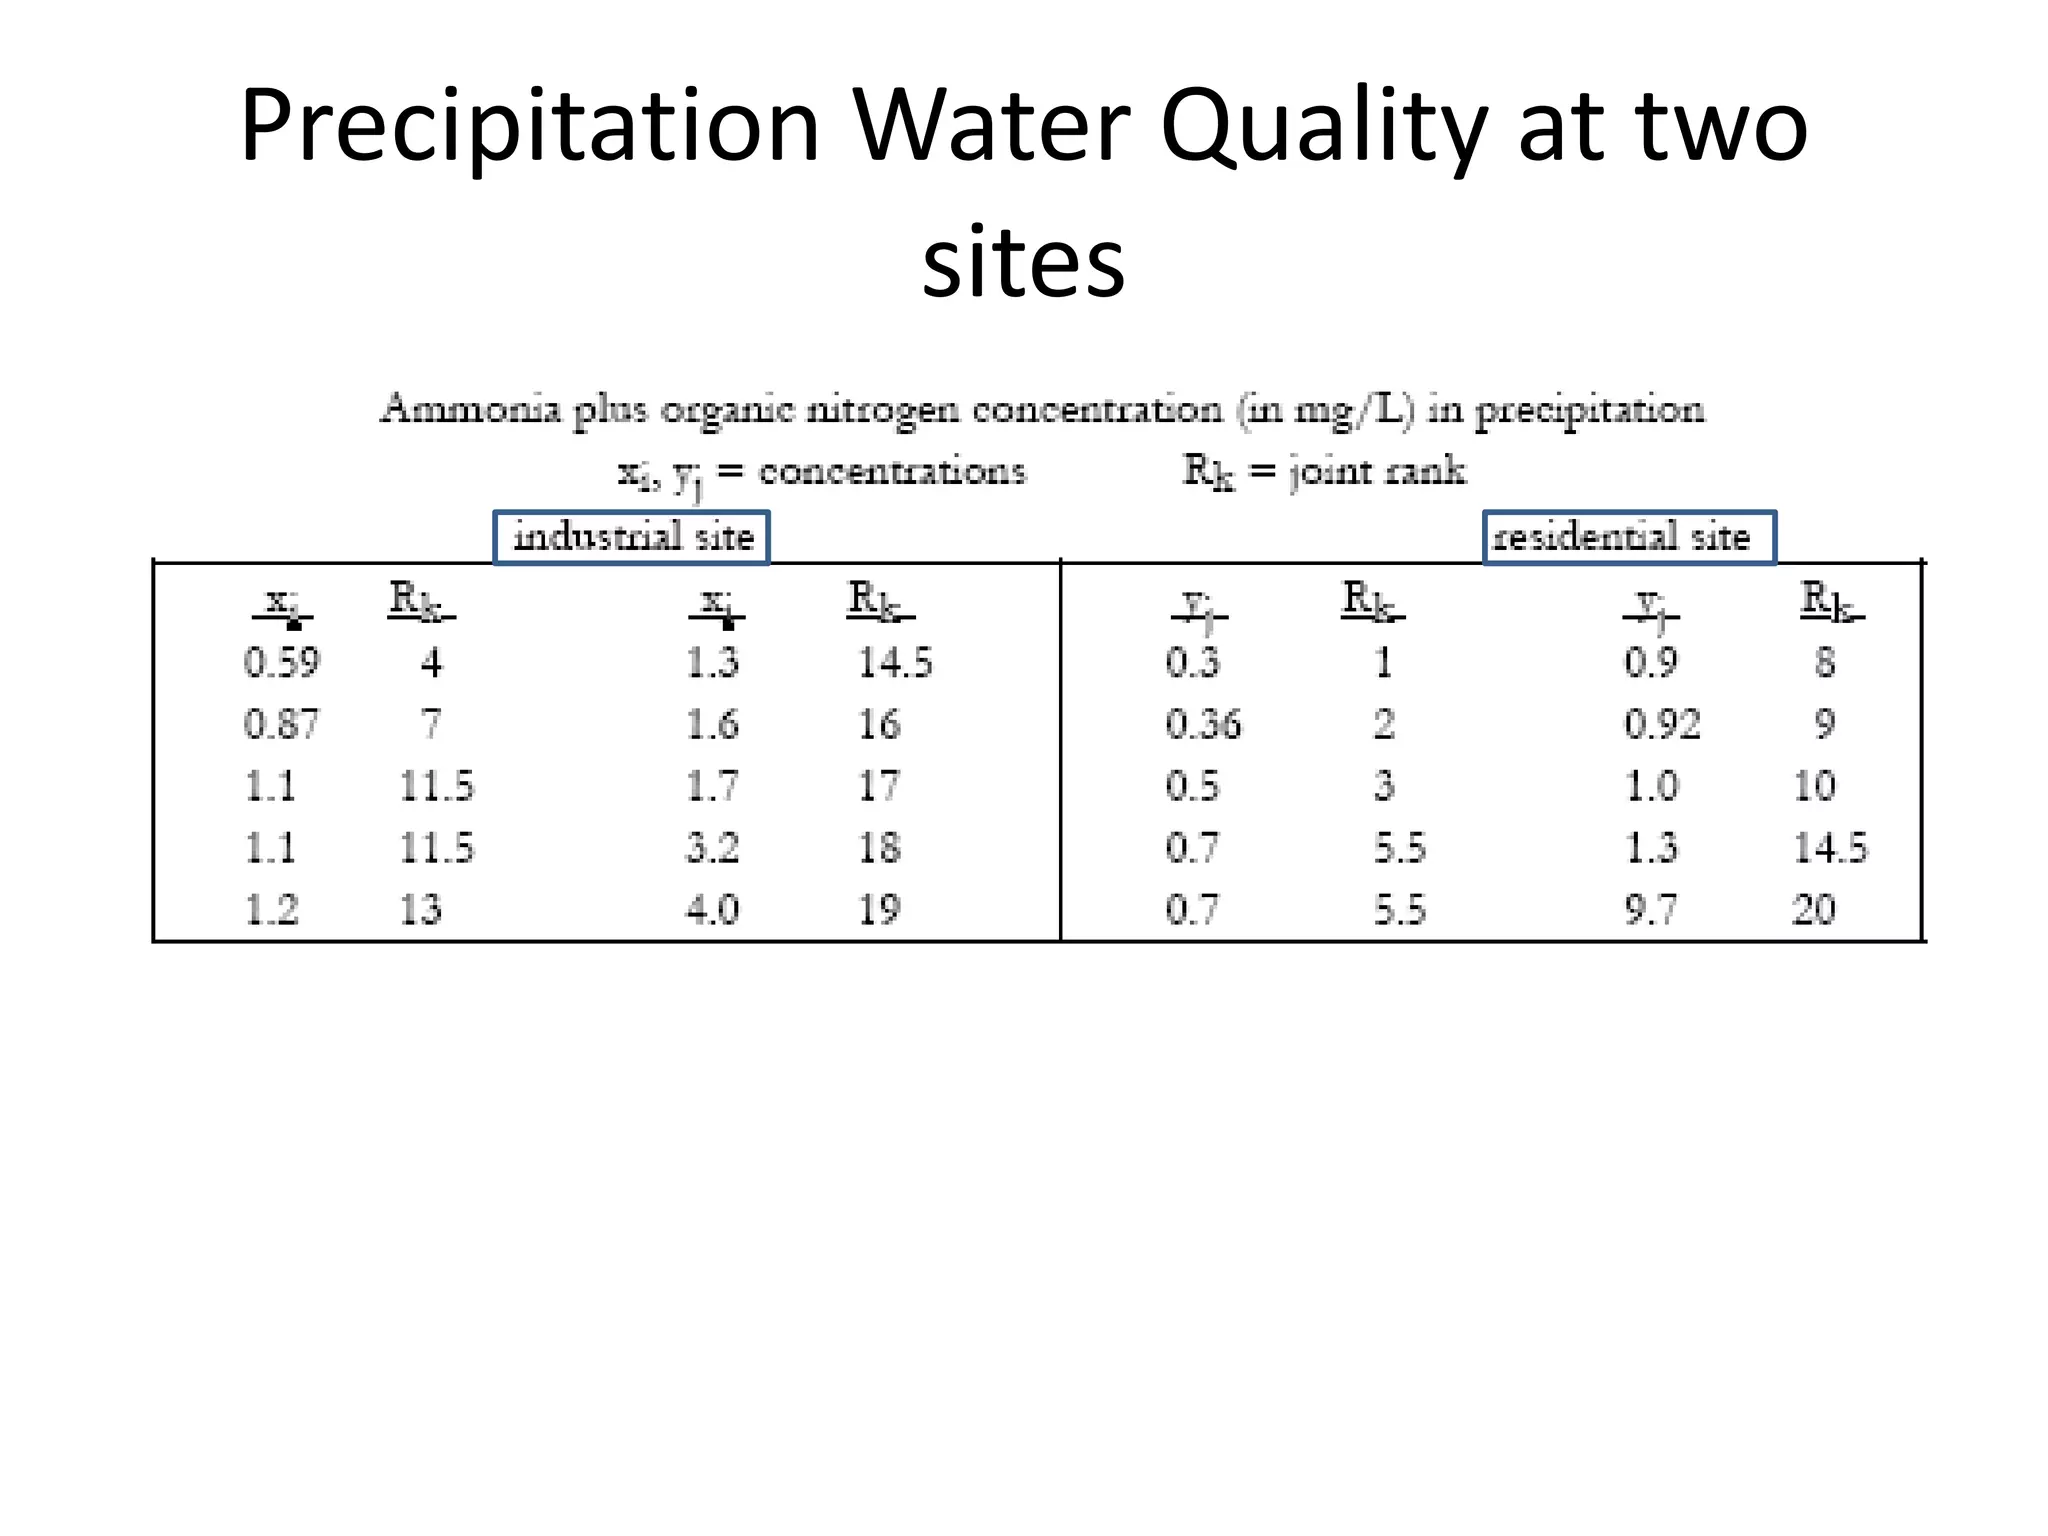
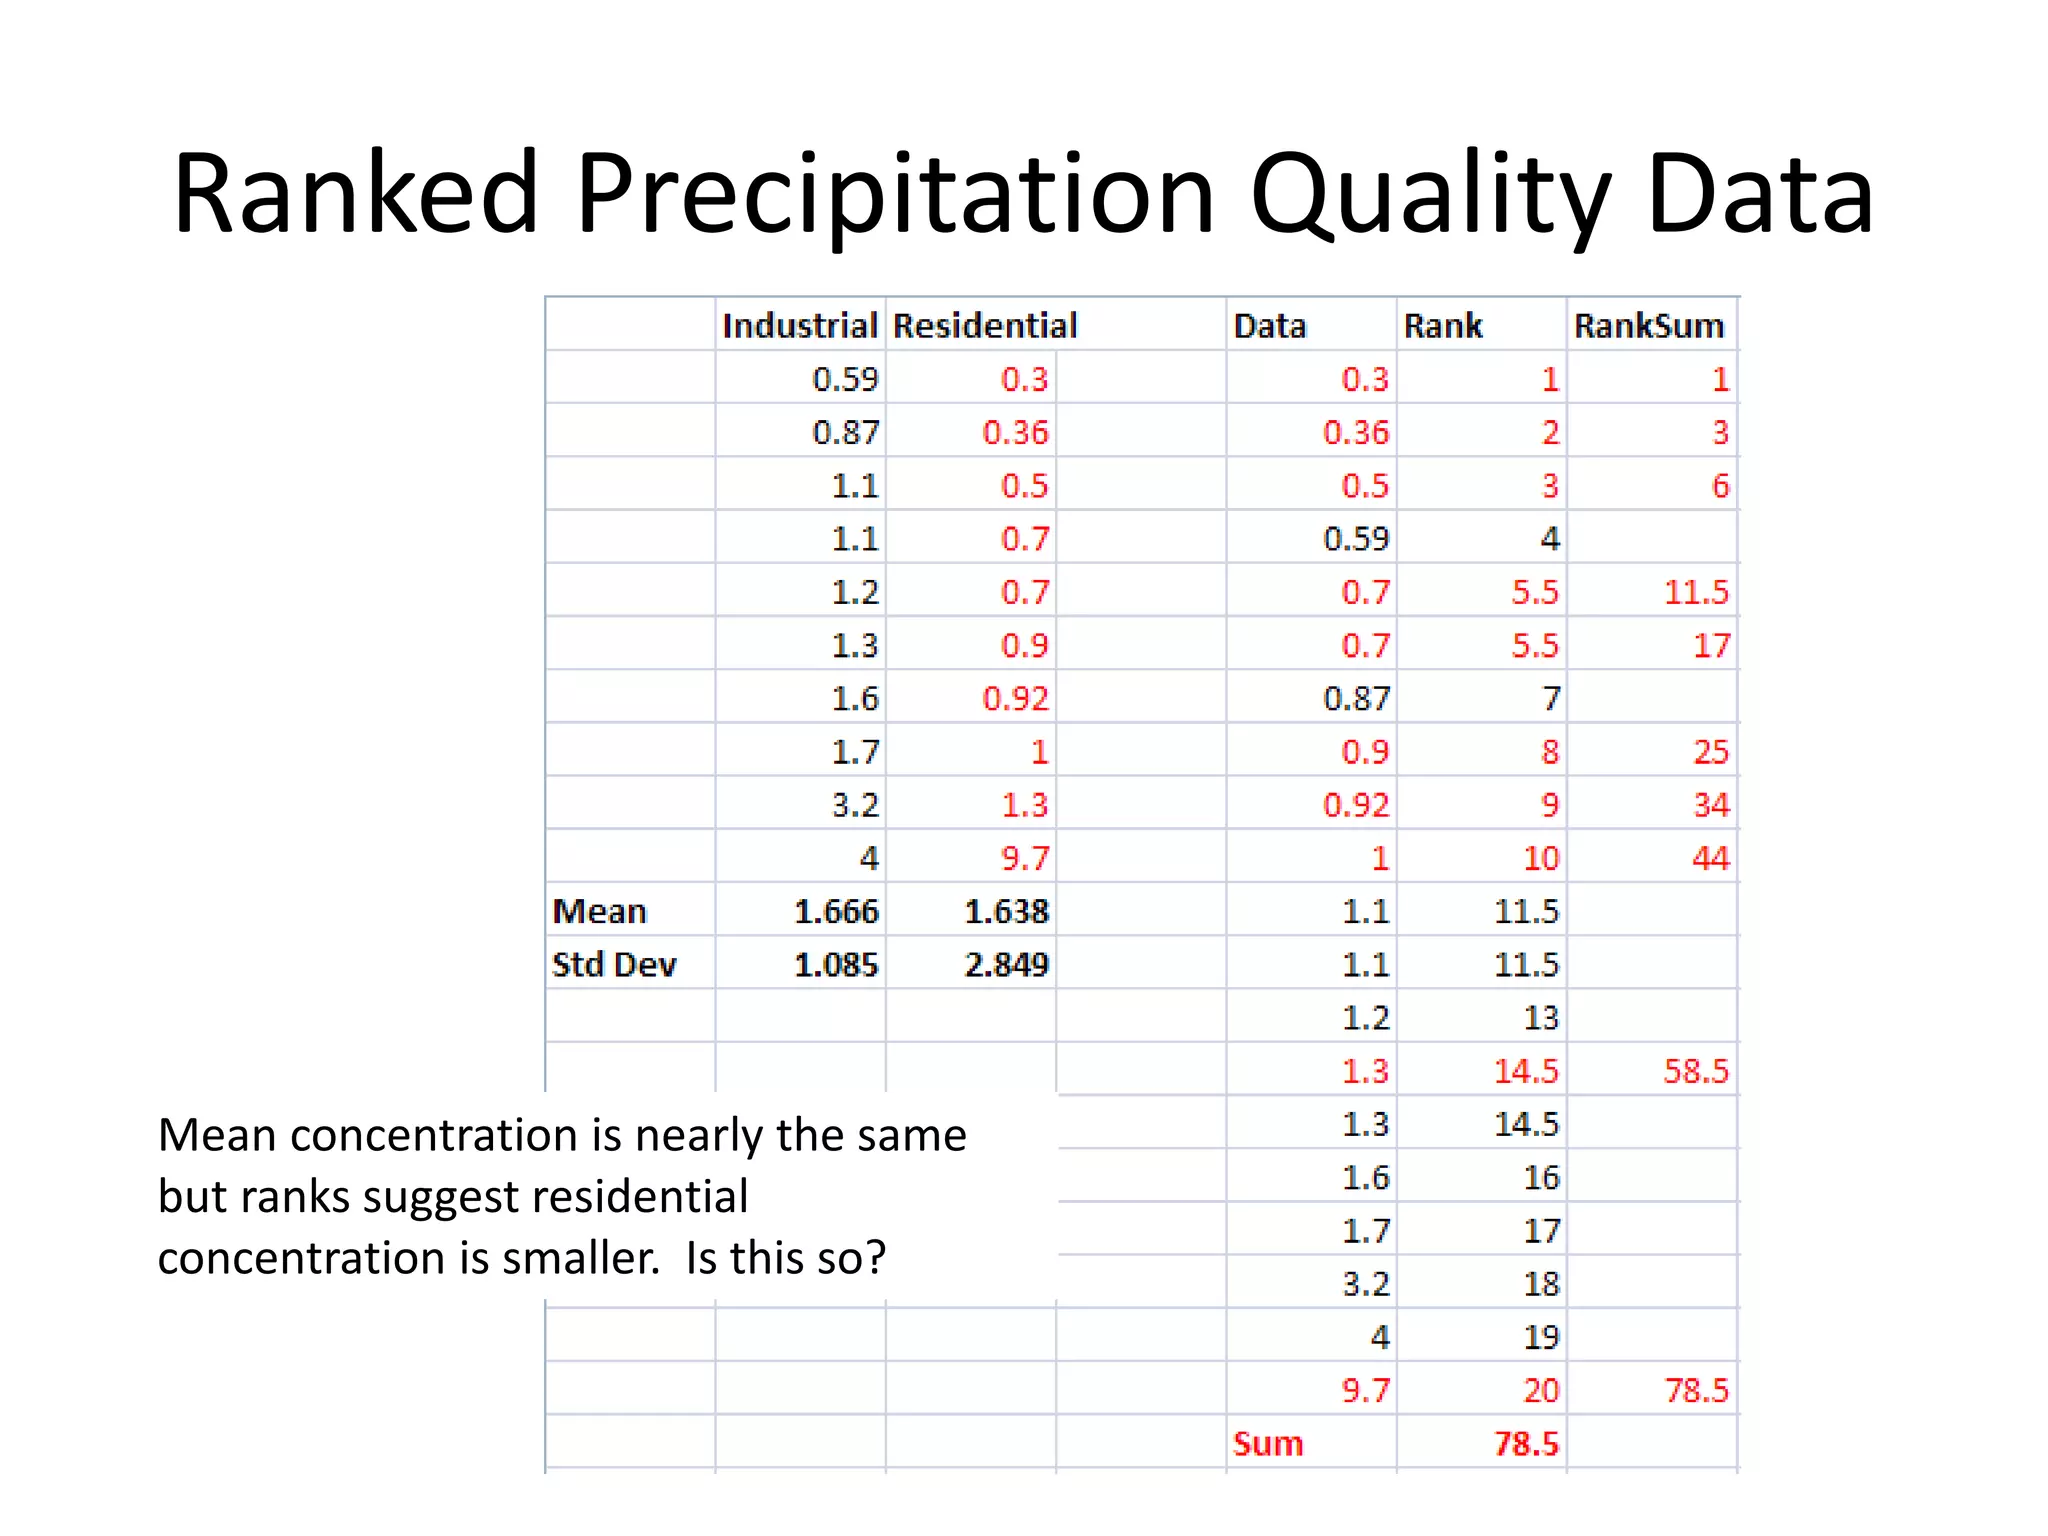
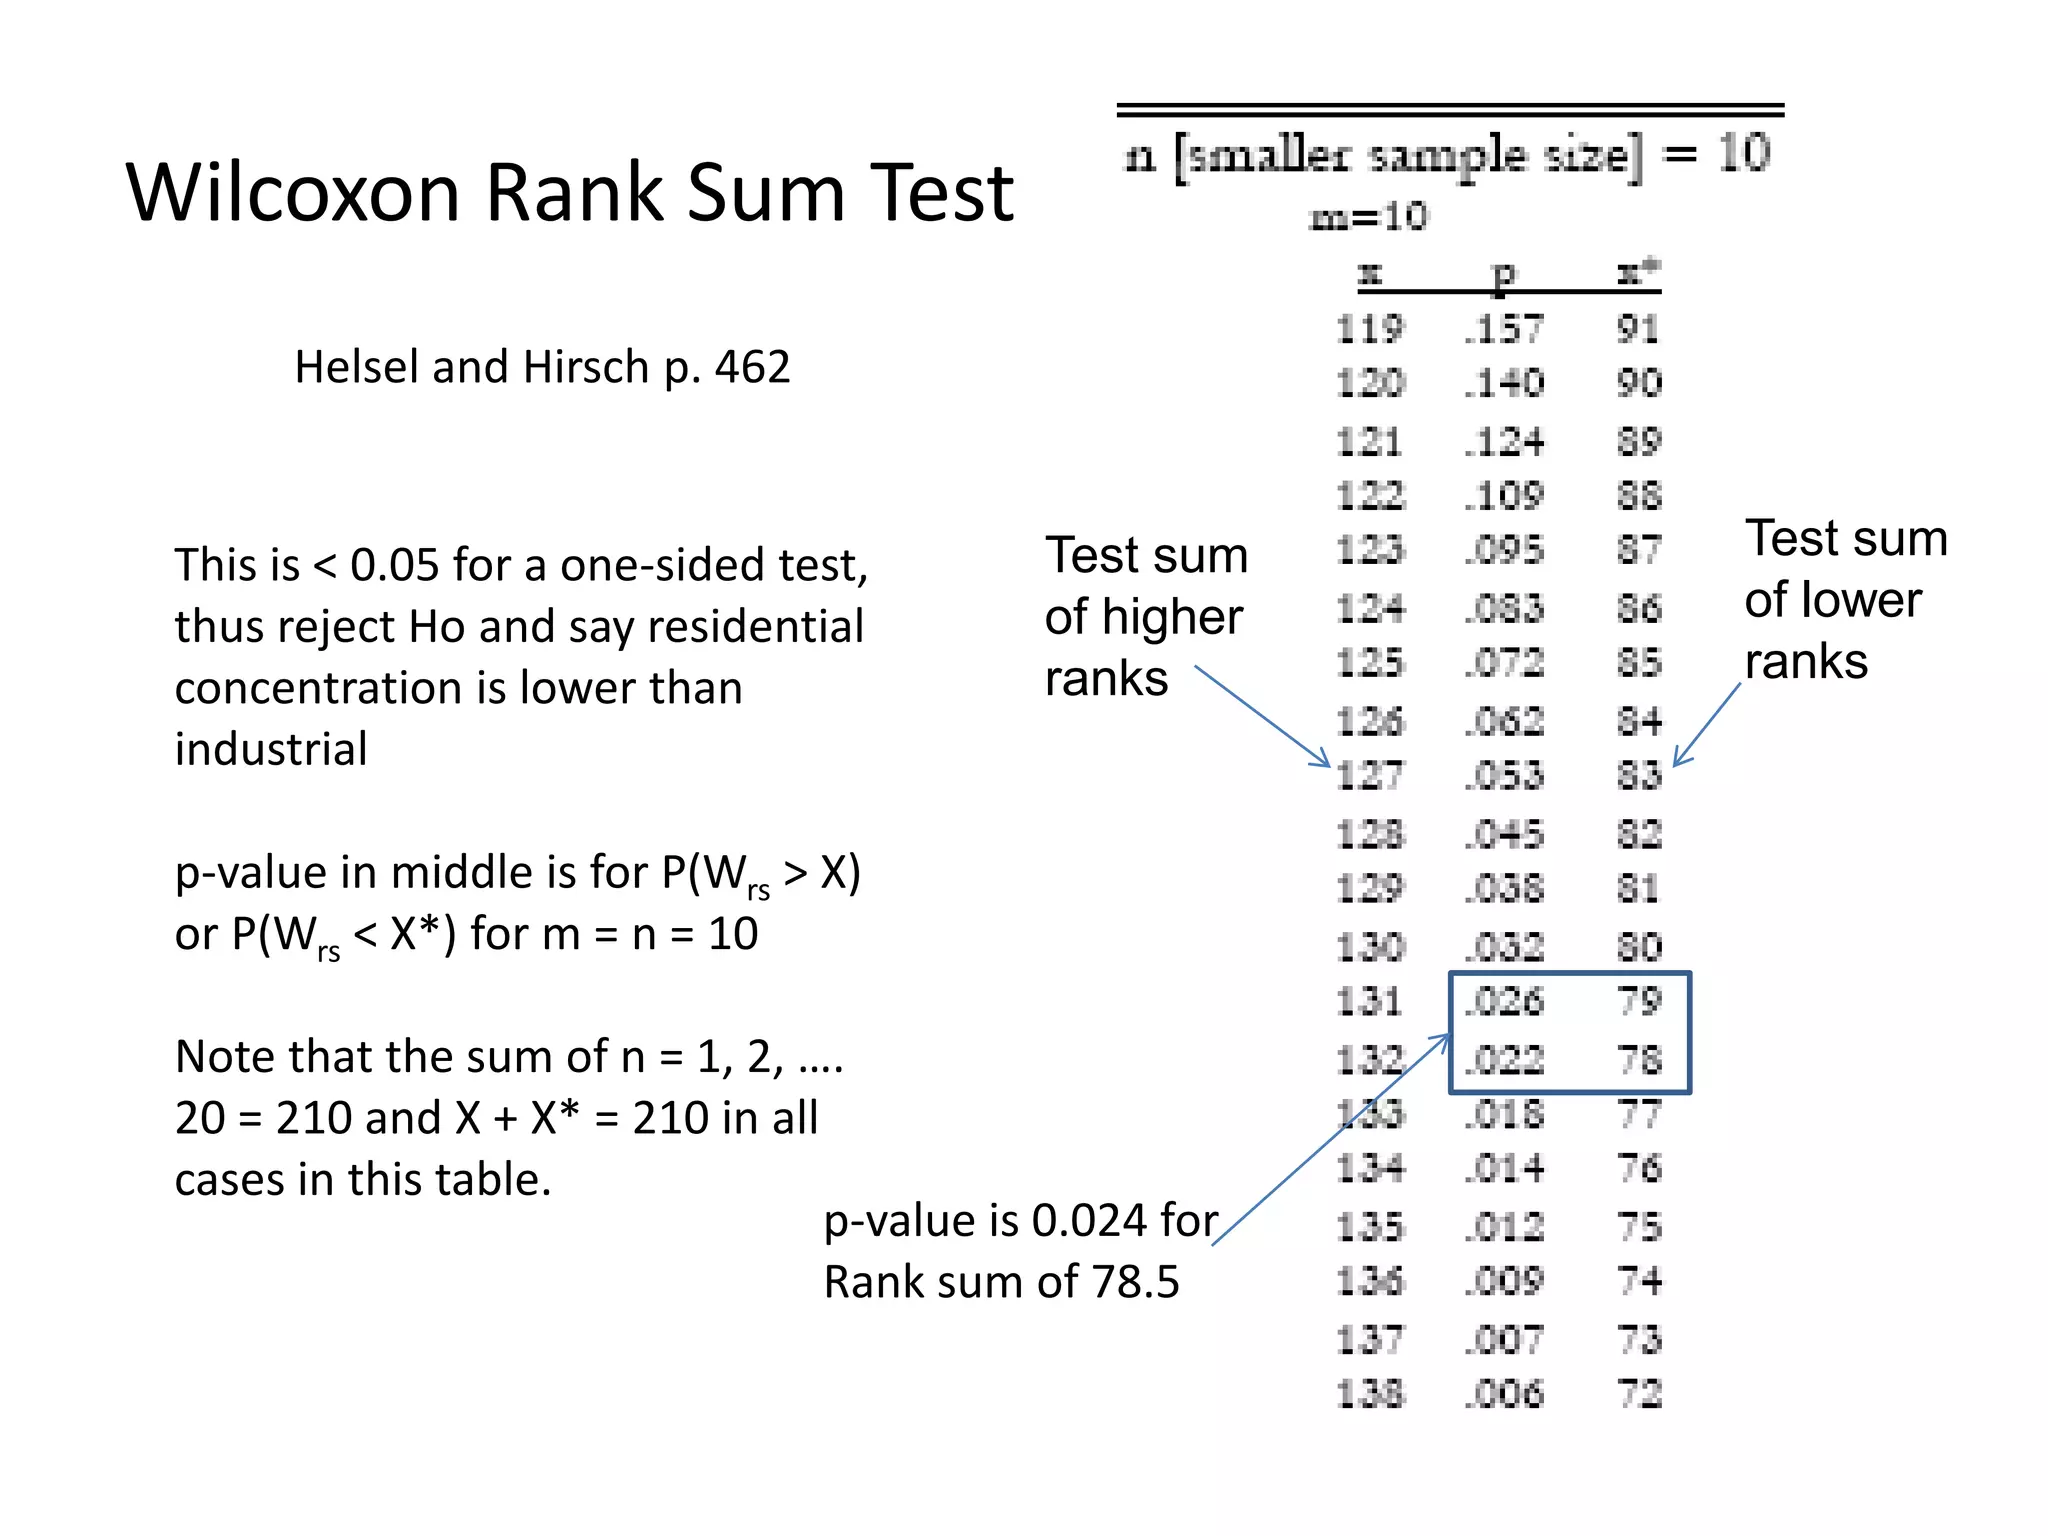
Statistics in Water Resources, Lecture 6
• Key theme
– T-distribution for distributions where standard
deviation is unknown
– Hypothesis testing
– Comparing two sets of data to see if they are
different
• Reading: Helsel and Hirsch, Chapter 6
Matched Pair Tests
Chi-Square Distribution
http://en.wikipedia.org/wiki/Chi-square_distribution
t-, z and ChiSquare
Source: http://en.wikipedia.org/wiki/Student's_t-distribution
Normal and t-distributions
Normal
t-dist for ν = 1
t-dist for ν = 30
t-dist for ν = 5
t-dist for ν = 3
t-dist for ν = 2
t-dist for ν = 10
• Standard Normal z
– X1, … , Xn are
independently
distributed (μ,σ), and
– then
is normally distributed with
mean 0 and std dev 1
Standard Normal and Student - t
• Student’s t-distribution
– Applies to the case
where the true standard
deviation σ is unknown
and is replaced by its
sample estimate Sn
6
p-value is the probability of obtaining the value of the
test-statistic if the null hypothesis (Ho) is true
If p-value is very small (<0.05 or 0.025) then reject Ho
If p-value is larger than α then do not reject Ho
One-sided test
Two-sided test
Helsel and Hirsch p.120
Box and Whisker Plots of the N data
Precipitation Water Quality at two
sites
Ranked Precipitation Quality Data
Mean concentration is nearly the same
but ranks suggest residential
concentration is smaller. Is this so?
Wilcoxon Rank Sum Test
Helsel and Hirsch p. 462
This is < 0.05 for a one-sided test,
thus reject Ho and say residential
concentration is lower than
industrial
p-value in middle is for P(Wrs > X)
or P(Wrs < X*) for m = n = 10
Note that the sum of n = 1, 2, ….
20 = 210 and X + X* = 210 in all
cases in this table.
Test sum
of higher
ranks
Test sum
of lower
ranks
p-value is 0.024 for
Rank sum of 78.5
StatWRLecture6.ppt
StatWRLecture6.ppt

StatWRLecture6.ppt

  • 1.
    Statistics in WaterResources, Lecture 6 • Key theme – T-distribution for distributions where standard deviation is unknown – Hypothesis testing – Comparing two sets of data to see if they are different • Reading: Helsel and Hirsch, Chapter 6 Matched Pair Tests
  • 2.
  • 3.
    t-, z andChiSquare Source: http://en.wikipedia.org/wiki/Student's_t-distribution
  • 4.
    Normal and t-distributions Normal t-distfor ν = 1 t-dist for ν = 30 t-dist for ν = 5 t-dist for ν = 3 t-dist for ν = 2 t-dist for ν = 10
  • 5.
    • Standard Normalz – X1, … , Xn are independently distributed (μ,σ), and – then is normally distributed with mean 0 and std dev 1 Standard Normal and Student - t • Student’s t-distribution – Applies to the case where the true standard deviation σ is unknown and is replaced by its sample estimate Sn
  • 6.
    6 p-value is theprobability of obtaining the value of the test-statistic if the null hypothesis (Ho) is true If p-value is very small (<0.05 or 0.025) then reject Ho If p-value is larger than α then do not reject Ho
  • 7.
  • 8.
  • 9.
  • 10.
    Box and WhiskerPlots of the N data
  • 11.
  • 12.
    Ranked Precipitation QualityData Mean concentration is nearly the same but ranks suggest residential concentration is smaller. Is this so?
  • 13.
    Wilcoxon Rank SumTest Helsel and Hirsch p. 462 This is < 0.05 for a one-sided test, thus reject Ho and say residential concentration is lower than industrial p-value in middle is for P(Wrs > X) or P(Wrs < X*) for m = n = 10 Note that the sum of n = 1, 2, …. 20 = 210 and X + X* = 210 in all cases in this table. Test sum of higher ranks Test sum of lower ranks p-value is 0.024 for Rank sum of 78.5