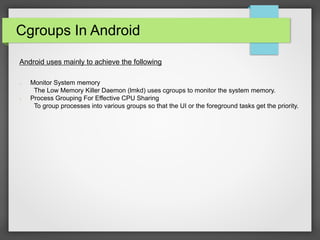
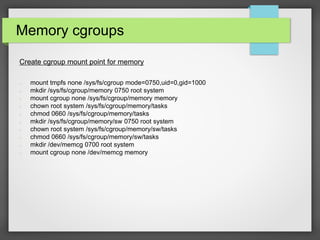
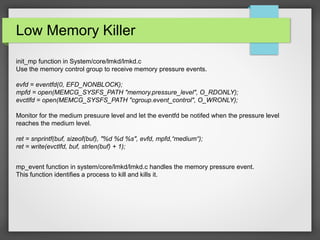
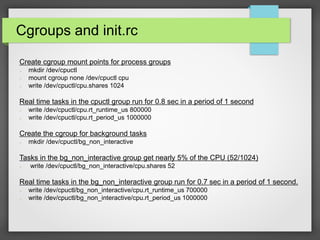
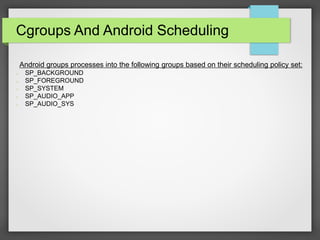
Android uses cgroups to monitor system memory usage via the Low Memory Killer daemon and to group processes for effective CPU sharing. Cgroups are used to create mount points for memory and CPU control groups. The LMK daemon uses cgroups to receive memory pressure events and kill processes as needed. Init.rc uses cgroups to create groups for real-time and background tasks and assign CPU shares. Android further groups processes by scheduling policy for scheduling priorities.
The Linux Block Layer - Built for Fast StorageKernel TLV
The arrival of flash storage introduced a radical change in performance profiles of direct attached devices. At the time, it was obvious that Linux I/O stack needed to be redesigned in order to support devices capable of millions of IOPs, and with extremely low latency.
In this talk we revisit the changes the Linux block layer in the
last decade or so, that made it what it is today - a performant, scalable, robust and NUMA-aware subsystem. In addition, we cover the new NVMe over Fabrics support in Linux.
Sagi Grimberg
Sagi is Principal Architect and co-founder at LightBits Labs.
Presentation at Android Builders Summit 2012.
Based on the experience of working with ODM companies and SoC vendors, this session would discuss how to figure out the performance hotspot of certain Android devices and then improve in various areas including graphics and boot time. This session consists of the detailed components which seem to be independent from each other in traditional view. However, the situation changes a lot in Android system view since everything is coupled in a mass. Three frequently mentioned items in Android engineering are selected as the entry points: 2D/3D graphics, runtime, and boot time. Audience: Developers who work on Android system integration and platform enablement.
Performance Wins with BPF: Getting StartedBrendan Gregg
Keynote by Brendan Gregg for the eBPF summit, 2020. How to get started finding performance wins using the BPF (eBPF) technology. This short talk covers the quickest and easiest way to find performance wins using BPF observability tools on Linux.
Talk by Brendan Gregg for USENIX LISA 2019: Linux Systems Performance. Abstract: "
Systems performance is an effective discipline for performance analysis and tuning, and can help you find performance wins for your applications and the kernel. However, most of us are not performance or kernel engineers, and have limited time to study this topic. This talk summarizes the topic for everyone, touring six important areas of Linux systems performance: observability tools, methodologies, benchmarking, profiling, tracing, and tuning. Included are recipes for Linux performance analysis and tuning (using vmstat, mpstat, iostat, etc), overviews of complex areas including profiling (perf_events) and tracing (Ftrace, bcc/BPF, and bpftrace/BPF), and much advice about what is and isn't important to learn. This talk is aimed at everyone: developers, operations, sysadmins, etc, and in any environment running Linux, bare metal or the cloud."
Let's trace Linux Lernel with KGDB @ COSCUP 2021Jian-Hong Pan
https://coscup.org/2021/en/session/39M73K
https://www.youtube.com/watch?v=L_Gyvdl_d_k
Engineers have plenty of debug tools for user space programs development, code tracing, debugging and analyzing. Except “printk”, do we have any other debug tools for Linux kernel development? The “KGDB” mentioned in Linux kernel document provides another possibility.
Will share how to experiment with the KGDB in a virtual machine. And, use GDB + OpenOCD + JTAG + Raspberry Pi in the real environment as the demo in this talk.
開發 user space 軟體時,工程師們有方便的 debug 工具進行查找、分析、除錯。但在 Linux kernel 的開發,除了 printk 外,還可以有哪些工具可以使用呢?從 Linux kernel document 可以看到 KGDB 相關的資訊,提供了在 kernel 除錯時的另一個可能性。
本次將分享,從建立最簡單環境的虛擬機機開始,到實際使用 GDB + OpenOCD + JTAG + Raspberry Pi 當作展示範例。
This document explains how to use docker container in Ubuntu 14.04 VM for trying out cgroups without actually using the host/guest operating system. It talks about using 'cpu' subcomponent and demostrates the effect of process isolation by 'htop' utility.
The docker containers are very effective way of trying out things by launching a container using standard/custom docker image from docker hub or your own image repository.
Kernel Recipes 2015: Linux Kernel IO subsystem - How it works and how can I s...Anne Nicolas
Understanding how Linux kernel IO subsystem works is a key to analysis of a wide variety of issues occurring when running a Linux system. This talk is aimed at helping Linux users understand what is going on and how to get more insight into what is happening.
First we present an overview of Linux kernel block layer including different IO schedulers. We also talk about a new block multiqueue implementation that gets used for more and more devices.
After surveying the basic architecture we will be prepared to talk about tools to peek into it. We start with lightweight monitoring like iostat and continue with more heavy blktrace and variety of tools that are based on it. We demonstrate use of the tools on analysis of real world issues.
Jan Kara, SUSE
HKG18-411 - Introduction to OpenAMP which is an open source solution for hete...Linaro
Session ID: HKG18-411
Session Name: HKG18-411 - Introduction to OpenAMP which is an open source solution for heterogeneous system orchestration and communication
Speaker: Wendy Liang
Track: IoT, Embedded
★ Session Summary ★
Introduction to OpenAMP which is an open source solution for heterogeneous system orchestration and communication
---------------------------------------------------
★ Resources ★
Event Page: http://connect.linaro.org/resource/hkg18/hkg18-411/
Presentation: http://connect.linaro.org.s3.amazonaws.com/hkg18/presentations/hkg18-411.pdf
Video: http://connect.linaro.org.s3.amazonaws.com/hkg18/videos/hkg18-411.mp4
---------------------------------------------------
★ Event Details ★
Linaro Connect Hong Kong 2018 (HKG18)
19-23 March 2018
Regal Airport Hotel Hong Kong
---------------------------------------------------
Keyword: IoT, Embedded
'http://www.linaro.org'
'http://connect.linaro.org'
---------------------------------------------------
Follow us on Social Media
https://www.facebook.com/LinaroOrg
https://www.youtube.com/user/linaroorg?sub_confirmation=1
https://www.linkedin.com/company/1026961
Video: https://www.youtube.com/watch?v=FJW8nGV4jxY and https://www.youtube.com/watch?v=zrr2nUln9Kk . Tutorial slides for O'Reilly Velocity SC 2015, by Brendan Gregg.
There are many performance tools nowadays for Linux, but how do they all fit together, and when do we use them? This tutorial explains methodologies for using these tools, and provides a tour of four tool types: observability, benchmarking, tuning, and static tuning. Many tools will be discussed, including top, iostat, tcpdump, sar, perf_events, ftrace, SystemTap, sysdig, and others, as well observability frameworks in the Linux kernel: PMCs, tracepoints, kprobes, and uprobes.
This tutorial is updated and extended on an earlier talk that summarizes the Linux performance tool landscape. The value of this tutorial is not just learning that these tools exist and what they do, but hearing when and how they are used by a performance engineer to solve real world problems — important context that is typically not included in the standard documentation.
Talk for Facebook Systems@Scale 2021 by Brendan Gregg: "BPF (eBPF) tracing is the superpower that can analyze everything, helping you find performance wins, troubleshoot software, and more. But with many different front-ends and languages, and years of evolution, finding the right starting point can be hard. This talk will make it easy, showing how to install and run selected BPF tools in the bcc and bpftrace open source projects for some quick wins. Think like a sysadmin, not like a programmer."
Troubleshooting common oslo.messaging and RabbitMQ issuesMichael Klishin
This talk focuses on troubleshooting of common oslo.messaging and RabbitMQ issues in OpenStack environments. Co-presented at the OpenStack Summit Austin in April 2016.
Some basic knowledges required for beginners in writing linux kernel module - with a description of linux source tree, so that the idea of where and how develops. The working of insmod and rmmod commands are described also.
Note: When you view the the slide deck via web browser, the screenshots may be blurred. You can download and view them offline (Screenshots are clear).
DockerCon 2017 - Cilium - Network and Application Security with BPF and XDPThomas Graf
This talk will start with a deep dive and hands on examples of BPF, possibly the most promising low level technology to address challenges in application and network security, tracing, and visibility. We will discuss how BPF evolved from a simple bytecode language to filter raw sockets for tcpdump to the a JITable virtual machine capable of universally extending and instrumenting both the Linux kernel and user space applications. The introduction is followed by a concrete example of how the Cilium open source project applies BPF to solve networking, security, and load balancing for highly distributed applications. We will discuss and demonstrate how Cilium with the help of BPF can be combined with distributed system orchestration such as Docker to simplify security, operations, and troubleshooting of distributed applications.
USENIX LISA2021 talk by Brendan Gregg (https://www.youtube.com/watch?v=_5Z2AU7QTH4). This talk is a deep dive that describes how BPF (eBPF) works internally on Linux, and dissects some modern performance observability tools. Details covered include the kernel BPF implementation: the verifier, JIT compilation, and the BPF execution environment; the BPF instruction set; different event sources; and how BPF is used by user space, using bpftrace programs as an example. This includes showing how bpftrace is compiled to LLVM IR and then BPF bytecode, and how per-event data and aggregated map data are fetched from the kernel.
A brief overview of linux scheduler, context switch , priorities and scheduling classes as well as new features. Also provides an overview of preemption models in linux and how to use each model. all the examples are taken from http://www.discoversdk.com
Talk for AWS re:Invent 2014. Video: https://www.youtube.com/watch?v=7Cyd22kOqWc . Netflix tunes Amazon EC2 instances for maximum performance. In this session, you learn how Netflix configures the fastest possible EC2 instances, while reducing latency outliers. This session explores the various Xen modes (e.g., HVM, PV, etc.) and how they are optimized for different workloads. Hear how Netflix chooses Linux kernel versions based on desired performance characteristics and receive a firsthand look at how they set kernel tunables, including hugepages. You also hear about Netflix’s use of SR-IOV to enable enhanced networking and their approach to observability, which can exonerate EC2 issues and direct attention back to application performance.
Kernel Recipes 2015 - Kernel dump analysisAnne Nicolas
Kernel dump analysis
Cloud this, cloud that…It’s making everything easier, especially for web hosted services. But what about the servers that are not supposed to crash ? For applications making the assumption the OS won’t do any fault or go down, what can you write in your post-mortem once the server froze and has been restarted ? How to track down the bug that lead to service unavailability ?
In this talk, we’ll see how to setup kdump and how to panic a server to generate a coredump. Once you have the vmcore file, how to track the issue with “crash” tool to find why your OS went down. Last but not least : with “crash” you can also modify your live kernel, the same way you would do with gdb.
Adrien Mahieux – System administrator obsessed with performance and uptime, tracking down microseconds from hardware to software since 2011. The application must be seen as a whole to provide efficiently the requested service. This includes searching for bottlenecks and tradeoffs, design issues or hardware optimization.
Delve Labs was present during the GoSec 2016 conference, where our lead DevOps engineer presented an overview of the current options available for securing Docker in production environments.
https://www.delve-labs.com
HKG15-409: ARM Hibernation enablement on SoCs - a case studyLinaro
HKG15-409: ARM Hibernation enablement on SoCs - a case study
---------------------------------------------------
Speaker: Grygorii Strashko
Date: February 12, 2015
---------------------------------------------------
★ Session Summary ★
Hibernation on ARM devices is a long-wanted feature, with multiple ways of achieving it - in-kernel, fully userspace, or a combination. This presentation will give brief overview of these methods, and will discuss the effort required in enabling in-kernel ARM hibernation to the TI platform. We will also share the pre-requisites for enabling this on other SoCs.
--------------------------------------------------
★ Resources ★
Pathable: https://hkg15.pathable.com/meetings/250837
Video: https://www.youtube.com/watch?v=dJqCbTfKrMk
Etherpad: http://pad.linaro.org/p/hkg15-409
---------------------------------------------------
★ Event Details ★
Linaro Connect Hong Kong 2015 - #HKG15
February 9-13th, 2015
Regal Airport Hotel Hong Kong Airport
---------------------------------------------------
http://www.linaro.org
http://connect.linaro.org
Advanced cgroups and namespaces
This talk picks up where we left off in the previous cgroups and namespaces talk and dive in even deeper!
Agenda:
* cgroups v2 design (cgroup v2 was started to be merged in the current kernel, 4.4)
* cgroups v2 examples (migrating tasks, enabling and disabling controllers, and more).
* comparison between cgroup v2 unified hierarchy and cgroup v1 legacy hierarchy.
* PIDs namespaces (from kernel 4.3)
* cgroup namespaces (not merged yet)
HKG18-TR14 - Postmortem Debugging with CoresightLinaro
Session ID: HKG18-TR14
Session Name: HKG18-TR14 - Postmortem Debugging with Coresight
Speaker: Leo Yan
Track: Training
★ Session Summary ★
For most cases we can easily debug with kernel's oops dumping info, but sometimes we need to know more information for program execution flow before the issue happens. So we can rely on two tracing methods to reproduce the program execution flow, one method is using software tracing which is kernel's pstore method; another method is to rely on Coresight hardware tracing, this method also can avoid extra workload introduced by tracing itself. Coresight has provided two mechanisms for Postmortem debugging, one method is Coresight CPU debug module so we can extract CPU program counter info, this is quite straightforward to debug CPU lockup issue; Another is Coresight panic kdump, we connect kernel kdump mechanism to extract Coresight tracing data so we can reproduce the last execution flow before panic (even hang issue with some tweaking in kernel). This session wants to go through these topics and demonstrate the debugging tools on 96boards Hikey in 25 minutes session.
---------------------------------------------------
★ Resources ★
Event Page: http://connect.linaro.org/resource/hkg18/hkg18-tr14/
Presentation: http://connect.linaro.org.s3.amazonaws.com/hkg18/presentations/hkg18-tr14.pdf
Video: http://connect.linaro.org.s3.amazonaws.com/hkg18/videos/hkg18-tr14.mp4
---------------------------------------------------
★ Event Details ★
Linaro Connect Hong Kong 2018 (HKG18)
19-23 March 2018
Regal Airport Hotel Hong Kong
---------------------------------------------------
Keyword: Training
'http://www.linaro.org'
'http://connect.linaro.org'
---------------------------------------------------
Follow us on Social Media
https://www.facebook.com/LinaroOrg
https://www.youtube.com/user/linaroorg?sub_confirmation=1
https://www.linkedin.com/company/1026961
Talk for YOW! by Brendan Gregg. "Systems performance studies the performance of computing systems, including all physical components and the full software stack to help you find performance wins for your application and kernel. However, most of us are not performance or kernel engineers, and have limited time to study this topic. This talk summarizes the topic for everyone, touring six important areas: observability tools, methodologies, benchmarking, profiling, tracing, and tuning. Included are recipes for Linux performance analysis and tuning (using vmstat, mpstat, iostat, etc), overviews of complex areas including profiling (perf_events) and tracing (ftrace, bcc/BPF, and bpftrace/BPF), advice about what is and isn't important to learn, and case studies to see how it is applied. This talk is aimed at everyone: developers, operations, sysadmins, etc, and in any environment running Linux, bare metal or the cloud.
"
Bringing up Android on your favorite X86 Workstation or VM (AnDevCon Boston, ...Ron Munitz
My session at AnDevCon Bostong, May 2013, Boston, MA.
This class introduces the concepts of AOSP and how to use it in order to configure and build one of the most popular Android devices available: The Android emulator, for an x86 target. You will then learn a reincarnation of the AOSP, intended to bring Android to as many x86 devices as possible. You will see its structure and compare it with the AOSP, and demonstrate how such a build works within Virtual Box, QEMU and more.
LEVEL: Intermediate
TOPIC AREA: Embedded Android
For Training/Consulting requests: info@thepscg.com
UiPath Test Automation using UiPath Test Suite series, part 3DianaGray10
Welcome to UiPath Test Automation using UiPath Test Suite series part 3. In this session, we will cover desktop automation along with UI automation.
Topics covered:
UI automation Introduction,
UI automation Sample
Desktop automation flow
Pradeep Chinnala, Senior Consultant Automation Developer @WonderBotz and UiPath MVP
Deepak Rai, Automation Practice Lead, Boundaryless Group and UiPath MVP
Key Trends Shaping the Future of Infrastructure.pdfCheryl Hung
Keynote at DIGIT West Expo, Glasgow on 29 May 2024.
Cheryl Hung, ochery.com
Sr Director, Infrastructure Ecosystem, Arm.
The key trends across hardware, cloud and open-source; exploring how these areas are likely to mature and develop over the short and long-term, and then considering how organisations can position themselves to adapt and thrive.
LF Energy Webinar: Electrical Grid Modelling and Simulation Through PowSyBl -...DanBrown980551
Do you want to learn how to model and simulate an electrical network from scratch in under an hour?
Then welcome to this PowSyBl workshop, hosted by Rte, the French Transmission System Operator (TSO)!
During the webinar, you will discover the PowSyBl ecosystem as well as handle and study an electrical network through an interactive Python notebook.
PowSyBl is an open source project hosted by LF Energy, which offers a comprehensive set of features for electrical grid modelling and simulation. Among other advanced features, PowSyBl provides:
- A fully editable and extendable library for grid component modelling;
- Visualization tools to display your network;
- Grid simulation tools, such as power flows, security analyses (with or without remedial actions) and sensitivity analyses;
The framework is mostly written in Java, with a Python binding so that Python developers can access PowSyBl functionalities as well.
What you will learn during the webinar:
- For beginners: discover PowSyBl's functionalities through a quick general presentation and the notebook, without needing any expert coding skills;
- For advanced developers: master the skills to efficiently apply PowSyBl functionalities to your real-world scenarios.
GraphRAG is All You need? LLM & Knowledge GraphGuy Korland
Guy Korland, CEO and Co-founder of FalkorDB, will review two articles on the integration of language models with knowledge graphs.
1. Unifying Large Language Models and Knowledge Graphs: A Roadmap.
https://arxiv.org/abs/2306.08302
2. Microsoft Research's GraphRAG paper and a review paper on various uses of knowledge graphs:
https://www.microsoft.com/en-us/research/blog/graphrag-unlocking-llm-discovery-on-narrative-private-data/
Builder.ai Founder Sachin Dev Duggal's Strategic Approach to Create an Innova...Ramesh Iyer
In today's fast-changing business world, Companies that adapt and embrace new ideas often need help to keep up with the competition. However, fostering a culture of innovation takes much work. It takes vision, leadership and willingness to take risks in the right proportion. Sachin Dev Duggal, co-founder of Builder.ai, has perfected the art of this balance, creating a company culture where creativity and growth are nurtured at each stage.
Neuro-symbolic is not enough, we need neuro-*semantic*Frank van Harmelen
Neuro-symbolic (NeSy) AI is on the rise. However, simply machine learning on just any symbolic structure is not sufficient to really harvest the gains of NeSy. These will only be gained when the symbolic structures have an actual semantics. I give an operational definition of semantics as “predictable inference”.
All of this illustrated with link prediction over knowledge graphs, but the argument is general.
JMeter webinar - integration with InfluxDB and GrafanaRTTS
Watch this recorded webinar about real-time monitoring of application performance. See how to integrate Apache JMeter, the open-source leader in performance testing, with InfluxDB, the open-source time-series database, and Grafana, the open-source analytics and visualization application.
In this webinar, we will review the benefits of leveraging InfluxDB and Grafana when executing load tests and demonstrate how these tools are used to visualize performance metrics.
Length: 30 minutes
Session Overview
-------------------------------------------
During this webinar, we will cover the following topics while demonstrating the integrations of JMeter, InfluxDB and Grafana:
- What out-of-the-box solutions are available for real-time monitoring JMeter tests?
- What are the benefits of integrating InfluxDB and Grafana into the load testing stack?
- Which features are provided by Grafana?
- Demonstration of InfluxDB and Grafana using a practice web application
To view the webinar recording, go to:
https://www.rttsweb.com/jmeter-integration-webinar
Software Delivery At the Speed of AI: Inflectra Invests In AI-Powered QualityInflectra
In this insightful webinar, Inflectra explores how artificial intelligence (AI) is transforming software development and testing. Discover how AI-powered tools are revolutionizing every stage of the software development lifecycle (SDLC), from design and prototyping to testing, deployment, and monitoring.
Learn about:
• The Future of Testing: How AI is shifting testing towards verification, analysis, and higher-level skills, while reducing repetitive tasks.
• Test Automation: How AI-powered test case generation, optimization, and self-healing tests are making testing more efficient and effective.
• Visual Testing: Explore the emerging capabilities of AI in visual testing and how it's set to revolutionize UI verification.
• Inflectra's AI Solutions: See demonstrations of Inflectra's cutting-edge AI tools like the ChatGPT plugin and Azure Open AI platform, designed to streamline your testing process.
Whether you're a developer, tester, or QA professional, this webinar will give you valuable insights into how AI is shaping the future of software delivery.
Connector Corner: Automate dynamic content and events by pushing a buttonDianaGray10
Here is something new! In our next Connector Corner webinar, we will demonstrate how you can use a single workflow to:
Create a campaign using Mailchimp with merge tags/fields
Send an interactive Slack channel message (using buttons)
Have the message received by managers and peers along with a test email for review
But there’s more:
In a second workflow supporting the same use case, you’ll see:
Your campaign sent to target colleagues for approval
If the “Approve” button is clicked, a Jira/Zendesk ticket is created for the marketing design team
But—if the “Reject” button is pushed, colleagues will be alerted via Slack message
Join us to learn more about this new, human-in-the-loop capability, brought to you by Integration Service connectors.
And...
Speakers:
Akshay Agnihotri, Product Manager
Charlie Greenberg, Host
State of ICS and IoT Cyber Threat Landscape Report 2024 previewPrayukth K V
The IoT and OT threat landscape report has been prepared by the Threat Research Team at Sectrio using data from Sectrio, cyber threat intelligence farming facilities spread across over 85 cities around the world. In addition, Sectrio also runs AI-based advanced threat and payload engagement facilities that serve as sinks to attract and engage sophisticated threat actors, and newer malware including new variants and latent threats that are at an earlier stage of development.
The latest edition of the OT/ICS and IoT security Threat Landscape Report 2024 also covers:
State of global ICS asset and network exposure
Sectoral targets and attacks as well as the cost of ransom
Global APT activity, AI usage, actor and tactic profiles, and implications
Rise in volumes of AI-powered cyberattacks
Major cyber events in 2024
Malware and malicious payload trends
Cyberattack types and targets
Vulnerability exploit attempts on CVEs
Attacks on counties – USA
Expansion of bot farms – how, where, and why
In-depth analysis of the cyber threat landscape across North America, South America, Europe, APAC, and the Middle East
Why are attacks on smart factories rising?
Cyber risk predictions
Axis of attacks – Europe
Systemic attacks in the Middle East
Download the full report from here:
https://sectrio.com/resources/ot-threat-landscape-reports/sectrio-releases-ot-ics-and-iot-security-threat-landscape-report-2024/
PHP Frameworks: I want to break free (IPC Berlin 2024)Ralf Eggert
In this presentation, we examine the challenges and limitations of relying too heavily on PHP frameworks in web development. We discuss the history of PHP and its frameworks to understand how this dependence has evolved. The focus will be on providing concrete tips and strategies to reduce reliance on these frameworks, based on real-world examples and practical considerations. The goal is to equip developers with the skills and knowledge to create more flexible and future-proof web applications. We'll explore the importance of maintaining autonomy in a rapidly changing tech landscape and how to make informed decisions in PHP development.
This talk is aimed at encouraging a more independent approach to using PHP frameworks, moving towards a more flexible and future-proof approach to PHP development.
GDG Cloud Southlake #33: Boule & Rebala: Effective AppSec in SDLC using Deplo...James Anderson
Effective Application Security in Software Delivery lifecycle using Deployment Firewall and DBOM
The modern software delivery process (or the CI/CD process) includes many tools, distributed teams, open-source code, and cloud platforms. Constant focus on speed to release software to market, along with the traditional slow and manual security checks has caused gaps in continuous security as an important piece in the software supply chain. Today organizations feel more susceptible to external and internal cyber threats due to the vast attack surface in their applications supply chain and the lack of end-to-end governance and risk management.
The software team must secure its software delivery process to avoid vulnerability and security breaches. This needs to be achieved with existing tool chains and without extensive rework of the delivery processes. This talk will present strategies and techniques for providing visibility into the true risk of the existing vulnerabilities, preventing the introduction of security issues in the software, resolving vulnerabilities in production environments quickly, and capturing the deployment bill of materials (DBOM).
Speakers:
Bob Boule
Robert Boule is a technology enthusiast with PASSION for technology and making things work along with a knack for helping others understand how things work. He comes with around 20 years of solution engineering experience in application security, software continuous delivery, and SaaS platforms. He is known for his dynamic presentations in CI/CD and application security integrated in software delivery lifecycle.
Gopinath Rebala
Gopinath Rebala is the CTO of OpsMx, where he has overall responsibility for the machine learning and data processing architectures for Secure Software Delivery. Gopi also has a strong connection with our customers, leading design and architecture for strategic implementations. Gopi is a frequent speaker and well-known leader in continuous delivery and integrating security into software delivery.
Kubernetes & AI - Beauty and the Beast !?! @KCD Istanbul 2024Tobias Schneck
As AI technology is pushing into IT I was wondering myself, as an “infrastructure container kubernetes guy”, how get this fancy AI technology get managed from an infrastructure operational view? Is it possible to apply our lovely cloud native principals as well? What benefit’s both technologies could bring to each other?
Let me take this questions and provide you a short journey through existing deployment models and use cases for AI software. On practical examples, we discuss what cloud/on-premise strategy we may need for applying it to our own infrastructure to get it to work from an enterprise perspective. I want to give an overview about infrastructure requirements and technologies, what could be beneficial or limiting your AI use cases in an enterprise environment. An interactive Demo will give you some insides, what approaches I got already working for real.
2. Cgroups In Android
Android uses mainly to achieve the following
➢ Monitor System memory
The Low Memory Killer Daemon (lmkd) uses cgroups to monitor the system memory.
➢ Process Grouping For Effective CPU Sharing
To group processes into various groups so that the UI or the foreground tasks get the priority.
3. Memory cgroups
Create cgroup mount point for memory
➢ mount tmpfs none /sys/fs/cgroup mode=0750,uid=0,gid=1000
➢ mkdir /sys/fs/cgroup/memory 0750 root system
➢ mount cgroup none /sys/fs/cgroup/memory memory
➢ chown root system /sys/fs/cgroup/memory/tasks
➢ chmod 0660 /sys/fs/cgroup/memory/tasks
➢ mkdir /sys/fs/cgroup/memory/sw 0750 root system
➢ chown root system /sys/fs/cgroup/memory/sw/tasks
➢ chmod 0660 /sys/fs/cgroup/memory/sw/tasks
➢ mkdir /dev/memcg 0700 root system
➢ mount cgroup none /dev/memcg memory
4. Low Memory Killer
init_mp function in System/core/lmkd/lmkd.c
Use the memory control group to receive memory pressure events.
evfd = eventfd(0, EFD_NONBLOCK);
mpfd = open(MEMCG_SYSFS_PATH "memory.pressure_level", O_RDONLY);
evctlfd = open(MEMCG_SYSFS_PATH "cgroup.event_control", O_WRONLY);
Monitor for the medium presuure level and let the eventfd be notifed when the pressure level
reaches the medium level.
ret = snprintf(buf, sizeof(buf), "%d %d %s", evfd, mpfd,“medium“);
ret = write(evctlfd, buf, strlen(buf) + 1);
mp_event function in system/core/lmkd/lmkd.c handles the memory pressure event.
This function identifies a process to kill and kills it.
5. Cgroups and init.rc
Create cgroup mount points for process groups
➢ mkdir /dev/cpuctl
➢ mount cgroup none /dev/cpuctl cpu
➢ write /dev/cpuctl/cpu.shares 1024
Real time tasks in the cpuctl group run for 0.8 sec in a period of 1 second
➢ write /dev/cpuctl/cpu.rt_runtime_us 800000
➢ write /dev/cpuctl/cpu.rt_period_us 1000000
Create the cgroup for background tasks
➢ mkdir /dev/cpuctl/bg_non_interactive
Tasks in the bg_non_interactive group get nearly 5% of the CPU (52/1024)
➢ write /dev/cpuctl/bg_non_interactive/cpu.shares 52
Real time tasks in the bg_non_interactive group run for 0.7 sec in a period of 1 second.
➢ write /dev/cpuctl/bg_non_interactive/cpu.rt_runtime_us 700000
➢ write /dev/cpuctl/bg_non_interactive/cpu.rt_period_us 1000000
6. Cgroups And Android Scheduling
Android groups processes into the following groups based on their scheduling policy set:
➢ SP_BACKGROUND
➢ SP_FOREGROUND
➢ SP_SYSTEM
➢ SP_AUDIO_APP
➢ SP_AUDIO_SYS