Central spread symmetry 2.0
•Download as PPTX, PDF•
2 likes•192 views

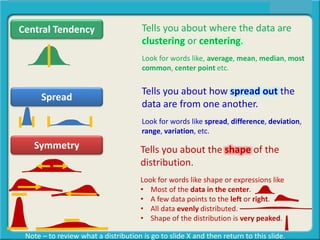
The document discusses the three main aspects used to describe data distributions: central tendency, spread, and symmetry. It defines each one as follows: - Central tendency tells you where the data are clustering or centering, and looks for words like average, mean, median, most common, or center point. - Spread tells you how spread out the data are from one another, and looks for words like spread, difference, deviation, range, or variation. - Symmetry tells you the shape of the distribution, and looks for words describing the shape or whether most data are in the center, off to one side, or evenly distributed.

More Related Content
What's hot
What's hot (18)
Similar to Central spread symmetry 2.0
Similar to Central spread symmetry 2.0 (20)
More from Ken Plummer
More from Ken Plummer (20)
Recently uploaded
Recently uploaded (20)
Central spread symmetry 2.0
- 1. Central Tendency Spread Symmetry Central Tendency, Spread, or Distribution Shape? Tells you about where the data are clustering or centering. Look for words like, average, mean, median, most common, center point etc. Tells you about how spread out the data are from one another. Look for words like spread, difference, deviation, range, variation, etc. Tells you about the shape of the distribution. Look for words like shape or expressions like • Most of the data in the center. • A few data points to the left or right. • All data evenly distributed. • Shape of the distribution is very peaked. Note – to review what a distribution is go to slide X and then return to this slide.
- 3. Problem #1 Question: What is the average number of cyberbullying incidents among freshmen, sophomores, juniors, and seniors?
- 4. Problem #1 Question: What is the average number of cyberbullying incidents among freshmen, sophomores, juniors, and seniors? Instructions: Which type of description of the distribution (below) is most relevant to the question (above)? Central Tendency Spread Symmetry
- 5. Problem #1 Question: What is the average number of cyberbullying incidents among freshmen, sophomores, juniors, and seniors? Central Tendency Spread Symmetry
- 6. Problem #1 Question: What is the average number of cyberbullying incidents among freshmen, sophomores, juniors, and seniors? Central Tendency Spread Symmetry Tells you about where the data are clustering or centering. Look for words like, average, mean, median, most common, center point etc.
- 7. Problem #1 Question: What is the average number of cyberbullying incidents among freshmen, sophomores, juniors, and seniors? Central Tendency Spread Symmetry Tells you about where the data are clustering or centering. Look for words like, average, mean, median, most common, center point etc.
- 8. Problem #2 Question: What is the difference between the lowest and highest score on a survey designed to test the impact of a new therapy?
- 9. Problem #2 Question: What is the difference between the lowest and highest score on a survey designed to test the impact of a new therapy? Instructions: Which type of description of the distribution (below) is most relevant to the question (above)? Central Tendency Spread Symmetry
- 10. Problem #2 Question: What is the difference between the lowest and highest score on a survey designed to test the impact of a new therapy? Central Tendency Spread Symmetry
- 11. Problem #2 Question: What is the difference between the lowest and highest score on a survey designed to test the impact of a new therapy? Central Tendency Spread Symmetry Tells you about how spread out the data are from one another. Look for words like spread, difference, deviation, range, variation, etc.
- 12. Problem #2 Question: What is the difference between the lowest and highest score on a survey designed to test the impact of a new therapy? Central Tendency Spread Symmetry Tells you about how spread out the data are from one another. Look for words like spread, difference, deviation, range, variation, etc.
- 13. Problem #3 Question: The director of a health clinic has asked you to help her analyze data from the results of patient systolic blood pressure readings. You decide to compute the mean systolic pressure to see where the patient results cluster.
- 14. Problem #3 Question: The director of a health clinic has asked you to help her analyze data from the results of patient systolic blood pressure readings. You decide to compute the mean systolic pressure to see where the patient results cluster. Instructions: Which type of description of the distribution (below) is most relevant to the question (above)? Central Tendency Spread Symmetry
- 15. Problem #3 Question: The director of a health clinic has asked you to help her analyze data from the results of patient systolic blood pressure readings. You decide to compute the mean systolic pressure to see where the patient results cluster. Central Tendency Spread Symmetry
- 16. Problem #3 Question: The director of a health clinic has asked you to help her analyze data from the results of patient systolic blood pressure readings. You decide to compute the mean systolic pressure to see where the patient results cluster. Central Tendency Spread Symmetry Tells you about where the data are clustering or centering. Look for words like, average, mean, median, most common, center point etc.
- 17. Problem #3 Question: The director of a health clinic has asked you to help her analyze data from the results of patient systolic blood pressure readings. You decide to compute the mean systolic pressure to see where the patient results cluster. Central Tendency Spread Symmetry Tells you about where the data are clustering or centering. Look for words like, average, mean, median, most common, center point etc.
- 18. Problem #4 Question: An entrance exam for mechanical engineers is very difficult. If it is very difficult you would expect most of the scores to bunched up on the lower end of the score distribution with a few high scores. What is the shape of this distribution?
- 19. Problem #4 Question: An entrance exam for mechanical engineers is very difficult. If it is very difficult you would expect most of the scores to bunched up on the lower end of the score distribution with a few high scores. What is the shape of this distribution? Instructions: Which type of description of the distribution (below) is most relevant to the question (above)? Central Tendency Spread Symmetry
- 20. Problem #4 Question: An entrance exam for mechanical engineers is very difficult. If it is very difficult you would expect most of the scores to bunched up on the lower end of the score distribution with a few high scores. What is the shape of this distribution? Central Tendency Spread Symmetry
- 21. Problem #4 Question: An entrance exam for mechanical engineers is very difficult. If it is very difficult you would expect most of the scores to bunched up on the lower end of the score distribution with a few high scores. What is the shape of this distribution? Tells you about the shape of the distribution. Look for words like shape or expressions like • Most of the data in the center. • A few data points to the left or right. • All data evenly distributed. • Shape of the distribution is very peaked. Central Tendency Spread Symmetry
- 22. Problem #4 Question: An entrance exam for mechanical engineers is very difficult. If it is very difficult you would expect most of the scores to bunched up on the lower end of the score distribution with a few high scores. What is the shape of this distribution? Tells you about the shape of the distribution. Look for words like shape or expressions like • Most of the data in the center. • A few data points to the left or right. • All data evenly distributed. • Shape of the distribution is very peaked. Central Tendency Spread Symmetry
- 23. Problem #5 Question: You wish to find out the comfort level seasoned faculty have with emerging educational technologies. You survey 15 faculty who have taught more than 25 years. Two select “no comfort”, twelve select “minimal comfort” and two select moderate comfort.
- 24. Problem #5 Question: You wish to find out the comfort level seasoned faculty have with emerging educational technologies. You survey 15 faculty who have taught more than 25 years. Two select “no comfort”, twelve select “minimal comfort” and two select moderate comfort. Instructions: Which type of description of the distribution (below) is most relevant to the question (above)? Central Tendency Spread Symmetry
- 25. Problem #5 Question: You wish to find out the comfort level seasoned faculty have with emerging educational technologies. You survey 15 faculty who have taught more than 25 years. Two select “no comfort”, twelve select “minimal comfort” and two select moderate comfort. Central Tendency Spread Symmetry
- 26. Problem #5 Question: You wish to find out the comfort level seasoned faculty have with emerging educational technologies. You survey 15 faculty who have taught more than 25 years. Two select “no comfort”, twelve select “minimal comfort” and two select moderate comfort. Central Tendency Spread Symmetry Tells you about the shape of the distribution. Look for words like shape or expressions like • Most of the data in the center. • A few data points to the left or right. • All data evenly distributed. • Shape of the distribution is very peaked.
- 27. Problem #5 Question: You wish to find out the comfort level seasoned faculty have with emerging educational technologies. You survey 15 faculty who have taught more than 25 years. Two select “no comfort”, twelve select “minimal comfort” and two select moderate comfort. Central Tendency Spread Symmetry Tells you about the shape of the distribution. Look for words like shape or expressions like • Most of the data in the center. • A few data points to the left or right. • All data evenly distributed. • Shape of the distribution is very peaked.
- 28. What is a Distribution? If necessary explore this question
- 29. We will illustrate what a distribution is with a data set that describes the hours students’ study
- 30. Here is the data set:
- 31. Student Hours of Study Bart 1 Basheba 2 Bella 2 Bob 3 Boston 3 Bunter 3 Buxby 4 Bybee 4 Bwinda 5
- 32. Student Hours of Study Bart 1 Basheba 2 Bella 2 Bob 3 Boston 3 Bunter 3 Buxby 4 Bybee 4 Bwinda 5 Data
- 33. Student Hours of Study Bart 1 Basheba 2 Bella 2 Bob 3 Boston 3 Bunter 3 Buxby 4 Bybee 4 Bwinda 5 Data Set
- 34. Student Hours of Study Bart 1 Basheba 2 Bella 2 Bob 3 Boston 3 Bunter 3 Buxby 4 Bybee 4 Bwinda 5 From this data set we will create a distribution:
- 35. Student Hours of Study Bart 1 Basheba 2 Bella 2 Bob 3 Boston 3 Bunter 3 Buxby 4 Bybee 4 Bwinda 5
- 36. Student Hours of Study Bart 1 Basheba 2 Bella 2 Bob 3 Boston 3 Bunter 3 Buxby 4 Bybee 4 Bwinda 5 The X Axis, will be the number of hours of study
- 37. Student Hours of Study Bart 1 Basheba 2 Bella 2 Bob 3 Boston 3 Bunter 3 Buxby 4 Bybee 4 Bwinda 5 Hours of Study 1 2 3 4 5
- 38. Student Hours of Study Bart 1 Basheba 2 Bella 2 Bob 3 Boston 3 Bunter 3 Buxby 4 Bybee 4 Bwinda 5 Hours of Study 1 2 3 4 5
- 39. Student Hours of Study Bart 1 Basheba 2 Bella 2 Bob 3 Boston 3 Bunter 3 Buxby 4 Bybee 4 Bwinda 5 Hours of Study 1 2 3 4 5 The Y Axis, indicates the number of times the same number occurs
- 40. Student Hours of Study Bart 1 Basheba 2 Bella 2 Bob 3 Boston 3 Bunter 3 Buxby 4 Bybee 4 Bwinda 5 Hours of Study 1 2 3 4 5 The Y Axis, indicates the number of times the same number occurs
- 41. Student Hours of Study Bart 1 Basheba 2 Bella 2 Bob 3 Boston 3 Bunter 3 Buxby 4 Bybee 4 Bwinda 5 Hours of Study 1 2 3 4 5 The Y Axis, indicates the number of times the same number occurs
- 42. Student Hours of Study Bart 1 Basheba 2 Bella 2 Bob 3 Boston 3 Bunter 3 Buxby 4 Bybee 4 Bwinda 5 Hours of Study 1 2 3 4 5 The Y Axis, indicates the number of times the same number occurs
- 43. Student Hours of Study Bart 1 Basheba 2 Bella 2 Bob 3 Boston 3 Bunter 3 Buxby 4 Bybee 4 Bwinda 5 Hours of Study 1 2 3 4 5 The Y Axis, indicates the number of times the same number occurs
- 44. Student Hours of Study Bart 1 Basheba 2 Bella 2 Bob 3 Boston 3 Bunter 3 Buxby 4 Bybee 4 Bwinda 5 Hours of Study 1 2 3 4 5 The Y Axis, indicates the number of times the same number occurs
- 45. Student Hours of Study Bart 1 Basheba 2 Bella 2 Bob 3 Boston 3 Bunter 3 Buxby 4 Bybee 4 Bwinda 5 Hours of Study 1 2 3 4 5 Number of Occurrences
- 46. Student Hours of Study Bart 1 Basheba 2 Bella 2 Bob 3 Boston 3 Bunter 3 Buxby 4 Bybee 4 Bwinda 5 Hours of Study 1 2 3 4 5 NumberofOccurrences
- 47. Student Hours of Study Bart 1 Basheba 2 Bella 2 Bob 3 Boston 3 Bunter 3 Buxby 4 Bybee 4 Bwinda 5 Hours of Study 1 2 3 4 5 NumberofOccurrences
- 48. Student Hours of Study Bart 1 Basheba 2 Bella 2 Bob 3 Boston 3 Bunter 3 Buxby 4 Bybee 4 Bwinda 5 Hours of Study 1 2 3 4 5 NumberofOccurrences 1 2 3
- 49. Student Hours of Study Bart 1 Basheba 2 Bella 2 Bob 3 Boston 3 Bunter 3 Buxby 4 Bybee 4 Bwinda 5 Hours of Study 1 2 3 4 5 NumberofOccurrences 1 2 3
- 50. Student Hours of Study Bart 1 Basheba 2 Bella 2 Bob 3 Boston 3 Bunter 3 Buxby 4 Bybee 4 Bwinda 5 Hours of Study 1 2 3 4 5 NumberofOccurrences 1 2 3
- 51. Student Hours of Study Bart 1 Basheba 2 Bella 2 Bob 3 Boston 3 Bunter 3 Buxby 4 Bybee 4 Bwinda 5 Hours of Study 1 2 3 4 5 NumberofOccurrences 1 2 3
- 52. Student Hours of Study Bart 1 Basheba 2 Bella 2 Bob 3 Boston 3 Bunter 3 Buxby 4 Bybee 4 Bwinda 5 Hours of Study 1 2 3 4 5 NumberofOccurrences 1 2 3
- 53. Student Hours of Study Bart 1 Basheba 2 Bella 2 Bob 3 Boston 3 Bunter 3 Buxby 4 Bybee 4 Bwinda 5 Hours of Study 1 2 3 4 5 NumberofOccurrences 1 2 3
- 54. Student Hours of Study Bart 1 Basheba 2 Bella 2 Bob 3 Boston 3 Bunter 3 Buxby 4 Bybee 4 Bwinda 5 Hours of Study 1 2 3 4 5 NumberofOccurrences 1 2 3
- 55. Student Hours of Study Bart 1 Basheba 2 Bella 2 Bob 3 Boston 3 Bunter 3 Buxby 4 Bybee 4 Bwinda 5 Hours of Study 1 2 3 4 5 NumberofOccurrences 1 2 3
- 56. Student Hours of Study Bart 1 Basheba 2 Bella 2 Bob 3 Boston 3 Bunter 3 Buxby 4 Bybee 4 Bwinda 5 Hours of Study 1 2 3 4 5 NumberofOccurrences 1 2 3
- 57. Student Hours of Study Bart 1 Basheba 2 Bella 2 Bob 3 Boston 3 Bunter 3 Buxby 4 Bybee 4 Bwinda 5 Hours of Study 1 2 3 4 5 NumberofOccurrences 1 2 3
- 58. Student Hours of Study Bart 1 Basheba 2 Bella 2 Bob 3 Boston 3 Bunter 3 Buxby 4 Bybee 4 Bwinda 5 Hours of Study 1 2 3 4 5 NumberofOccurrences 1 2 3
- 59. Student Hours of Study Bart 1 Basheba 2 Bella 2 Bob 3 Boston 3 Bunter 3 Buxby 4 Bybee 4 Bwinda 5 Hours of Study 1 2 3 4 5 NumberofOccurrences 1 2 3
- 60. Student Hours of Study Bart 1 Basheba 2 Bella 2 Bob 3 Boston 3 Bunter 3 Buxby 4 Bybee 4 Bwinda 5 Hours of Study 1 2 3 4 5 NumberofOccurrences 1 2 3
- 61. Student Hours of Study Bart 1 Basheba 2 Bella 2 Bob 3 Boston 3 Bunter 3 Buxby 4 Bybee 4 Bwinda 5 Hours of Study 1 2 3 4 5 NumberofOccurrences 1 2 3 This is a distribution
- 62. One way to represent a distribution like this:
- 63. One way to represent a distribution like this:
- 64. One way to represent a distribution like this: Is like this:
- 65. One way to represent a distribution like this: Is like this:
- 66. One way to represent a distribution like this: Is like this: Normal distributions have the majority of the data in the middle
- 67. One way to represent a distribution like this: Is like this: Normal distributions have the majority of the data in the middle
- 68. One way to represent a distribution like this: Is like this: With decreasing but equal amounts toward the tails
- 69. One way to represent a distribution like this: Is like this: With decreasing but equal amounts toward the tails With decreasing but equal amounts toward the tails
- 70. Distributions can take other forms as well:
- 71. Distributions can take other forms as well: Hours of Study 1 2 3 4 #ofOccurrences 7
- 72. Distributions can take other forms as well:
- 73. Distributions can take other forms as well:
- 74. Distributions can take other forms as well:
- 75. Distributions can take other forms as well: Skewed RIGHT
- 76. Distributions can take other forms as well: Hours of Study 5 6 72 #ofOccurrences 1
- 77. Distributions can take other forms as well: Skewed to the LEFT
- 78. Distributions can take other forms as well:
- 79. Distributions can take other forms as well:
- 80. Distributions can take other forms as well: Or NON-NORMAL
- 81. Distributions can take other forms as well:
- 82. Distributions can take other forms as well:
- 83. Return to Slide 1
Editor's Notes
- Symmetry has to do with he shape of a distribution When the distribution is symmetrical it has most of the values in the middle with equally decreasing values to the left and right of the distribution (as shown to the left). A distribution is asymmetrical when it does not follow this pattern (see the bottom two images to the left). You normally will not be asked to assess skew directly but it is an important step in determining the type of spread or central tendency statistics you will run.