This document discusses using census and spatial data in SQL Server 2008 for hazard mitigation and analysis. It describes how the North Central Texas Council of Governments uses SQL Server 2008 to rapidly access and analyze data on storms, flood plains, earthquakes and more to support emergency management. Spatial features like polygons can be queried, updated and analyzed directly in SQL Server 2008 without needing external GIS software. This allows for fast, automated access and reporting of dynamic spatial data to support emergency response and planning.
Feature Extraction Based Estimation of Rain Fall By Cross Correlating Cloud R...IOSR Journals
In this paper we present the feature extraction based estimation of rain fall by cross correlating
cloud RADAR Data. The idea is to select a square box of around 200x200 pixels around the point of interest and
take the cross correlation between the last picture and one that is 5 or 10 minutes older. We then determine the
wind direction and speed by finding the highest point in the correlation. Last step is to interpolate the data
acquired in a tagged format to the latest data in the up-wind direction to get a prediction for the near future.
The basic principle works, but it is hard to get a good estimate of the wind direction.
Analyzing Larger RasterData in a Jupyter Notebook with GeoPySpark on AWS - FO...Rob Emanuele
Slides from the 2017 FOSS4G Workshop "Analyzing Larger RasterData in a Jupyter Notebook with GeoPySpark on AWS"
See the repository at https://github.com/lossyrob/foss4g-2017-geopyspark-workshop
GeoMesa presentation from LocationTech Tour - DC - November, 14th 2013. Presented by Anthony Fox (@algoriffic) of CCRi.
GeoMesa is an open source project providing spatio-temporal indexing, querying, and visualizing capabilities to Accumulo. Learn more at http://geomesa.github.io/
Improving access to satellite imagery with Cloud computingRAHUL BHOJWANI
The aim of this presentation is to introduce cloud computing platforms that have now made it possible for us to have access to a wide variety of Satellite Imagery data along with the computing power required to run sophisticated Machine Learning models on that. Also, it briefly explains one available dataset and what problems are currently being tackled with that, to motivate the use of geospatial datasets in solving real-life problems.
PS:- It is our* class presentation given for a course taken under Prof Shashi Shekhar at the University of Minnesota.
* - Rahul Bhojwani(rahulbhojwani2003@gmail.com) and Kate Kuehl(katekuehl@gmail.com)
One of the important application in image processing is to be able to judge the different edges in an image and be able to distinguish various parts of it. Clearly, this is an application dependent task and results and analysis will vary as per the situation.
These slides show a general description on how to calculate the number of cells in a microscopic tissue. There are two version one being the over-stained tissue and the other being the better one. We see how the algorithm is able to calculate the number of cells.
Classifying Multi-Variate Time Series at Scale:
Characterizing and understanding the runtime behavior of large scale Big Data production systems is extremely important. Typical systems consist of hundreds to thousands of machines in a cluster with hundreds of terabytes of storage costing millions of dollars, solving problems that are business critical. By instrumenting each running process, and measuring their resource utilization including CPU, Memory, I/O, network etc., as time series it is possible to understand and characterize the workload on these massive clusters. Each time series is a series consisting of tens to tens of thousands of data points that must be ingested and then classified. At Pepperdata, our instrumentation of the clusters collects over three hundred metrics from each task every five seconds resulting in millions of data points per hour. At this scale the data are equivalent to the biggest IOT data sets in the world. Our objective is to classify the collection of time series into a set of classes that represent different work load types. Or phrased differently, our problem is essentially the problem of classifying multivariate time series.
In this talk, we propose a unique, off-the-shelf approach to classifying time series that achieves near best-in-class accuracy for univariate series and generalizes to multivariate time series. Our technique maps each time series to a Grammian Angular Difference Field (GADF), interprets that as an image, uses Google’s pre-trained CNN (trained on Inception v3) to map the GADF images into a 2048-dimensional vector space and then uses a small MLP with two hidden layers, with fifty nodes in each layer, and a softmax output to achieve the final classification. Our work is not domain specific – a fact proven by our achieving competitive accuracies with published results on the univariate UCR data set as well as the multivariate UCI data set.
Bio: Before joining Pepperdata, Ash was executive chairman for Marianas Labs, a deep learning startup sold in December 2015. Prior to that he was CEO for Graphite Systems, a big data storage startup that was sold to EMC DSSD in August 2015. Munshi also served as CTO of Yahoo, as a CEO of both public and private companies, and is on the board of several technology startups.
Using Deep Learning to Derive 3D Cities from Satellite ImageryAstraea, Inc.
Detection and reconstruction of 3D buildings in urban areas has been a hot topic of research due to its many applications, including 3D population density studies, emergency planning, and building value estimation. Standard approaches to extract building footprint and measure building height rely on either aerial or space borne point cloud data, which in many areas is unavailable. In contrast, high resolution satellite imagery has become more readily available in recent years, and could provide enough information to estimate a building’s height. Recent successes of deep learning on semantic segmentation have shown that convolutional neural networks can be effective tools at extracting 2D building footprints. Using a digital surface model derived using FOSS and LiDAR data as ground truth, this study goes a step further by employing state of the art deep learning architectures such as U-net to infer both building footprints and estimated building heights in one pass from a single satellite image. This application of open deep learning frameworks can bring the benefits of 3D cities to a larger portion of the world.
Vizualize 300 tb in less than 5_secondsYaniv Shalev
Finding the effectiveness of a Marketing campaign is complex. Working with Fortune 500 companies in their conversion of customers on their million dollar marketing campaigns is extremely complex. Data comes from a multitude of sources and algorithms must be built to understand their data and answer tough questions. Data must be accurate, algorithms must be novel and dashboards must provide correct insights. Dashboards give marketers the ability to make order, see what's important, make decisions and act. And they needs answers FAST. How fast?
We visualize 300TB of data in less than 5 seconds. Why, because if we can do this marketers win and if they can win we win.
This presentation was give in a talk which explained the techniques and lessons learned of how to create interactive deep analytics dashboards of very large data sets.
Hanjun Dai, PhD Student, School of Computational Science and Engineering, Geo...MLconf
Graph Representation Learning with Deep Embedding Approach:
Graphs are commonly used data structure for representing the real-world relationships, e.g., molecular structure, knowledge graphs, social and communication networks. The effective encoding of graphical information is essential to the success of such applications. In this talk I’ll first describe a general deep learning framework, namely structure2vec, for end to end graph feature representation learning. Then I’ll present the direct application of this model on graph problems on different scales, including community detection and molecule graph classification/regression. We then extend the embedding idea to temporal evolving user-product interaction graph for recommendation. Finally I’ll present our latest work on leveraging the reinforcement learning technique for graph combinatorial optimization, including vertex cover problem for social influence maximization and traveling salesman problem for scheduling management.
Tamara G. Kolda, Distinguished Member of Technical Staff, Sandia National Lab...MLconf
Tensor Decomposition: A Mathematical Tool for Data Analysis:
Tensors are multiway arrays, and tensor decompositions are powerful tools for data analysis. In this talk, we demonstrate the wide-ranging utility of the canonical polyadic (CP) tensor decomposition with examples in neuroscience and chemical detection. The CP model is extremely useful for interpretation, as we show with an example in neuroscience. However, it can be difficult to fit to real data for a variety of reasons. We present a novel randomized method for fitting the CP decomposition to dense data that is more scalable and robust than the standard techniques. We further consider the modeling assumptions for fitting tensor decompositions to data and explain alternative strategies for different statistical scenarios, resulting in a _generalized_ CP tensor decomposition.
Bio: Tamara G. Kolda is a member of the Data Science and Cyber Analytics Department at Sandia National Laboratories in Livermore, CA. Her research is generally in the area of computational science and data analysis, with specialties in multilinear algebra and tensor decompositions, graph models and algorithms, data mining, optimization, nonlinear solvers, parallel computing and the design of scientific software. She has received a Presidential Early Career Award for Scientists and Engineers (PECASE), been named a Distinguished Scientist of the Association for Computing Machinery (ACM) and a Fellow of the Society for Industrial and Applied Mathematics (SIAM). She was the winner of an R&D100 award and three best paper prizes at international conferences. She is currently a member of the SIAM Board of Trustees and serves as associate editor for both the SIAM J. Scientific Computing and the SIAM J. Matrix Analysis and Applications.
For IceCube, large amount of photon propagation simulation is needed to properly calibrate natural Ice. Simulation is compute intensive and ideal for GPU compute. This Cloud run was more data intensive than precious ones, producing 130 TB of output data. To keep egress costs in check, we created dedicated network links via the Internet2 Cloud Connect Service.
Using GIS to analyze historical data; digital humanities: spatial and temporal patterns . samples shown are related to part of the bibliography of the Jewish National Library.
High-Performance Analysis of Streaming GraphsJason Riedy
Graph-structured data in social networks, finance, network security, and others not only are massive but also under continual change. These changes often are scattered across the graph. Stopping the world to run a single, static query is infeasible. Repeating complex global analyses on massive snapshots to capture only what has changed is inefficient. We discuss requirements for single-shot queries on changing graphs as well as recent high-performance algorithms that update rather than recompute results. These algorithms are incorporated into our software framework for streaming graph analysis, STING (Spatio-Temporal Interaction Networks and Graphs).
WMS Benchmarking presentation and results, from the FOSS4G 2011 event in Denver. 6 different development teams participated in this exercise, to display common data through the WMS standard the fastest. http://2011.foss4g.org/sessions/web-mapping-performance-shootout
Lecture given at the Informatics Department of the Aristotle University of Thessaloniki on introductory topics of geographical data management for web applications.
Scan Segmentation Approach to Magnify Detection Sensitivity for Tiny Hardware...奈良先端大 情報科学研究科
Outsourcing of IC fabrication components has initiated the
potential threat of design tempering using hardware Trojans and also has drawn the attention of government agencies and the semiconductor industry. The added functionality, known as hardware Trojan, poses major detection and isolation challenges. This paper presents a hardware Trojan detection technique that magnifies the detection sensitivity for small Trojan in power-based side-channel analysis. A scan segmentation approach with a modified LOC test pattern application method is proposed so as to maximize dynamic power consumption of any target segment. The proposed architecture allows activating any target segment of scan chain and keeping others freeze which reduces total circuit switching activity. This helps magnify the Trojan’s contribution to selected segment by increasing dynamic power
consumption. Experimental results for ISCAS89 benchmark circuit demonstrate its effectiveness in side-channel analysis.
Feature Extraction Based Estimation of Rain Fall By Cross Correlating Cloud R...IOSR Journals
Abstract: In this paper we present the feature extraction based estimation of rain fall by cross correlating
cloud RADAR Data. The idea is to select a square box of around 200x200 pixels around the point of interest and
take the cross correlation between the last picture and one that is 5 or 10 minutes older. We then determine the
wind direction and speed by finding the highest point in the correlation. Last step is to interpolate the data
acquired in a tagged format to the latest data in the up-wind direction to get a prediction for the near future.
The basic principle works, but it is hard to get a good estimate of the wind direction.
Keywords – Feature Extraction, Cross correlation, Rain Fall, RADAR, Image Processing.
Challenge@RuleML2015 Modeling Object-Relational Geolocation Knowledge in PSOA...RuleML
In recent years, many geospatial data sets have become available
on the Web. These data can be incorporated into real-world applications
to answer advanced geospatial queries. In this paper, we present
a use case to integrate a local data set with external geospatial data
sets on the Web. The data sets are modeled in different paradigms –
relational and object-centered. The integration uses Positional-Slotted
Object-Applicative (PSOA) RuleML, which combines the relational and
object-centered modeling paradigms for databases as well as knowledge
bases (KBs).
Query optimizers and people have one thing in common: the better they understand their data, the better they can do their jobs. Optimizing queries is hard if you don't have good estimates for the sizes of the intermediate join and aggregate results. Data profiling is a technique that scans data, looking for patterns within the data such as keys, functional dependencies, and correlated columns. These richer statistics can be used in Apache Calcite's query optimizer, and the projects that use it, such as Apache Hive, Phoenix and Drill. We describe how we built a data profiler as a table function in Apache Calcite, review the recent research and algorithms that made it possible, and show how you can use the profiler to improve the quality of your data.
Query optimizers and people have one thing in common: the better they understand their data, the better they can do their jobs. Optimizing queries is hard if you don't have good estimates for the sizes of the intermediate join and aggregate results. Data profiling is a technique that scans data, looking for patterns within the data such as keys, functional dependencies, and correlated columns. These richer statistics can be used in Apache Calcite's query optimizer, and the projects that use it, such as Apache Hive, Phoenix and Drill. We describe how we built a data profiler as a table function in Apache Calcite, review the recent research and algorithms that made it possible, and show how you can use the profiler to improve the quality of your data.
A talk given by Julian Hyde at DataWorks Summit, San Jose, on June 14th 2017.
Stockage, manipulation et analyse de données matricielles avec PostGIS RasterACSG Section Montréal
La plus importantes nouveautés de la base de données spatiale open source PostgreSQL/PostGIS 2.0 est le support pour les données raster. PostGIS Raster comprend un outil d’importation similaire à shp2pgsql basé sur GDAL et une série d’opérateurs SQL pour la manipulation et l'analyse des données matricielles. Le nouveau type RASTER est géoréférencé, multi-résolutions et multi-bandes et il supporte une valeur nulle (nodata) et un type de valeur de pixel par bande. PostGIS raster s’inspire de la simplicité de l’expérience vecteur offerte par PostGIS pour rendre toutes les opérations raster aussi simples que possible. Comme pour une couverture vecteur, une couverture raster est divisée en un ensemble d’enregistrements (une ligne = une tuile) stockés dans une seule table (contrairement à Oracle Spatial qui utilise deux types et donc deux tables ou plus). Il est possible d’importer une couverture complète et de la retuiler en une seule commande avec l’outil d’importation et de multiples résolutions de la même couverture peuvent être importées dans des tables adjacentes. Les propriétés des objets raster et de chacune des bandes peuvent être consultées et modifiées ainsi que les valeurs des pixels. Des fonctions existent pour obtenir le minimum, le maximum, la somme, la moyenne, la déviation standard, l’histogramme d’une tuile ou d’une couverture complète. Les fonctions ST_Intersection() et ST_Intersects() fonctionnent pratiquement de manière transparente entre des données raster et vecteur et une série de fonctions pour l’algèbre matricielle (ST_MapAlgebra()) permet de faire de l’analyse de type raster. Il est possible de reclasser les bandes et de les convertir en n’importe quel format d’écriture GDAL. Des fonctions pour générer des rasters et des bandes existent également pour du développement PL/pgSQL. Un driver GDAL pour convertir les couvertures raster en fichiers images est en développement et des plugins pour QGIS et svSIG existent déjà pour les visualiser.
Query optimizers and people have one thing in common: the better they understand their data, the better they can do their jobs. Optimizing queries is hard if you don't have good estimates for the sizes of the intermediate join and aggregate results. Data profiling is a technique that scans data, looking for patterns within the data such as keys, functional dependencies, and correlated columns. These richer statistics can be used in Apache Calcite's query optimizer, and the projects that use it, such as Apache Hive, Phoenix and Drill. We describe how we built a data profiler as a table function in Apache Calcite, review the recent research and algorithms that made it possible, and show how you can use the profiler to improve the quality of your data.
A talk given by Julian Hyde at Apache: Big Data, Miami, on May 16th 2017.
GraphRAG is All You need? LLM & Knowledge GraphGuy Korland
Guy Korland, CEO and Co-founder of FalkorDB, will review two articles on the integration of language models with knowledge graphs.
1. Unifying Large Language Models and Knowledge Graphs: A Roadmap.
https://arxiv.org/abs/2306.08302
2. Microsoft Research's GraphRAG paper and a review paper on various uses of knowledge graphs:
https://www.microsoft.com/en-us/research/blog/graphrag-unlocking-llm-discovery-on-narrative-private-data/
Neuro-symbolic is not enough, we need neuro-*semantic*Frank van Harmelen
Neuro-symbolic (NeSy) AI is on the rise. However, simply machine learning on just any symbolic structure is not sufficient to really harvest the gains of NeSy. These will only be gained when the symbolic structures have an actual semantics. I give an operational definition of semantics as “predictable inference”.
All of this illustrated with link prediction over knowledge graphs, but the argument is general.
Encryption in Microsoft 365 - ExpertsLive Netherlands 2024Albert Hoitingh
In this session I delve into the encryption technology used in Microsoft 365 and Microsoft Purview. Including the concepts of Customer Key and Double Key Encryption.
Connector Corner: Automate dynamic content and events by pushing a buttonDianaGray10
Here is something new! In our next Connector Corner webinar, we will demonstrate how you can use a single workflow to:
Create a campaign using Mailchimp with merge tags/fields
Send an interactive Slack channel message (using buttons)
Have the message received by managers and peers along with a test email for review
But there’s more:
In a second workflow supporting the same use case, you’ll see:
Your campaign sent to target colleagues for approval
If the “Approve” button is clicked, a Jira/Zendesk ticket is created for the marketing design team
But—if the “Reject” button is pushed, colleagues will be alerted via Slack message
Join us to learn more about this new, human-in-the-loop capability, brought to you by Integration Service connectors.
And...
Speakers:
Akshay Agnihotri, Product Manager
Charlie Greenberg, Host
Accelerate your Kubernetes clusters with Varnish CachingThijs Feryn
A presentation about the usage and availability of Varnish on Kubernetes. This talk explores the capabilities of Varnish caching and shows how to use the Varnish Helm chart to deploy it to Kubernetes.
This presentation was delivered at K8SUG Singapore. See https://feryn.eu/presentations/accelerate-your-kubernetes-clusters-with-varnish-caching-k8sug-singapore-28-2024 for more details.
Elevating Tactical DDD Patterns Through Object CalisthenicsDorra BARTAGUIZ
After immersing yourself in the blue book and its red counterpart, attending DDD-focused conferences, and applying tactical patterns, you're left with a crucial question: How do I ensure my design is effective? Tactical patterns within Domain-Driven Design (DDD) serve as guiding principles for creating clear and manageable domain models. However, achieving success with these patterns requires additional guidance. Interestingly, we've observed that a set of constraints initially designed for training purposes remarkably aligns with effective pattern implementation, offering a more ‘mechanical’ approach. Let's explore together how Object Calisthenics can elevate the design of your tactical DDD patterns, offering concrete help for those venturing into DDD for the first time!
JMeter webinar - integration with InfluxDB and GrafanaRTTS
Watch this recorded webinar about real-time monitoring of application performance. See how to integrate Apache JMeter, the open-source leader in performance testing, with InfluxDB, the open-source time-series database, and Grafana, the open-source analytics and visualization application.
In this webinar, we will review the benefits of leveraging InfluxDB and Grafana when executing load tests and demonstrate how these tools are used to visualize performance metrics.
Length: 30 minutes
Session Overview
-------------------------------------------
During this webinar, we will cover the following topics while demonstrating the integrations of JMeter, InfluxDB and Grafana:
- What out-of-the-box solutions are available for real-time monitoring JMeter tests?
- What are the benefits of integrating InfluxDB and Grafana into the load testing stack?
- Which features are provided by Grafana?
- Demonstration of InfluxDB and Grafana using a practice web application
To view the webinar recording, go to:
https://www.rttsweb.com/jmeter-integration-webinar
The Art of the Pitch: WordPress Relationships and SalesLaura Byrne
Clients don’t know what they don’t know. What web solutions are right for them? How does WordPress come into the picture? How do you make sure you understand scope and timeline? What do you do if sometime changes?
All these questions and more will be explored as we talk about matching clients’ needs with what your agency offers without pulling teeth or pulling your hair out. Practical tips, and strategies for successful relationship building that leads to closing the deal.
Dev Dives: Train smarter, not harder – active learning and UiPath LLMs for do...UiPathCommunity
💥 Speed, accuracy, and scaling – discover the superpowers of GenAI in action with UiPath Document Understanding and Communications Mining™:
See how to accelerate model training and optimize model performance with active learning
Learn about the latest enhancements to out-of-the-box document processing – with little to no training required
Get an exclusive demo of the new family of UiPath LLMs – GenAI models specialized for processing different types of documents and messages
This is a hands-on session specifically designed for automation developers and AI enthusiasts seeking to enhance their knowledge in leveraging the latest intelligent document processing capabilities offered by UiPath.
Speakers:
👨🏫 Andras Palfi, Senior Product Manager, UiPath
👩🏫 Lenka Dulovicova, Product Program Manager, UiPath
Key Trends Shaping the Future of Infrastructure.pdfCheryl Hung
Keynote at DIGIT West Expo, Glasgow on 29 May 2024.
Cheryl Hung, ochery.com
Sr Director, Infrastructure Ecosystem, Arm.
The key trends across hardware, cloud and open-source; exploring how these areas are likely to mature and develop over the short and long-term, and then considering how organisations can position themselves to adapt and thrive.
FIDO Alliance Osaka Seminar: Passkeys at Amazon.pdf
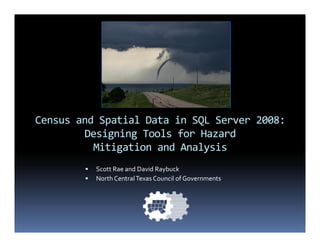
Census and spatial data in sql server 2008 designing tools for hazard mitigation and analysis
1. Census and Spatial Data in SQL Server 2008:
Designing Tools for Hazard
Mitigation and Analysis
Scott Rae and David Raybuck
North Central Texas Council of Governments
2. NCTCOG Region
12,800 square miles
16 counties
225 cities
134 school districts
29 special districts
3. NCTCOG Emergency
Management Roles
Functions
Mitigation
Response
Rapid Access to Data
Methods
Reporting
Mapping
Real-Time Analysis
16. Polygon Updating
Housing Units in
Updated Area Impacted Storm Direction Storm Speed Persons in Path
Path
7:12:00 PM 855.36 sq miles East-southeast 32 mph 36,468 13,346
7:22:00 PM 770.81 sq miles East 25 mph 33,074 12,187
7:38:00 PM 644.52 sq miles East 33 mph 12,001 4,544
7:50:00 PM 156 sq miles East 21 mph 954 407
17. Managing Data Flows into SQL 2008
.NET/TSQL
XML/HTTP
Partner Servers
SQL 2008
.NET/TSQL
Programmers
FME Workbench
.NET/TSQL
Web Editors
26. The ArcGIS Way
1. Calculate original area into source field
2. ArcToolbox Intersect source with target
3. Calculate new area into result field
4. Calculate overlap % (result area / original area)
5. Multiply this % by value(s) to infer
6. Summary Statistics Sum (group by Unique ID
of target)
27. The SQL Server 2008 Way
SELECT Target.UniqueID, SUM(PercentOfTarget
* SourceValue) FROM
(
SELECT Source.UniqueID, Target.UniqueID,
Source.SourceValue,
Source.geom.STIntersection(Target.geom).ST
Area() / Target.geom.STArea() AS
PercentOfTarget FROM Target INNER JOIN
Source on
Source.geom.STIntersects(Target.geom) = 1
)
GROUP BY Target.UniqueID
29. Bing Maps Tile Quadkeys
Length of the key in digits indicates the level of detail (aka zoom level)
Each quadkey starts with the quadkey of the parent grid (the next
largest square containing it)