The document provides comprehensive information on Cement Bond Logging (CBL) and Variable Density Logging (VDL), focusing on the principles, measurement techniques, and interpretations crucial for assessing cement integrity and isolation in wellbore operations. It highlights the importance of factors like acoustic impedance, transit time, and amplitude in determining the quality of the cement bond. Additionally, it discusses common issues affecting measurements and their implications for cementing operations.

![2 KS
British Training Centre
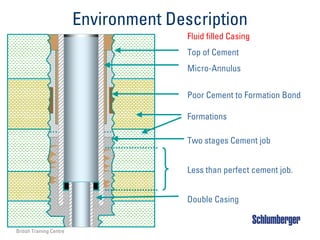
Objectives of Primary Cementing
Casing
Zone Hydraulic Isolation
Oil Zone
Water Zone
Cement
Prevents
•Mixing of unwanted fluids
•Fluids escaping to surface
•Invading fluids [crossflow]
•Casing Corrosion
•Casing Collapse
Shale Zone
Gas Zone](https://image.slidesharecdn.com/05cblvdl-241130175401-2ad2eba8/85/CBL-VDL-Cement-Bond-Logging-Basic-Theory-Interpretation-2-320.jpg)
![3 KS
British Training Centre
Cement Quality Problems
Casing
No Zone Hydraulic Isolation
Oil Zone
Water Zone
Cement
Causes
•Mixing of unwanted fluids
•Fluids escaping to surface
•Invading fluids [crossflow]
•Casing Corrosion
•Casing Collapse](https://image.slidesharecdn.com/05cblvdl-241130175401-2ad2eba8/85/CBL-VDL-Cement-Bond-Logging-Basic-Theory-Interpretation-3-320.jpg)
![5 KS
British Training Centre
CBL-VDL Log Applications
Client Needs
Oil Zone
Water Zone
Cement
To Evaluate Cement Job
•Check Integrity of Cement
•To Verify Zone Isolation
•To Determine Cement
Strength
•Is there any Channel ?
•Is it necessary to Repair ?
•Will be possible to Repair?
[ by performing a SQUEEZE ]
•Where is the Top of the
Cement ?
Casing](https://image.slidesharecdn.com/05cblvdl-241130175401-2ad2eba8/85/CBL-VDL-Cement-Bond-Logging-Basic-Theory-Interpretation-5-320.jpg)
![8 KS
British Training Centre
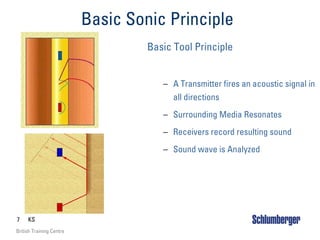
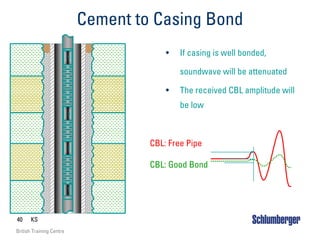
Basic CBL Principle
Similar to a Ringing Bell
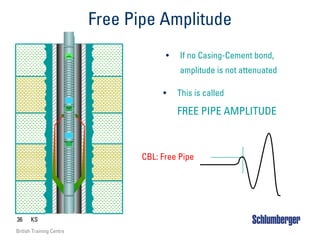
When Fluid is behind
Casing, pipe is free to
vibrate [ loud sound ]
When the casing is
bonded to hard cement,
casing vibrations are
attenuated proportionally
to bonded surface
Good
Bond
Good
Good
Bond
Bond
No
Cement
No
No
Cement
Cement](https://image.slidesharecdn.com/05cblvdl-241130175401-2ad2eba8/85/CBL-VDL-Cement-Bond-Logging-Basic-Theory-Interpretation-8-320.jpg)
![12 KS
British Training Centre
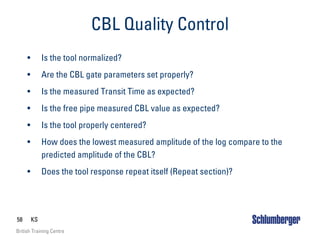
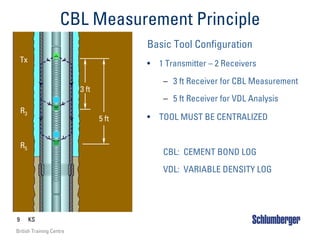
CBL Qualitative Meaning
Good
Bond
Good
Good
Bond
Bond
No
Cement
No
No
Cement
Cement
HIGH CBL signal strength => pipe is free to vibrate [ no cement ]
LOW CBL signal strength => atennuated energy [ cement is present]](https://image.slidesharecdn.com/05cblvdl-241130175401-2ad2eba8/85/CBL-VDL-Cement-Bond-Logging-Basic-Theory-Interpretation-12-320.jpg)
![28 KS
British Training Centre
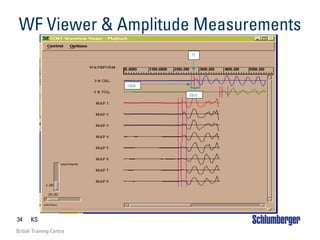
CBL-VDL Standard Outputs Presentation
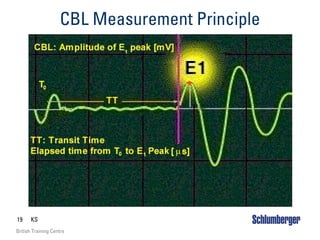
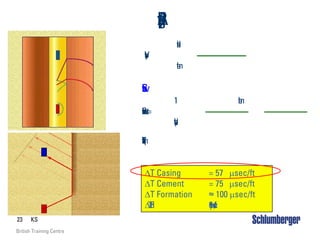
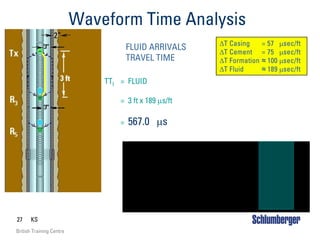
•Transit Time TT in micro-seconds [µs]
•CBL Amplitude in millivolts [mV ]
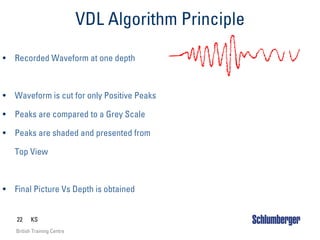
•VDL Variable Density Log [wafeform visual representation]
0 CBL 100
[mV]
400 TT 200
[µs]
200 VDL 1200
[µs]
GR
CCL](https://image.slidesharecdn.com/05cblvdl-241130175401-2ad2eba8/85/CBL-VDL-Cement-Bond-Logging-Basic-Theory-Interpretation-28-320.jpg)
![29 KS
British Training Centre
CBL-VDL Standard Outputs
•Transit Time TT in micro-seconds [µs]
Log Quality Control
•CBL Amplitude in millivolts [mV ]
Quantitative Measurement of waveform energy
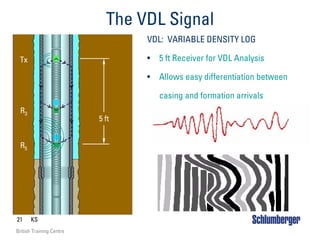
•VDL Variable Density Log [waveform visual representation]
Qualitative Analysis of sound
Qualitative indicator of the presence of solid materials behind the casing
•Gamma Ray and CCL as auxiliary curves for Correlation](https://image.slidesharecdn.com/05cblvdl-241130175401-2ad2eba8/85/CBL-VDL-Cement-Bond-Logging-Basic-Theory-Interpretation-29-320.jpg)
![32 KS
British Training Centre
TT Cycle Skipping
E1 could not reach Detection Threshold Level
T T skips to 3rd Peak [E3 ]........this is known as CYCLE SKIPPING
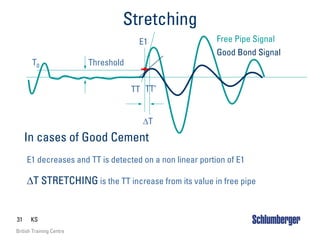
In cases of very Good Cement
Threshold
E1 E3
E2
T0
TT TT’](https://image.slidesharecdn.com/05cblvdl-241130175401-2ad2eba8/85/CBL-VDL-Cement-Bond-Logging-Basic-Theory-Interpretation-32-320.jpg)
![33 KS
British Training Centre
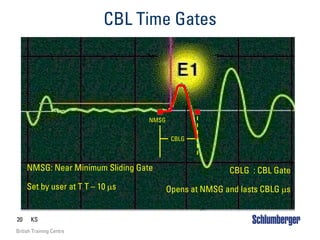
CBL Time Gates
E1 does not reach Detection Threshold Level
T T skips to 3rd Peak [E3 ]........this is known as CYCLE SKIPPING
Threshold
E3
T0
TT TT’](https://image.slidesharecdn.com/05cblvdl-241130175401-2ad2eba8/85/CBL-VDL-Cement-Bond-Logging-Basic-Theory-Interpretation-33-320.jpg)
![48 KS
British Training Centre
Tool Eccentering
Causes for Eccentralization
5
3
2
T
• Improper Equipment selection
[ Centralizers ] for Casing Size
• Missing or Broken Centralizer(s)
• Weak Centralizers in deviated wells
• Tool Damaged and/or bent
• Damaged Casing
Consequences
• Unbalanced sound paths
• Resulting waveform is meaningless](https://image.slidesharecdn.com/05cblvdl-241130175401-2ad2eba8/85/CBL-VDL-Cement-Bond-Logging-Basic-Theory-Interpretation-48-320.jpg)
![49 KS
British Training Centre
Eccentering Analysis
There will be destructive interference from different sound paths
Waveform from close tool side to casing
If the tool is eccentered
Threshold
T0
TT
Short Path Waveform
Resulting Waveform
Waveform from far tool side to casing
Delayed Waveform
Result is a Bad Log
not recoverable
in Playback
Normal Waveform
Resulting waveform has Dramatic lower amplitude
Resembling a zone of Good Cement but with shorter Transit Time [≈ 4 µs less]](https://image.slidesharecdn.com/05cblvdl-241130175401-2ad2eba8/85/CBL-VDL-Cement-Bond-Logging-Basic-Theory-Interpretation-49-320.jpg)
![50 KS
British Training Centre
Eccentering
If the tool is eccentered
Threshold
T0
TT
Resulting Waveform Normal Waveform
There will be destructive interference from different sound paths
Waveform from close tool side to casing
Waveform from far tool side to casing
Result is a Bad Log
not recoverable
in Playback
Resulting waveform has Dramatic lower amplitude
Resembling a zone of Good Cement but with shorter Transit Time [≈ 4 µs less]](https://image.slidesharecdn.com/05cblvdl-241130175401-2ad2eba8/85/CBL-VDL-Cement-Bond-Logging-Basic-Theory-Interpretation-50-320.jpg)
![54 KS
British Training Centre
CBL Quantitative Interpretation
• ATTENUATION
– Logarithm of E1 amplitude [first peak of CBL waveform]
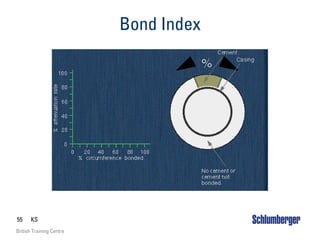
• BOND INDEX
Attenuation in zone of interest [dB/ft]
BI =
Attenuation in Cemented Section [dB/ft]](https://image.slidesharecdn.com/05cblvdl-241130175401-2ad2eba8/85/CBL-VDL-Cement-Bond-Logging-Basic-Theory-Interpretation-54-320.jpg)
![56 KS
British Training Centre
Zone Insulation Based on Bond Index
5
5 6
6 7
7 8
8 9
9 10
10
30
30
25
25
20
20
15
15
10
10
5
5
Bond Index = 70 %
Bond Index = 70 %
Bond Index = 60 %
Bond Index = 60 %
Bond Index = 80 %
Bond Index = 80 %
C
a
s
i
n
g
O
.
D
.
[
i
n
]
I
n
t
e
r
v
a
l
[
f
t
]](https://image.slidesharecdn.com/05cblvdl-241130175401-2ad2eba8/85/CBL-VDL-Cement-Bond-Logging-Basic-Theory-Interpretation-56-320.jpg)
![5
7
K
S
B
r
i
t
i
s
h
T
r
a
i
n
i
n
g
C
e
n
t
r
e
C
B
L
Q
u
a
n
t
i
t
a
t
i
v
e
I
n
t
e
r
p
r
e
t
a
t
i
o
n
Q
u
a
n
t
i
t
a
t
i
v
e
I
n
t
e
r
p
r
e
t
a
t
i
o
n
I
n
t
e
r
p
r
e
t
a
t
i
o
n
M
1
C
h
a
r
t
C
a
s
i
n
g
D
a
t
a
O
.
D
.
7
”
,
2
9
l
b
m
/
f
t
C
e
m
e
n
t
C
o
m
p
r
e
s
i
v
e
S
t
r
e
n
g
t
h
3
0
0
0
p
s
i
C
a
s
i
n
g
T
h
i
c
k
n
e
s
s
[
f
r
o
m
t
a
b
l
e
s
]
.
4
0
8
i
n
C
B
L
v
a
l
u
e
f
o
r
1
0
0
%
B
o
n
d
[
m
i
n
i
m
u
m
e
x
p
e
c
t
e
d
a
m
p
l
i
t
u
d
e
]
7
0
%
B
o
n
d
I
n
d
e
x
?
C
B
L
v
a
l
u
e
f
o
r
7
0
%
B
o
n
d](https://image.slidesharecdn.com/05cblvdl-241130175401-2ad2eba8/85/CBL-VDL-Cement-Bond-Logging-Basic-Theory-Interpretation-57-320.jpg)