Download to read offline

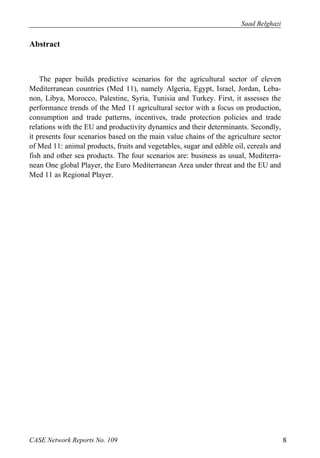

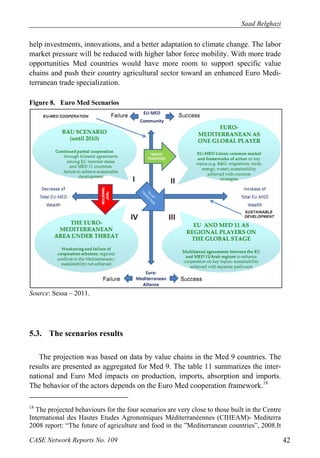
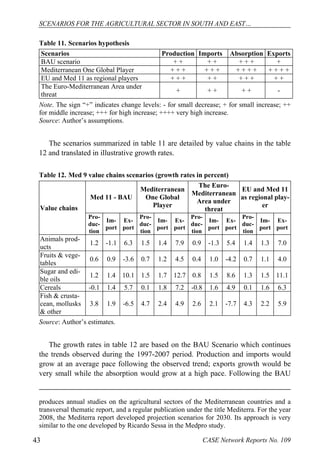
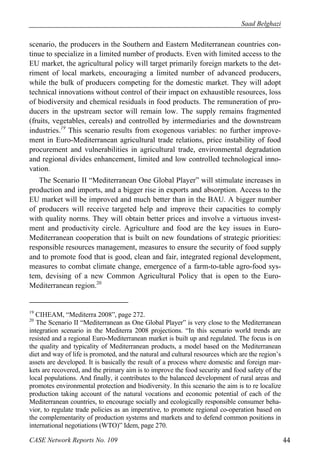
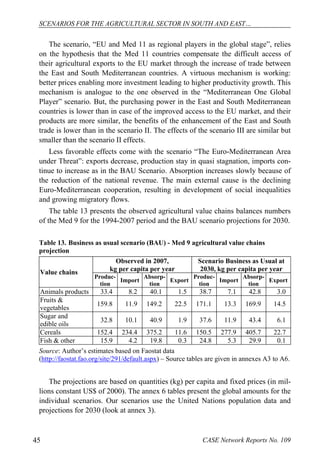
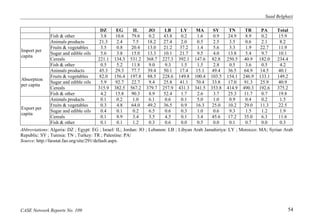
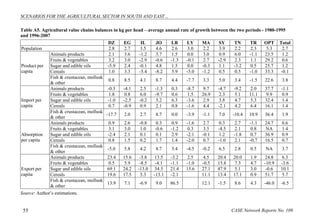
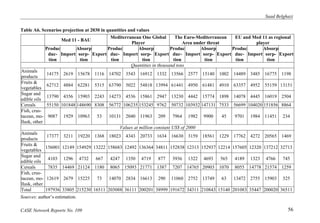

This document presents a predictive analysis of the agricultural sector in eleven Mediterranean countries (med 11) and assesses trends in production, consumption, trade patterns, and policies from 1994 to 2007. It outlines four potential scenarios for the agricultural sector's future, highlighting key challenges such as trade deficits and the impact of climate change on productivity. The scenarios include 'business as usual,' 'Mediterranean one global player,' 'Euro Mediterranean area under threat,' and 'EU and med 11 as regional player.'


