Download to read offline


![References
Ahn N., Garcia J.R., Herce J.A. (2005), Demographic Uncertainty and Health Care Expenditure in
Spain, Paper prepared for the DEMWEL project, FEDEA
Batljan I., Lagergren M. (2004), Inpatient/outpatient health care costs and remaining years of life – effect of
decreasing mortality on future acute health care demand, Social Science and Medicine 59, s. 2459-2466
Brockmann H. (2002), Why is less money spent on health care for the elderly than for the rest of the
population? Health care rationing in German hospitals, Social Science & Medicine 55, s.593-608
Carone G., Costello D., Guardia N.D., Mourre G., Przywara B., Salomaki A. (2005), The economic
impact of ageing populations in the EU-25 Member States, European Economy Number 236,
Directorate-General for Economic and Financial Affairs, Brussels
Case – Doradcy (2005), Projekt reformy systemu ochrony zdrowia w Polsce. Część I i II [A proposal for
Polish healthcare system reform. Part I and Part II], Warszawa, www.case-doradcy.com.pl
Chłoń A., Góra M., Rutkowski M. (1999), Shaping Pension Reform in Poland. Security Through
Diversity, Social Protection Discussion Papers No. 9923, The World Bank, Washington DC
Cichon M., Newbrander W., Yamabana H., Weber A., Normand Ch., Dror D., Preker A. (1999),
Modeling in health care finance. A compendium of quantitative techniques for health care
financing, International Labour Office, Geneva
Christiansen T., Bech M, Laurdisen J., Nielsen P. (2006), Demographic Changes and Aggregate
Health-Care Expenditure in Europe, ENEPRI Research Report No. 32, AHEAD WP6B,
www.enepri.org
Cruijsen H., Tsvetarsky S. (2004), Long-term Fertility Scenarios for the 10 New EU Member States and
2 Accession Countries. Report on behalf of Eurostat, NIDI, the Hague
European Commission (2006), The impact of ageing on public expenditure: projections for the EU25
Member States on pensions, health care, long-term care, education and unemployment transfers
(2004-2050), Report No 1/2006
Felder S., Megier M., Schimitt H. (2000), Health care expenditure in the last month of life, Journal
of Health Economics, 19: 679-695
Golinowska S. with cooperation of: Kozierkiewicz A., Sowada Ch. (2004), Pożądane kierunki zmiany
systemu ochrony zdrowia w Polsce. Trzeci etap reform [Required directions for health sector
changes in Poland. Third stage of reform], CASE, Warszawa
Golinowska S., Sowa A. (2006), Health and Morbidity in the Accession Countries. Country report -
Poland, ENEPRI Research Report No. 29,
http://shop.ceps.eu/BooksList.php?category_id=17&FormList_Page=1#List
57
SCENARIOS FOR HEALTH EXPENDITURE IN POLAND
CASE Network Reports No. 78/2008](https://image.slidesharecdn.com/cnrrap78-141022092649-conversion-gate01/85/CASE-Network-Report-78-Scenarios-For-Health-Expenditure-in-Poland-57-320.jpg)
![Golinowska S., Neneman J. (2006), Reforma finansów publicznych. Podatki i wydatki publiczne
[Public finance reform. Taxes and public expenditures], w: Jakie reformy są potrzebne Polsce,
Zeszyty BRE BANK – CASE, Warszawa, p. 19-29
GUS [Central Statistical Office] (2004), Prognoza ludności na lata 2003-2030 [Population projection
for Poland 2003-2030], Warsaw
GUS [Central Statistical Office] (2004), Sytuacja demograficzna Polski. Raport 2003 [Demographic
situation in Poland. 2003 Report], Warsaw
GUS [Central Statistical Office] (2004), Rocznik statystyczny pracy 2003 [Statistical yearbook of
labour 2003], Warsaw
GUS [Central Statistical Office] (2006), Narodowy Rachunek Zdrowia. Wydatki na ochronę zdrowia
1999, 2002, 2003, [National Health Account. Health Care Expenditures 1999, 2002, 2003],
Biblioteka Wiadomości Statystycznych, Tom 54, Warszawa
Kohman E. Waele M. (2007), Development of Scenarios for Health Expenditure in the European
Union Member States, draft report of WP8 of AHEAD Project,
http://shop.ceps.eu/BooksList.php?category_id=17&FormList_Page=1#List
Martins J.O. (2006), Projecting OECD Health and Long Term Care Expenditures: What are the Main
Drivers? Presentation at Agein, Health Status and Determinants of Health Expenditure (AHEAD)
workshop, Vienna March 13,
MF (Ministry of Finances) (2006), Uzasadnienie do projektu ustawy budżetowej na rok 2007, [2007
budget bill explanation], http://www.mf.gov.pl/dokument.php?dzial=32&id=55955
MF (Ministry of Finances) (2006), Program konwergencji. Aktualizacja 2006, [Convergence Program.
2006 update], Warszawa
MGiP (Ministerstwo Gospodarki i Pracy) [Ministry of Economy and Labor] (2004), Założenia
Narodowego Planu Rozwoju na lata 2007-2013, [National Development Plan Assumptions 2007-
2013], Warszawa
MGiP (Ministerstwo Gospodarki i Pracy) [Ministry of Economy and Labor] (2005), Krajowa Strategia
Zatrudnienia na lata 2007-2013 [National Employment Strategy 2007-2013], Warszawa
MZ (Ministerstwo Zdrowia) (2004), Finansowanie ochrony zdrowia w Polsce – Zielona Księga [Health
Care Financing in Poland – the Green Book], Ministry of Health, Warsaw
OECD (2006), Projecting OECD Health and Long Term Care Expenditures: What are the Main Drivers?
Economic Department Working Papers No. 477, ECO/WKP(2006)5, www.oecd.org/eco
Okólski M. (2004), Demografia zmiany społecznej, [Demographics of social change], Wydawnictwo
Naukowe SCHOLAR, Warszawa
Orosz E. (2003), Health expenditure trends in OECD countries 1990-2002, Health Care Financing
Review, 9/22/2003, OECD
Seshamani M., Gray A. (2004), Time to death and health expenditure: an improved model for the
impact of demographic change on health care costs, Age and Ageing 33 (6), s.556-561
Scholz W., Cichon M., Hagemejer K. (2000), Social budgeting, International Labour Office, Geneva
UN (2006), World Population Prospects: the 2004 Revision Population Database,
http://esa.un.org/unpp/index.asp?panel=4
58
Stanisława Golinowska, Ewa Kocot, Agnieszka Sowa
CASE Network Reports No. 78/2008](https://image.slidesharecdn.com/cnrrap78-141022092649-conversion-gate01/85/CASE-Network-Report-78-Scenarios-For-Health-Expenditure-in-Poland-58-320.jpg)


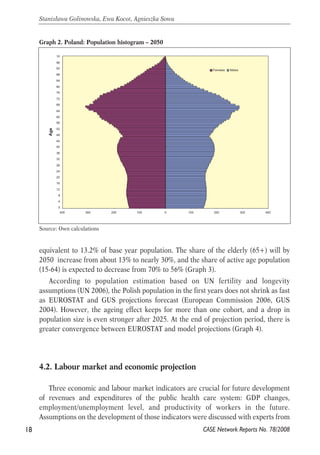
The report examines future health care system revenues and expenditures in Poland, emphasizing the impact of demographic changes and health status on spending up to 2050. It uses the International Labour Organization's (ILO) social budget model to analyze four different scenarios, indicating that health expenditures will increase significantly in the next three decades, eventually leading to a deficit. Policy recommendations are made based on projection results to address sustainability in the health care system.


