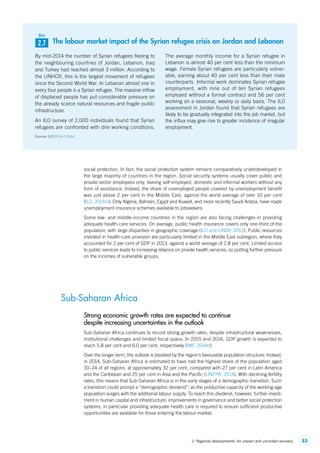
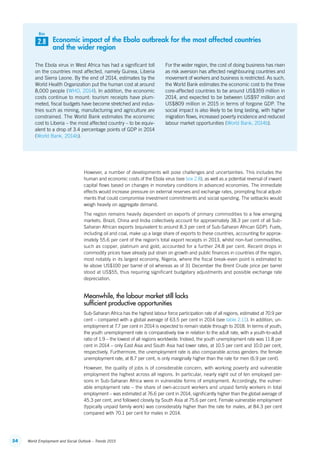
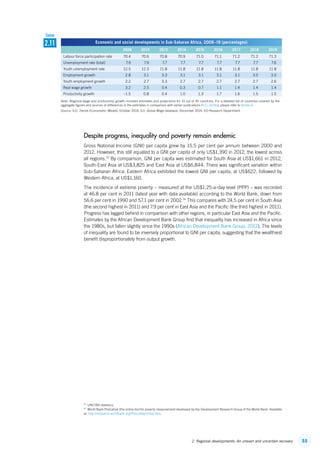
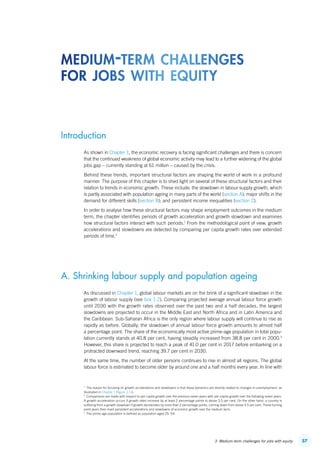
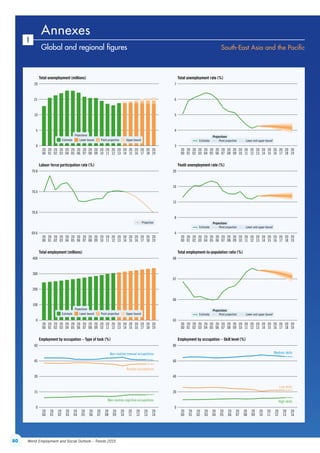
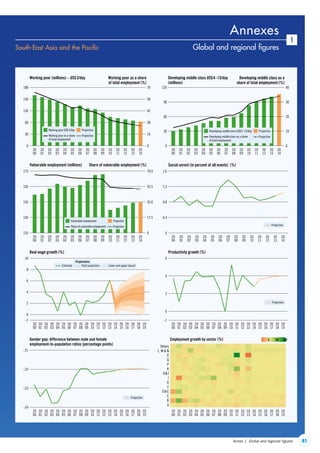
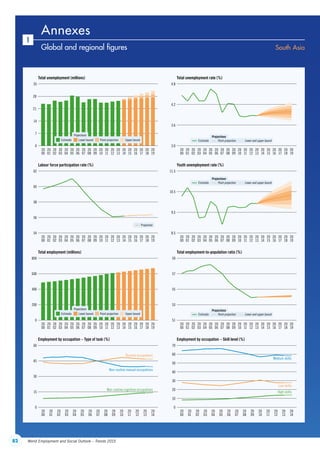
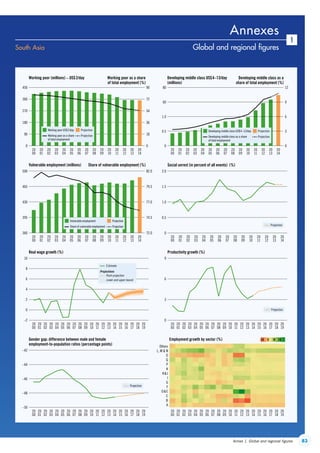
2 015
Trends
ORLDORLD
MPLOYMENTMPLOYMENT
OCIALOCIAL
UTLOOKUTLOOK
world employment and social outlook
ContentsContents
Trends 2015
world employment
and social outlook
INTERNATIONAL LABOUR OFFICE  •  GENEVA
ContentsContents
World employment and social outlook: Trends 2015 / International Labour Office. – Geneva: ILO, 2015
ISBN  978-92-2-129259-3  (print)
ISBN  978-92-2-129260-9 (web pdf)
International Labour Office
employment / unemployment / youth employment / youth unemployment / labour policy / economic recovery /
regional development / Africa / Asia / Caribbean / developed countries / Europe / EU countries / Latin America /
Middle East / Pacific
13.01.3
The designations employed in ILO publications, which are in conformity with United Nations practice, and the presentation
of material therein do not imply the expression of any opinion whatsoever on the part of the International Labour Office
concerning the legal status of any country, area or territory or of its authorities, or concerning the delimitation of its frontiers.
The responsibility for opinions expressed in signed articles, studies and other contributions rests solely with their authors,
and publication does not constitute an endorsement by the International Labour Office of the opinions expressed in them.
Reference to names of firms and commercial products and processes does not imply their endorsement by the International
Labour Office, and any failure to mention a particular firm, commercial product or process is not a sign of disapproval.
ILO publications and digital products can be obtained through major booksellers and digital distribution platforms, or ordered
directly from ilo@turpin-distribution.com. For more information, visit our website: www.ilo.org/publns or contact ilopubs@ilo.org.
Copyright © International Labour Organization 2015
First published 2015
Publications of the International Labour Office enjoy copyright under Protocol 2 of the Universal Copyright Convention.
Nevertheless, short excerpts from them may be reproduced without authorization, on condition that the source is indicated.
For rights of reproduction or translation, application should be made to ILO Publications (Rights and Licensing), International
Labour Office, CH-1211 Geneva 22, Switzerland, or by email: rights@ilo.org. The International Labour Office welcomes such
applications.
Libraries, institutions and other users registered with reproduction rights organizations may make copies in accordance with
the licences issued to them for this purpose. Visit www.ifrro.org to find the reproduction rights organization in your country.
ILO Cataloguing in Publication Data
This publication was produced by the Document and Publications Production,
Printing and Distribution Branch (PRODOC) of the ILO.
Graphic and typographic design, manuscript preparation, copy editing, layout
and composition, proofreading, printing, electronic publishing and distribution.
PRODOC endeavours to use paper sourced from forests managed
in an environmentally sustainable and socially responsible manner.
Code: DTP-WEI-CORR-ATA-DISTR
ContentsContents
5Contents
Acknowledgements  . . . . . . . . . . . . . . . . . . . . . . . . . . . . . . . . . . . . . . . . . . . . . . . . . . . . . 	9
Summary: Renewed turbulence over the employment horizon  . . . . . 	11
1. Global employment and social developments . . . . . . . . . . . . . . . . . . . . 	15
Introduction . . . . . . . . . . . . . . . . . . . . . . . . . . . . . . . . . . . . . . . . . . . . . . . . . . . . . . . . . 	15
A.	Labour market trends  . . . . . . . . . . . . . . . . . . . . . . . . . . . . . . . . . . . . . . . . . . . . . 	16
B.	Social developments and trends  . . . . . . . . . . . . . . . . . . . . . . . . . . . . . . . . . . . 	27
Appendix  . . . . . . . . . . . . . . . . . . . . . . . . . . . . . . . . . . . . . . . . . . . . . . . . . . . . . . . . . . 	31
2. Regional developments: An uneven and uncertain recovery . . . . 	33
Developed Economies and European Union . . . . . . . . . . . . . . . . . . . . . . . . . . . 	33
Central and South-Eastern Europe (non-EU) and the CIS .. . . . . . . . . . . . . . . . 	38
Latin America and the Caribbean  . . . . . . . . . . . . . . . . . . . . . . . . . . . . . . . . . . . . 	41
East Asia . . . . . . . . . . . . . . . . . . . . . . . . . . . . . . . . . . . . . . . . . . . . . . . . . . . . . . . . . . . 	44
South-East Asia and the Pacific . . . . . . . . . . . . . . . . . . . . . . . . . . . . . . . . . . . . . . . 	46
South Asia  . . . . . . . . . . . . . . . . . . . . . . . . . . . . . . . . . . . . . . . . . . . . . . . . . . . . . . . . . 	49
Middle East and North Africa  . . . . . . . . . . . . . . . . . . . . . . . . . . . . . . . . . . . . . . . . 	51
Sub-Saharan Africa . . . . . . . . . . . . . . . . . . . . . . . . . . . . . . . . . . . . . . . . . . . . . . . . . 	53
3. Medium-term challenges for jobs with equity   . . . . . . . . . . . . . . . . . . . . 	57
Introduction . . . . . . . . . . . . . . . . . . . . . . . . . . . . . . . . . . . . . . . . . . . . . . . . . . . . . . . . . 	57
A. Shrinking labour supply and population ageing   . . . . . . . . . . . . . . . . . . . . 	57
B. Changes in occupational patterns  . . . . . . . . . . . . . . . . . . . . . . . . . . . . . . . . . 	60
C. Income inequality and economic growth accelerations and slowdowns   .	64
Concluding remarks . . . . . . . . . . . . . . . . . . . . . . . . . . . . . . . . . . . . . . . . . . . . . . . . . 	65
Appendix  . . . . . . . . . . . . . . . . . . . . . . . . . . . . . . . . . . . . . . . . . . . . . . . . . . . . . . . . . . 	66
Annexes
1.	Global and regional figures . . . . . . . . . . . . . . . . . . . . . . . . . . . . . . . . . . . . . . . 	71
2.	Labour market estimates and projections . . . . . . . . . . . . . . . . . . . . . . . . . . . . 	90
3.	Occupational and sectoral employment estimates and projections .. . . . 	93
4.	Real wage growth estimates and projection . . . . . . . . . . . . . . . . . . . . . . . . . 	94
5.	Regional groupings . . . . . . . . . . . . . . . . . . . . . . . . . . . . . . . . . . . . . . . . . . . . . . . 	95
Bibliography  . . . . . . . . . . . . . . . . . . . . . . . . . . . . . . . . . . . . . . . . . . . . . . . . . . . . . . . . . . . . . 	97
contents
ContentsContents
6 World Employment and Social Outlook – Trends 2015
List of figures
	1.1	 Global growth and its components  . . . . . . . . . . . . . . . . . . . . . . . . . . . . . . . . . . . . . . 	15
	1.2	 Global jobs gap, 2014–19 . . . . . . . . . . . . . . . . . . . . . . . . . . . . . . . . . . . . . . . . . . . . . 	16
	1.3	 Global unemployment, 2014–19  . . . . . . . . . . . . . . . . . . . . . . . . . . . . . . . . . . . . . . . . 	17
	1.4	 Differences between projected and observed unemployment, 2007–13 . . . . . . . . 	18
	1.5	 Global labour force participation rate: Projections vs trend, 1990–2030 . . . . . . . 	20
	1.6	 Change in youth unemployment, 2019 vs 2014 . . . . . . . . . . . . . . . . . . . . . . . . . . . . 	21
	1.7	 Gender gaps in the labour market, 2014 vs 2019 . . . . . . . . . . . . . . . . . . . . . . . . . . 	22
	1.8	 Sectoral employment growth, selected sectors . . . . . . . . . . . . . . . . . . . . . . . . . . . . . 	23
	1.9	 Development of employment by occupation . . . . . . . . . . . . . . . . . . . . . . . . . . . . . . . 	24
	1.10	 Growth and the productivity impact of lower labour market turnover . . . . . . . . . . 	25
	1.11	 The impact of growth accelerations and slowdowns on changes
in unemployment  . . . . . . . . . . . . . . . . . . . . . . . . . . . . . . . . . . . . . . . . . . . . . . . . . . . . . 	26
	1.12	 Vulnerable employment as a share of total employment in developing
economies, 2007–19 . . . . . . . . . . . . . . . . . . . . . . . . . . . . . . . . . . . . . . . . . . . . . . . . . . 	27
	1.13	 Employment by economic class in developing countries, 1991–2019 . . . . . . . . . . 	28
	1.14	 Income inequality in advanced and developing economies and regions . . . . . . . 	28
	1.15	 Confidence in government, 2012 vs 2013 .. . . . . . . . . . . . . . . . . . . . . . . . . . . . . . . . 	29
	1.16	 Social unrest and youth unemployment . . . . . . . . . . . . . . . . . . . . . . . . . . . . . . . . . . . 	30
	2.1	 Reaction of wages to changes in unemployment, 1994–2019 . . . . . . . . . . . . . . . . 	35
	2.2	 Unemployment rates by age in the EU-28, Q2 2014 . . . . . . . . . . . . . . . . . . . . . . . . 	35
	2.3	 Unemployment rates in the Central and South-Eastern Europe and CIS region
and selected countries within, 2008, 2009 and 2014  . . . . . . . . . . . . . . . . . . . . . . 	40
	2.4	 GDP annual growth in LAC and advanced economies, 2003–15  . . . . . . . . . . . . . 	41
	2.5	 Inequality levels remain high in comparative terms as measured by Gini index .. 	43
	2.6	 Employment level in Malaysia by gender, 2010 and 2013   . . . . . . . . . . . . . . . . . . 	48
	2.7	 Gender differences in labour force participation rates, selected countries  . . . . . . 	50
	3.1	 Impact of labour supply characteristics on the probability of economic growth
slowdowns and accelerations .. . . . . . . . . . . . . . . . . . . . . . . . . . . . . . . . . . . . . . . . . . 	58
	3.2	 Correlations between type of occupation and income levels,
developing economies, 1991–2013 .. . . . . . . . . . . . . . . . . . . . . . . . . . . . . . . . . . . . . 	61
	3.3	 Impact of manufacturing employment changes on the probability
of economic growth slowdowns and accelerations . . . . . . . . . . . . . . . . . . . . . . . . . 	62
	3.4	 Share of workers in manufacturing employment when manufacturing
employment was at its peak, 1992–2013 . . . . . . . . . . . . . . . . . . . . . . . . . . . . . . . . . 	63
	3.5	 Impact of income inequality on the probability of economic growth slowdowns
and accelerations .. . . . . . . . . . . . . . . . . . . . . . . . . . . . . . . . . . . . . . . . . . . . . . . . . . . . 	64
	A.1	 Share of economic growth slowdowns and accelerations in total number
of observations, by income per capita level . . . . . . . . . . . . . . . . . . . . . . . . . . . . . . . 	67
ContentsContents
7Contents
List of tables
	1.1	 Unemployment developments, 2007–17  . . . . . . . . . . . . . . . . . . . . . . . . . . . . . . . . . . 	19
	1.2	 Wage and productivity growth (107 countries; annual average), selected periods  .	25
	1.3	 Projection differences, 2013 vs 2014 .. . . . . . . . . . . . . . . . . . . . . . . . . . . . . . . . . . . . 	31
	2.1	 Economic and social developments in Developed Economies and EU, 2009–19 .	34
	2.2	 Long-term unemployment and social indicators in the EU-27 . . . . . . . . . . . . . . . . . 	36
	2.3	 Economic and social developments in Central and South-Eastern Europe (non-EU)
and CIS, 2009–19 .. . . . . . . . . . . . . . . . . . . . . . . . . . . . . . . . . . . . . . . . . . . . . . . . . . . 	39
	2.4	 Income inequality and poverty in selected countries
of Central and South-Eastern Europe and CIS  . . . . . . . . . . . . . . . . . . . . . . . . . . . . . 	40
	2.5	 Economic and social developments in Latin America
and the Caribbean, 2009–19 . . . . . . . . . . . . . . . . . . . . . . . . . . . . . . . . . . . . . . . . . . 	42
	2.6	 Economic and social developments in East Asia, 2009–19 .. . . . . . . . . . . . . . . . . . 	45
	2.7	 Economic and social developments in South-East Asia and the Pacific, 2009–19 .	46
	2.8	 Economic and social developments in South Asia, 2009–19  . . . . . . . . . . . . . . . . . 	50
	2.9	 Poverty headcount ratio and inequality, selected countries, latest available data  .	50
	2.10	 Economic and social developments in Middle East and North Africa, 2009–19 . 	52
	2.11	 Economic and social developments in Sub-Saharan Africa, 2009–19 .. . . . . . . . . 	55
	A.1	 Data sources for labour market variables  . . . . . . . . . . . . . . . . . . . . . . . . . . . . . . . . . 	67
	A.2	 Determinants of economic growth slowdowns . . . . . . . . . . . . . . . . . . . . . . . . . . . . . 	68
	A.3	 Determinants of economic growth accelerations .. . . . . . . . . . . . . . . . . . . . . . . . . . . 	69
List of boxes
	1.1	 Changes to unemployment projections  . . . . . . . . . . . . . . . . . . . . . . . . . . . . . . . . . . . 	18
	1.2	 Medium-term prospects for the global labour market .. . . . . . . . . . . . . . . . . . . . . . . 	20
	2.1	 Competitiveness and wages in Europe  . . . . . . . . . . . . . . . . . . . . . . . . . . . . . . . . . . . 	34
	2.2	 The case of Greece . . . . . . . . . . . . . . . . . . . . . . . . . . . . . . . . . . . . . . . . . . . . . . . . . . . 	37
	2.3	 Geopolitical tensions are affecting economies in Central and South-Eastern
Europe and the CIS  . . . . . . . . . . . . . . . . . . . . . . . . . . . . . . . . . . . . . . . . . . . . . . . . . . . 	38
	2.4	 Social protection programmes in Latin America: The case of Peru . . . . . . . . . . . . . 	43
	2.5	 China’s graduates: Not enough good jobs . . . . . . . . . . . . . . . . . . . . . . . . . . . . . . . . 	45
	2.6	 Female employment in Malaysia . . . . . . . . . . . . . . . . . . . . . . . . . . . . . . . . . . . . . . . . 	48
	2.7	 The labour market impact of the Syrian refugee crisis on Jordan and Lebanon . . . 	53
	2.8	 Economic impact of the Ebola outbreak for the most affected countries
and the wider region .. . . . . . . . . . . . . . . . . . . . . . . . . . . . . . . . . . . . . . . . . . . . . . . . . 	54
	3.1	 The hollowing-out of medium-skilled jobs  . . . . . . . . . . . . . . . . . . . . . . . . . . . . . . . . . 	60
	3.2	 Is premature de-industrialization a concern? .. . . . . . . . . . . . . . . . . . . . . . . . . . . . . . 	62
ContentsContents
9Acknowledgements
Preparations for the World Employment and Social Outlook – Trends 2015 were led by the
Job‑friendly Macroeconomic Policies team in the ILO Research Department, headed by Ekkehard
Ernst. The project was supervised by Raymond Torres, Director of the Research Department and
Moazam Mahmood, Deputy Director.
The report was prepared by: Vladimir Andrianov, Valia Bourmpoula, Juan Chacaltana, Sukti
Dasgupta, Marta Duda, Ekkehard Ernst, Salwa Haidar, Richard Horne, Phu Huynh, Aya Jafaar,
Sameer Khatiwada, Kee Beom Kim, Stefan Kühn, Mary Kawar, Xinrong Liu, Makiko Matsumoto,
Rossana Merola, Santo Milasi, Michael Mwasikakata, Veda Narasimhan, Alena Nesporova, Prakash
Pathak, Clemente Pignatti, Damien Roche, Steven Tobin, Raymond Torres, Sher Verick and
Christian Viegelahn.
Specific mention should be given to Valia Bourmpoula for preparing the global and regional esti-
mates on the basis of the dedicated econometric models; Veda Narasimhan for preparing the
regional wage projections; Salwa Haidar for helpful research assistance; and Judy Rafferty for
assistance with the publication process. The publication would not have been possible without the
contributions of other members of the Job-friendly Macroeconomic Policies team, notably Philippe
Blet and Anne Drougard.
The team wishes to acknowledge the comments and suggestions provided by Sandra Polaski,
Deputy Director-General for Policy and James Howard from Director-General’s Office. Comments
on earlier drafts were also provided by ILO Regional and Country Offices as well as several Policy
Departments, notably the Social Protection Department, the Sectoral Activities Department and
the Conditions of Work and Equality Department. We would like to express our thanks to colleagues
in the ILO Department of Communication and Public Information for their continued collaboration
and support in diffusing the publication.
The analysis provided in the World Employment and Social Outlook relies heavily on available
data. The ILO Research Department takes this opportunity to thank all institutions involved in the
collection and dissemination of labour market information, including national statistical agencies
and the ILO Department of Statistics.
Finally, the team also benefited from a careful review and helpful comments on an earlier versions
of the report by the Research Department of the International Monetary Fund, the United Nations
Department of Economic and Social Affairs and the World Bank’s Development Prospects Group.
acknowledgements
ContentsContents
11Summary
The world economy continues to expand at rates well below the trends that preceded the onset
of the global crisis in 2008 and is unable to close the significant employment and social gaps that
have emerged. The challenge of bringing unemployment and underemployment back to pre-crisis
levels now appears as daunting a task as ever, with considerable societal and economic risks
associated with this situation.
The global employment gap caused by the crisis continues to widen
This report finds that the global employment outlook will deteriorate in the coming five years. Over
201 million people were unemployed in 2014 around the world, over 31 million more than before
the start of the global crisis. And, global unemployment is expected to increase by 3 million in 2015
and by a further 8 million in the following four years.
The global employment gap, which measures the number of jobs lost since the start of the crisis,
currently stands at 61 million. If new labour market entrants over the next five years are taken into
account, an additional 280 million jobs need to be created by 2019 to close the global employment
gap caused by the crisis.
Youth, especially young women, continue to be disproportionately affected by unemployment.
Almost 74 million young people (aged 15–24) were looking for work in 2014. The youth un-
employment rate is practically three times higher than is the case for their adult counterparts. The
heightened youth unemployment situation is common to all regions and is occurring despite the
trend improvement in educational attainment, thereby fuelling social discontent.
The employment situation is improving in some advanced
economies, while remaining difficult in much of Europe…
There is a reversal across regions in the employment outlook. Job recovery is proceeding in
advanced economies taken as a group – though with significant differences between countries.
Unemployment is falling, sometimes retrieving pre-crisis rates, in Japan, the United States and
some European countries. In southern Europe, unemployment is receding slowly, though from
overly high rates.
… and is deteriorating in emerging and developing economies
By contrast, after a period of better performance compared to the global average, the situation is
deteriorating in a number of middle-income and developing regions and economies, such as Latin
America and the Caribbean, China, the Russian Federation and a number of Arab countries. The
employment situation has not improved much in sub-Saharan Africa, despite better economic
growth performance until recently. In most of these countries, underemployment and informal
employment are expected to remain stubbornly high over the next five years.
Summary
renewed turbulence over
the employment horizon
ContentsContents
12 World Employment and Social Outlook – Trends 2015
The significant fall in oil prices that has continued in early 2015 will, if sustained, improve
employment prospects somewhat in importing countries. However, this is unlikely to offset the
impacts of a still fragile and uneven recovery – one that will worsen for oil exporters.
As a consequence, the improvements in vulnerable employment have stalled in emerging and
developing countries. The incidence of vulnerable employment is projected to remain broadly
constant at around 45 per cent of total employment over the next two years, in stark contrast to the
declines observed during the pre-crisis period. The number of workers in vulnerable employment
has increased by 27 million since 2012, and currently stands at 1.44 billion worldwide. Sub-
Saharan Africa and South Asia account for more than half of the world’s vulnerable employment,
with three out of four workers in these regions in vulnerable employment.
Likewise, progress in reducing working poverty has slowed. At the end of this decade, still one out
of 14 workers is expected to live in extreme poverty conditions.
Income inequalities have widened, delaying global economic
and job recovery
On average, in the countries for which data are available, the richest 10 per cent earn 30–40 per
cent of total income. By contrast, the poorest 10 per cent earn around 2 per cent of total income.
In several advanced economies, where inequalities historically have been much lower than in
developing countries, income inequalities have worsened rapidly in the aftermath of the crisis and
in some instances are approaching levels observed in some emerging economies. In emerging and
developing economies, where overall inequalities have typically fallen, levels remain high and the
pace of improvement has slowed considerably.
Underpinning some of these developments is the decline in medium-skilled routine jobs in recent
years. This has occurred in parallel to rising demand for jobs at both the lower and upper ends of the
skills ladder. As a result, relatively educated workers that used to undertake these ­medium-skilled
jobs are now increasingly forced to compete for lower-skilled occupations. These occupational
changes have shaped employment patterns and have also contributed to the widening of income
inequality recorded over the past two decades.
Rising inequalities have also undermined trust in government, with a few exceptions. Confidence in
government has been declining particularly rapidly in countries in the Middle East and North Africa
region, but also in the advanced economies, East Asia and Latin America.
Falls of such magnitude, in particular if they accompany stagnant or declining incomes, can
contribute to social unrest. The report estimates that social unrest has gradually increased as
joblessness persists. Social unrest tended to decline before the global crisis and has increased
since then. Countries facing high or rapidly rising youth unemployment are especially vulnerable
to social unrest.
The employment and social outlook can be boosted
This turbulent picture can be changed provided that the main underlying weaknesses are tackled.
As highlighted in previous ILO analyses, aggregate demand and enterprise investment need to be
bolstered, including through well-designed employment, incomes, enterprise and social policies.
Credit systems should be reoriented to support the real economy, notably small enterprises. The
weakness in the euro area needs to be addressed with conviction. And mounting inequalities must
be addressed through carefully designed labour market and tax policy.
There is also scope for addressing the persistent social vulnerabilities associated with a fragile job
recovery, notably high youth unemployment, long-term unemployment and labour market exit,
particularly among women. This means carrying out inclusive labour market reforms so as to
support participation, promote job quality and update skills.
ContentsContents
11
ContentsContents
151. Global employment and social developments
Introduction
Six years after the start of the financial and economic crisis, the global economy has entered a phase
of tepid economic growth (see figure 1.1). Global economic growth remains significantly below pre-
crisis trends and is too slow to close output and employment gaps that opened due to the crisis. The
slowdown in economic activity is especially pronounced in Central and South-Eastern Europe and
the CIS, East Asia, South-East Asia and the Pacific, Latin America and the Caribbean and North
Africa. Economic growth has accelerated somewhat in some advanced economies and in South Asia,
Middle East and Sub-Saharan Africa – but not enough to offset the slowing of activity in other regions.
These trends have intensified existing vulnerabilities, while complicating the task of bringing un-
employment and underemployment even back to pre-crisis levels in most countries. According to
IMF projections, global economic growth will accelerate slightly over the coming two years thanks in
part to lower oil prices and improved financial conditions in some advanced economies. But even if
these projections materialize, it is unlikely, based on current policies, that the existing employment
and social gaps will be closed significantly. So far, the current stage of global recovery is supported
by accelerating growth in a few Developed Economies, South Asia and Sub-Saharan Africa, but
it remains fragile due to continued lack of aggregate demand as well as structural vulnerabilities
related to geopolitical risks, disorderly adjustment of financial markets, continued stagnation in the
euro area, mounting inequality and slowing labour force growth.
This report assesses the employment and social impacts of the recent global slowdown and
examines longer term socio-economic consequences associated with the prolonged period of
economic turbulence that started in 2008. In this chapter, key labour market and social trends are
reviewed and projections for the next five years presented. Regional developments show marked
differences as regards to the impact of the crisis and their implications for sustained employment
growth (Chapter 2). The recent slowdown is also compounding longer-term trends and vulnerabil-
ities – such as population ageing and changing occupational patterns and skill needs. Chapter 3
takes a closer look at these interactions.
Note: The figure shows global economic growth (solid line) as well as the contributions of different demand components to global economic growth. The decom-
position is based on data from 120 countries. Effects from external balance result from less than full country coverage.
Source: Economist Intelligence Unit (EIU), November 2014.
–3.0
–1.5
0
1.5
3.0
4.5
Percent
2005 2006 2007 2008 2009 2010 2011 2012 2013 2014
Private consumption
Government consumption
Gross fixed investment
External balance
% change in real GDP
3.6
4.1
3.9
1.4
–2.1
4.1
2.8
2.2 2.3
2.5
1.1
Figure
Global growth and its components (per cent per annum)
global employment
and social developments
ContentsContents
16 World Employment and Social Outlook – Trends 2015
A. Labour market trends
Over 61 million jobs are needed to close the crisis-related jobs gap…
The global economy has failed to recover the output levels of pre-crisis trends and employment
creation is still not sufficient to close the jobs gap that opened up with the crisis. Indeed, there
were more than 61 million fewer jobs in 2014 than would have been expected had the crisis not
struck (figure 1.2). This shortfall in jobs is also reflected in lower labour force participation rates,
as many people have dropped out of the labour market, although the drop in participation rate has
stabilized recently.
Global employment grew at an average annual rate of 1.7 per cent between 1991 and 2007.
However, since the outbreak of the crisis, employment growth has slowed to 1.2 per cent per annum
between 2007 and 2014. On current trends, unemployment will continue to rise as the labour force
expands. Going forward, job creation is expected to remain at this lower growth rate over the medium
term, causing a widening of the global jobs gap to around 82 million jobs in 2019. If new labour
market entrants are taken into account, 280 million jobs will need to be created over the coming
five years to close the crisis-related global jobs gap and to absorb the increase in the labour force.
… and the total number of jobseekers is 201 million today,
over 1 million more than a year ago…
Global unemployment stood at 201.3 million in 2014, with 1.2 million additional unemployed com-
pared with the previous year and about 31 million more compared with 2007 (see figure 1.3,
panel A; Box 1.1 discusses changes in unemployment projections with respect to those published in
ILO, 2014a). In 2014, close to 5.9 per cent of the labour force was without a job, with wide variations
across countries (see table 1.1). In particular countries in North Africa and Sub-Saharan Africa and
the Middle East continue to suffer from high unemployment rates, in some cases up to 30 per cent
of the labour force (see figure 1.3, panel B). Southern European countries have also not yet experi-
enced significant declines in their unemployment rates, despite a modest pick-up in job creation
observed in recent months. On the other hand, Asian countries – in particular in South-East Asia
and the Pacific – experience relatively low unemployment rates, but often at the cost of high informal
employment rates, which can in some countries reach nearly 85 per cent of total employment (see
ILO, 2012). Among the developed economies, unemployment fell significantly in the United Kingdom
and the United States with other countries in the European Union experiencing smaller decreases.
In Latin America and the Caribbean, several countries are facing growing unemployment, as the
slowing global economy has started to bring down previously high job-creation rates.
Note: The figure shows the evolution of global employment and its current forecasts until 2019 (solid and orange line) in comparison with employment growth as
expected prior to the crisis in 2008 (green dashed line).
Source: ILO, Trends Econometric Models, October 2014.
2500
2750
3000
3250
3500
Globalemployment(millions)
2001 2002 2003 2004 2005 2006 2007 2008 2009 2010 2011 2012 2013 2014 2015 2016 2017 2018 2019
Pre-crisis trend Estimated/Forecast
61 million
80 million
1.2
Figure
Global jobs gap, 2014–19
ContentsContents
171. Global employment and social developments
Unemployment rates are expected to decline gradually in developed economies, particularly in
the EU (see table 1.1). For example, countries in southern Europe that still suffer from very high
unemployment rates are likely to see at least some improvements. In contrast, some emerging
G20 countries are expected to experience a slight uptick as more and more workers move from
rural areas (where typically very low unemployment rates prevail) to urban areas. In East Asia in
particular, the unemployment rate is expected to creep up to about 5 per cent by 2017, half a
percentage point higher than in 2013. At the global level, rates are expected to remain constant
over the next two years, reflecting that most other emerging regions outside the G20 will ex-
perience stable unemployment rates. There will be no relief among countries in the Middle East
and North Africa, which continue to be affected by the highest unemployment rates worldwide.
Sub-Saharan Africa – despite its relatively good growth performance and despite its recovery being
less affected by the difficulties of the global economy – will not experience a significant decline in
its unemployment rate.
Note: Panel A presents global estimates and projections for unemployment for 2014–19. Global unemployment estimates are based on a sample of 178 countries.
Panel B shows estimated unemployment rates (in per cent of the labour force) for individual countries for 2014 (no estimates available for countries shaded
in white). Darker colours indicate higher unemployment rates.
Source: ILO, Trends Econometric Models, October 2014.
198
202
206
210
214
Panel B. Cross-country variations in unemployment rates (percentages)
Panel A. Global unemployment developments
0 3 4 5 6 7 8 10 12 17 28
Unemployment(thousands)
2014 2015 2016 2017 2018 2019
194
1.3
Figure
Global unemployment, 2014–19
ContentsContents
18 World Employment and Social Outlook – Trends 2015
Changes to unemployment projections
Unemployment projections and near-term estimates are
subject to regular revisions and updates. These revisions
and updates partly reflect the changing economic circum-
stances, which can alter economic growth projections –in
some cases to a significant extent.* The availability of
new data and labour market information can also lead to
major updates and revisions in the projections.
Revisions and updates have also been released since the
start of the global crisis, though not as many as could
have been expected, given the turbulent economic situ-
ation (figure 1.4). Large variations between projected and
actual unemployment rates have been observed during
2009 and 2010 – on average, the forecasts were too opti-
mistic. In developed economies, these forecast errors have
been particularly large, with more than 75 per cent of un-
employment rates – more than 1 percentage point – below
realized values for both years. After 2010, the differences
between projected and actual unemployment are signifi-
cantly reduced. For example, for 2013 the forecasts were
too pessimistic, but only by a small margin.
*  See the Appendix for a technical discussion on forecasts and revisions to this year’s
unemployment projections.
1.1
Box
0
–3.0
–1.5
1.5
3.0
4.5
Panel A. Globally
ToooptimisticToopessimistic
2007 2008 2009 2010 2011 2012 2013
0
–3.0
–1.5
1.5
3.0
6.0
4.5
Panel B. Developed economies
ToooptimisticToopessimistic
2007 2008 2009 2010 2011 2012 2013
1.4
Figure
Differences between projected and observed unemployment, 2007–13 (percentage points)
Note: The charts show surprises in unemployment projections for all 178 countries (panel A) and for developed economies only (panel B) between 2007 and
2013. Unemployment surprises are measured as the difference between actual and projected unemployment rates in percentage points. Positive values indicate
too optimistic unemployment forecasts, negative values too pessimistic unemployment forecasts. The box-whisker representations indicate the range in which
75 per cent of the surprises fall as well as the 50 per cent of the surprises (within the box).
Source: ILO, Trends Econometric Models, 2007–14.
ContentsContents
191. Global employment and social developments
… and depressing participation rates
Labour force participation rates have been falling over recent decades but stabilized at the global
level at about 63.5 per cent in 2013. Nevertheless, the labour force participation rate is still 0.7 per-
centage points lower than in 2007, reflecting a loss of more than 37 million potential workers from
the global labour force. Moreover, long-run trends point to further declines, with participation rates
falling significantly below 63 per cent of the global working-age population by 2030 (see box 1.2).
Such decreased labour force participation lowers the potential growth of affected economies (see
Chapter 3).
Falling participation rates are a reflection of both changing demographics and discouragement
effects due to the persistence of the crisis. In Developed Economies and the EU, falling participation
rates among young people are related to the continued weak prospects for young people to find
jobs. Some of these trends are likely to reverse should faster growth be achieved in the medium
term. On the other hand, in emerging economies, especially in South Asia, participation rates
have been falling as a result of increasing education and reduced female participation rates due to
income effects. These trends are likely to be longer lasting.
Unemployment developments, 2007–17 (percentages)
Country/region 2007 2013 2014 2015 2016 2017
World 5.5 6.0 5.9 5.9 5.9 5.9
G20 Economies 5.0 5.7 5.6 5.6 5.6 5.6
G20 Advanced Economies 5.7 8.4 7.7 7.4 7.2 7.0
G20 Emerging Economies 4.8 4.9 5.0 5.1 5.1 5.2
Developed Economies and the European Union             5.8 8.5 7.8 7.5 7.3 7.1
Australia 4.4 5.7 6.0 5.9 5.7 5.6
Canada 6.0 7.1 6.9 6.7 6.6 6.6
Japan 3.9 4.0 3.7 3.6 3.6 3.7
United States 4.7 7.4 6.2 5.9 5.5 5.2
European Union 7.2 10.9 10.2 9.9 9.7 9.5
France 8.0 10.4 9.9 10.0 10.0 9.9
Germany 8.6 5.3 5.0 4.7 4.9 5.0
Italy 6.1 12.2 12.5 12.6 12.5 12.3
United Kingdom 5.4 7.5 6.3 5.9 5.7 5.5
Central and South-Eastern Europe and CIS 8.2 7.8 7.7 7.8 7.8 7.8
Russian Federation 6.0 5.5 5.1 5.3 5.4 5.4
Turkey 10.3 9.7 9.2 9.2 8.9 9.0
Middle East 10.2 10.9 11.0 11.0 10.9 10.8
North Africa 11.4 12.4 12.5 12.5 12.5 12.5
Sub-Saharan Africa 7.8 7.7 7.7 7.7 7.7 7.7
South Africa 22.3 24.6 25.1 25.0 24.9 24.8
Latin America and the Caribbean 6.9 6.3 6.6 6.8 6.9 6.8
Brazil 8.1 6.5 6.8 7.1 7.3 7.3
Mexico 3.4 4.9 4.9 4.8 4.5 4.3
East Asia 3.8 4.5 4.6 4.8 4.9 4.9
Republic of Korea 3.2 3.1 3.5 3.5 3.5 3.5
South-East Asia and the Pacific 5.5 4.3 4.3 4.3 4.2 4.2
Indonesia 9.1 6.2 6.2 6.1 5.9 5.8
South Asia 4.0 3.9 3.9 3.9 4.0 4.0
Note: The table shows unemployment rate estimates and projections at the global and regional levels as well as for selected G20 countries.
Source: ILO, Trends Econometric Models, October 2014.
1.1
Table
ContentsContents
20 World Employment and Social Outlook – Trends 2015
Medium-term prospects for the global labour market
Global participation rates
The global labour force participation rate has stabilized
somewhat after a sudden and significant fall following
the onset of the crisis (figure 1.5). In some countries and
regions the prolonged depression on the labour market
has increased the number of discouraged workers
and – in some cases – permanently reduced the labour
force participation rate. In this regard, the current stabil-
ization of the labour force participation rates suggests
that this dynamic has slowed down at the global level.
The increases in the participation rate are mainly linked
to rising male participation, as men are currently making
up some lost ground relative to pre-crisis levels. As a
consequence, global labour force growth is expected to
pick up slightly, to around 1.4 per cent in 2014, before
resuming its downward trend. Although small, this accel-
eration in labour force growth will put further pressure
on global labour markets as employment growth is not
expected to accelerate to the same extent. In particular,
it will continue putting downward pressure on wages
and incomes in an environment already characterized
by sluggish labour income growth.
Ageing populations
The ageing of the population in many countries will cause
the growth of the global labour force to decelerate, unless
it is offset through immigration. Several larger advanced
economies are already experiencing a fall in their labour
force. This decline in population dynamics will have long
lasting implications for global growth, as a reduction in
any factor of production with normally slow growth if all
else remains unchanged. In particular, slower population
growth can affect economic activity through two main
channels: lower investment growth and less job creation.
Both factors lower growth directly but will also weigh on
productivity growth (see also discussion below). On the
upside, reduced pressure on labour markets due to
slower growth in the labour force might help reverse the
trends of a falling wage share. So far, there have been
no signs of wage inflation, but individual countries might
experience labour shortages soon as population ageing
accelerates (see The Conference Board, 2014). These
can be welcome trends to the extent that they might help
to slow or reverse increases in inequality observed over
recent decades, which, in turn, can help support growth
accelerations, as indicated by the analysis in Chapter 3.
1.2
Box
Note: The figure shows the evolution of the global labour force participation rate and its current forecasts until 2030 (orange line) in comparison with employment
growth as expected prior to the crisis in 2008 (green line). Working-age population comprises people aged 15 years and above.
Source: ILO, Trends Econometric Models, October 2014.
65
62
63
67
Labourforceparticipationrate
(inpercentofworking-agepopulation)
1990 1994 1998 2002 2006 2010 2014p 2018p 2022p 2026p 2030p
Pre-crisis trend
Global labour force
participation rate
1.5
Figure
Global labour force participation rate: Projections vs trend, 1990–2030
ContentsContents
211. Global employment and social developments
Youth unemployment remains a concern globally…
Young people (aged 15–24) continue to be disproportionately hit by the crisis. The youth un-
employment rate reached 13.0 per cent in 2014, which is almost three times higher than the
unemployment rate for adults. Although new youth cohorts entering the labour market are smaller
than their previous counterparts – especially in certain regions, such as East Asia and Latin
America – it remains difficult for young people to find jobs in most countries.
These trends persist despite considerable improvements in average educational attainment of
youth cohorts. The share of youth in the labour force with tertiary education has increased since
2007 in 26 out of 30 countries for which data are available. Nonetheless, unemployment rates
among young workers with tertiary education have also risen since the onset of the crisis in 16 out
of 18 countries (ILO, 2013a).
Many countries are projected to see a substantial increase in youth unemployment, in particular
those in which youth unemployment rates are currently below the global average. The global youth
unemployment rate is expected to increase to 13.1 per cent in 2015 and then remain unchanged
through 2018. The largest increases in 2015 will be observed in East Asia and the Middle East,
with an expected further increase over the following years (see figure 1.6).
In contrast, older persons have fared relatively well during the crisis and their employment rates
have remained stable, even in those countries that have been hit hard. Unlike previous downturns,
when older workers often were pushed into early retirement, enterprises this time around decided to
hold on to their most experienced workers. However, there is evidence that for those older workers
who did lose their jobs, it is increasingly difficult to obtain new employment (Mayer, 2014).
… while gender gaps in the labour market persist
The beginning of the crisis saw a moderate closing of the gender unemployment gap, mainly because
job losses were concentrated in male-dominated industries. However, the subsequent recovery in
employment also mostly occurred in sectors where predominantly men are employed (e.g. construc-
tion), reopening the gender gap. Overall, women continue to suffer from higher rates of unemployment
and lower rates of employment, are less likely to participate in the labour force and face higher risks
of vulnerable employment, i.e. being self-employed or a contributing family worker (see figure 1.7).
In addition to the discrimination suffered by women, these gender gaps also represent a substantial
loss in income and economic development. For those countries and regions with the largest gaps,
income losses of up to 30 per cent of GDP per capita are incurred in comparison to a situation where
gender gaps in employment and participation would be lowered to the world average (ILO, 2014a).
Note: The chart shows the projected change in the youth unemployment rates between 2014 and 2019 (in percentage points) for individual countries (no estimates
available for countries shaded in white). Darker colours indicate worsening of youth unemployment rates.
Source: ILO, Trends Econometric Models, October 2014.
−17 −3 −1 −0.5 −0.2 0 0.5 1 2 8
1.6
Figure
Change in youth unemployment, 2019 vs 2014 (percentage points)
ContentsContents
22 World Employment and Social Outlook – Trends 2015
Note: The charts show differences in unemployment, employment, labour force participation and vulnerable employment rates between men and women in the world
and by region for 2014 and 2019.
Source: ILO, Trends Econometric Models, October 2014.
2
4
6
8
10
12
–2
14
Percentagepoints
Middle East North Africa Latin America
and the
Caribbean
Sub-Saharan
Africa
South Asia WORLD South-East
Asia and
the Pacific
Developed
Economies
and European
Union
East AsiaCentral and
South-Eastern
Europe (non-EU)
and CIS
Panel A. Unemployment gap
–45
–30
–15
–60
Percentagepoints
Panel B. Employment gap
Percentagepoints
Sub-Saharan
Africa
Developed
Economies
and European
Union
East Asia Central and
South-Eastern
Europe (non-EU)
and CIS
South-East
Asia and
the Pacific
Latin America
and the
Caribbean
WORLD South Asia Middle EastNorth Africa
Panel C. Labour force participation gap
4
8
12
16
20
–4
24
Percentagepoints
North Africa South-East
Asia and
the Pacific
Sub-Saharan
Africa
South Asia Middle East East Asia WORLD Latin America
and the
Caribbean
Developed
Economies
and European
Union
Central and
South-Eastern
Europe (non-EU)
and CIS
Panel D. Vulnerable employment gap
Sub-Saharan
Africa
East Asia Developed
Economies
and European
Union
Central and
South-Eastern
Europe (non-EU)
and CIS
South-East
Asia and
the Pacific
WORLD Latin America
and the
Caribbean
North Africa Middle EastSouth Asia
–45
–30
–15
–60
0
0
0
0
2014 2019
2014 2019
2014 2019
2014 2019
1.7
Figure
Gender gaps in the labour market, 2014 vs 2019
ContentsContents
231. Global employment and social developments
Job creation in the coming years will be mainly in the service sector…
The bulk of new jobs are being created in private sector services, which will employ more than
a third of the global workforce over the next five years (see figure 1.8). Public services in health
care, education and administration will also see smaller increases, still reaching more than 12 per
cent of total employment. In contrast, industrial employment is expected to stabilize globally at
slightly below 22 per cent of total employment, mainly driven by a continuous rise in employment
in construction whereas manufacturing industries continue to lose jobs. The advanced economies
still account for the largest share of manufacturing jobs across the globe, but current trends will
bring their employment share to below 12 per cent by the end of 2019. Some emerging coun-
tries have also seen a fall in their share of manufacturing employment, despite the fact that their
manufacturing industries have not yet reached levels similar to those in advanced economies. In
general, industrial employment is not likely to contribute strongly to employment recovery, despite
its important role in structural transformation particularly in the emerging economies. Rather, ser-
vice sector employment will remain the most dynamic area of job creation over the next five years.
… with growing incidence of high-skilled occupations
Low-skilled occupations and non-routine manual jobs still make up more than 45 per cent of total
employment worldwide (see figure 1.9, panel A), with medium-skill routine jobs accounting for a
share of around 37 per cent.1
At the same time, high-skilled non-routine cognitive jobs have been
increasing steadily, making up more than 18 per cent of total employment. These trends are set
to continue, although with significant regional variations (see figure 1.9, panel B). Medium-skill
jobs are declining in advanced economies, partly replaced by low-skilled occupations, while they
remain stable as a share of the global economy. The share of high-skilled occupations varies
widely, ranging from less than 10 per cent in Sub-Saharan Africa to almost 40 per cent in devel-
oped economies. The decline of medium-skilled jobs in advanced economies may be one factor
contributing to rising inequality in developed economies, the so called “­hollowing-out” of middle
income jobs. Chapter 3 discusses in more detail the consequences of these shifts in occupational
and sectoral employment patterns.
1
  The distinction of occupations into non-routine manual, non-routine cognitive and routine occupations follows the classification introduced
by Autor et al. (2003) and Jaimovich and Siu (2012) to designate occupations that are easily substituted by capital through the process of
computerization and robotization.
Note: p: projection. The figure shows annual employment growth for selected sectors in 2013 and projected annual employment growth for 2019.
Source: ILO, Trends Econometric Models, October 2014.
1
2
3
–1
4
Percent
Agriculture,
forestry,
hunting
and fishing
Manufacturing Construction Real estate,
business and
administrative
activities
Public administration
and defence;
compulsory
social security
Health and
social work
activities
Education
2014–2019p2010–2013
0
1.8
Figure
Sectoral employment growth, selected sectors (percentages)
ContentsContents
24 World Employment and Social Outlook – Trends 2015
Note: p: projections. Panel A shows trends since 2000 of occupational employment shares at the global level, as well as projections until 2019. Panel B shows
the change (in percentage points) in the occupational employment share by type of occupation over the period 2000–13 at the global level and by region (in
percentage points)
Source: ILO, Trends Econometric Models, October 2014.
28
36
44
12
20
52
Percentoftotalemployment
Panel A
–3
3
–9
–6
6
Changesinemploymentshares
(percentagepoints)
Panel B
WORLD Developed
Economies
and European
Union
Central and
South-Eastern
Europe
(non-EU)
East Asia South-East
Asia and
the Pacific
South Asia Latin
America
and the
Caribbean
Middle East North Africa Sub-
Saharan
Africa
2000 2001 2002 2003 2004 2005 2006 2007 2008 2009 2010 2011 2012 2013 2014p 2015p 2016p 2017p 2018p 2019p
Non-routine cognitive occupations
Routine occupations
Routine occupations
Non-routine manual occupations
0
1.9
Figure
Development of employment by occupation
Wage growth has remained subdued…
Global wage growth has not recovered to pre-crisis rates and has slowed in the past year. In the
current environment, employment creation has not added pressure on employers to raise wages in
most countries. In a few countries, wages have declined rapidly (e.g. Greece, Spain and the United
Kingdom). Wage growth continued a longer-term trend of trailing behind productivity increases in
most advanced economies, except during 2009, allowing companies to recover losses in profit-
ability through lower wage increases.
The combination of slow employment and wage growth has contributed to a long-term decline in
the labour income share in most countries (see ILO, 2014b). This limits households’ disposable
income and thus subtracts from private aggregate demand, reinforcing the current cycle of slow
economic growth in many countries and potentially contributing to deflationary pressures, notably
in Europe and Japan.
ContentsContents
251. Global employment and social developments
… and productivity growth has also slowed in many countries
while investment rates have fallen
A trend observed over the past few decades is that the rate of output and productivity growth has
been decelerating, both in advanced economies and, more recently, in developing countries (see
figure 1.10, panel A). One of the factors that may have contributed to this slowdown recently is
slower labour market turnover, a reduction in the reallocation of jobs across firms and industries.2
The significant fall in job creation rates during the crisis and the still incomplete recovery might have
affected productivity growth, in particular when comparing to the pre-crisis period (see figure 1.10,
panel B). The higher elasticity of productivity growth with respect to labour market turnover after the
crisis indicates that the large fall in labour market turnover observed since 2009 can be associated
with a negative effect on productivity growth. In the past, job reallocation has been shown to play an
important role in the restructuring of the economy after a shock, helping to move resources to more
efficient uses (Davis and Haltiwanger, 2014). To the extent that job creation has not recovered, less
restructuring toward more productive employment is a consequence. In addition, the large shock
created by the crisis might have reduced the share of profitable (“efficient”) matches, leading to
excess (“inefficient”) restructuring because of the size of the crisis.3
On the other hand, as indicated
above, current technological shifts are leading to a stronger expansion of high-skilled occupations,
which typically stems from lower labour market turnover. In this respect, the observed fall in labour
market turnover might indicate that restructuring is on its way, but that it has not yet fully played
out in the productivity numbers as the impact of a larger skilled labour force is yet to materialize.
Hence, for the time being the adverse effects of slower labour market turnover dominate.
Furthermore, productivity growth has suffered significantly from the drop in investment that
occurred since the onset of the crisis, despite the recovery of profitability. Real investment growth
and job creation rates are tightly linked, as both expanding capacity and replacing existing machines
2
  Labour market turnover is measured as the sum of job creation and job destruction relative to the total labour force.
3
 See Teulings and Hartog (1998) for a theoretical presentation of that argument.
Wage and productivity growth (107 countries; annual average in per cent), selected periods
2000–08 2008–09 2009–13
Wage growth 2.3 1.9 2.0
Productivity growth 2.5 –0.6 2.6
Note: For a detailed list of countries covered by the aggregate figures and sources of differences in the estimates in comparison
with earlier publications (ILO, 2014b), please refer to Annex 4.
Source: ILO, Global Wage database; ILO Research Department, own calculations.
1.2
Table
Note: Panel A shows long-term economic growth averages for developing and developed economies between 1950 and 2014. Panel B shows the coefficient estimates of the
effect of labour market turnover on labour productivity growth in a panel estimation for 21 OECD countries between 1955 and 2014. Labour market turnover is defined as the
sum of unemployment outflows and inflows over the total labour force. Labour market turnover contributes significantly to productivity growth in the years after the crisis but
only very little during the pre-crisis years.
Source: ILO, KILM; OECD, Economic Outlook Database; Penn World Tables, 2014; own calculations.
2
3
4
5
6
0
7
Percent
1
2
3
4
5
6
–1
7
0
1
1950–60 1960–70 1970–80 1980–90 1990–2000 2000–10 2010–14
Developed economies
Developing economies
Total period After 2009 Before 2009
Panel A. Economic growth per capita (long-term averages, 1950–2014)
Panel B. Labour market turnover and its impact
on productivity growth (1955–2014)
1.10
Figure
Growth and the productivity impact of lower labour market turnover
ContentsContents
26 World Employment and Social Outlook – Trends 2015
with new ones open possibilities for new jobs. In addition to faltering aggregate demand and uncer-
tainty over future sources of demand growth, a recovery in private investment has also been held
back by limited availability of credit (particularly for small and medium enterprises, especially in
Europe), and increased uncertainty over cost of inputs (such as oil), the magnitude and direction
of price and exchange rate changes and other conditions which limit the capacity of employers to
identify new profitable areas of expansion of their output and workforce. The current slowdown in
investment is also likely to have longer-lasting adverse effects on both productivity and employment.
Future unemployment is also likely to be affected
by the turbulence of the crisis and slow recovery
Changes in future unemployment rates are affected by previous episodes of growth accelera-
tions and slowdowns, although the link is weaker in developing countries compared to developed
countries (see figure 1.11).4
In the former, growth is often sensitive to movements in commodity
prices that do not translate fully into changes in labour market performance. Economic growth
slowdowns have a larger impact on unemployment than growth accelerations. In other words,
growth slowdowns tend to be very harmful for unemployment, whereas growth accelerations reduce
unemployment to a more limited extent. The medium-term consequences of recent labour market
trends for economic growth are discussed in more detail in Chapter 3.
4
  This confirms findings on the Okun’s coefficient in recent literature (Ball et al., 2013).
Note: The chart shows the changes in the total (youth) unemployment rate over the seven years that follow a growth slowdown (panel A) or acceleration (panel B)
year. The size of the columns is based on a simple OLS panel regression that estimates the equation D7_UR = β0 + β1slw + β2acc, where slw and acc are dummy
variables that respectively mark growth slowdown and acceleration years. D7_UR is the change in the total (youth) unemployment rate over the seven years that
follow that year. The size of the estimated coefficient b1 (b2) is shown in panel A (B).
Source: ILO; own calculations.
4
6
2
8
Percentagepoints
Panel A. Growth slowdowns
–4
–2
–8
–6
Percentagepoints
Panel B. Growth accelerations
World Developed countries
Change in total unemployment rate
Developing countries World Developed countries Developing countries
Change in youth unemployment rate
Change in total unemployment rate Change in youth unemployment rate
0
0
World Developed countries Developing countries World Developed countries Developing countries
1.11
Figure
The impact of growth accelerations and slowdowns on changes in unemployment
ContentsContents
271. Global employment and social developments
B. Social developments and trends
Vulnerable employment is falling slightly…
Vulnerable employment – the share of own-account work and contributing family employment,
categories of work typically subject to high levels of precariousness – has continued a modest
decline in most regions, with more significant progress in Asian regions and the Middle East
(see figure 1.12). Nevertheless, almost half of the world’s employed population are still working
in vulnerable conditions, pre-dominantly women, and are thus prevented from accessing basic
necessities and decent work. South Asia and Sub-Saharan Africa account for most of the vulner-
able employment globally – for both, it stood at over 75 per cent in 2013 (projected to decline only
slightly by 2019). East Asia is the region that is likely to continue to make the most progress in
reducing vulnerable employment, from 49.5 per cent in 2007 to 38.1 per cent in 2019.
Source: ILO, Trends Econometric Models, October 2014.
60
0
30
90
WORLDDeveloped
Economies
and European
Union
Central
and South-
Eastern
Europe
(non-EU)
and CIS
East Asia South-East
Asia and
the Pacific
South AsiaLatin
America
and the
Caribbean
Middle East North Africa Sub-Saharan
Africa
J
J
J
J
J
J
J
J
J J2007 2013 2019p
K
K
K
K
K
K
K
K
K K
Percent
1.12
Figure
Vulnerable employment as a share of total employment
in developing economies, 2007–19 (percentages)
… while the middle class continues to grow
in developing countries and regions…
This reduction in vulnerable employment has been one important factor in lifting more workers
and households out of poverty and into middle-class status (see figure 1.13). In emerging and
developing countries, the middle class now makes up more than 34 per cent of total employment.
Another 12 per cent of all employees have reached an upper-middle income status in these coun-
tries, benefiting from similar consumption baskets as middle-class workers in advanced economies.
Despite the moderation in global growth, this reduction in working poverty is expected to continue
over the medium term, although at slower rates, further boosting the size of the global middle class.
Despite the rising number of employees in the middle class or the upper-middle class in developing
countries, their share still remains too limited to significantly boost global aggregate demand and
demand for many of the tradable goods produced in advanced economies.
ContentsContents
28 World Employment and Social Outlook – Trends 2015
Note: For panel A, index: 2000=100. Data were restricted to G7 countries as the only country group for which continuous before and after-tax Gini coefficients
were available. For panel B, unweighted averages across countries for 2011 or latest available year were used for the regional averages.
Source: ILO Research Department calculations based on the OECD and World Bank Poverty Database.
103
105
101
107
Panel A. Evolution of the average Gini coefficient in G7 economies, 2000–11
20
30
10
Panel B. Income share distribution: Richest 10 per cent vs poorest 10 per cent by region, 2011 or latest available year
40
99
Central and
South-Eastern
Europe and CIS
Middle East
and
North Africa
East Asia,
South East Asia
and the Pacific
South AsiaDeveloped
Economies
Latin America
and the Caribbean
2000 2001 2002 2003 2004 2005 2006 2007 2008 2009 2010 2011
Gini (before taxes and transfers)
Gini (disposable income)
K K KK KK
K
Income share held by highest 10 per cent
Income share held by lowest 10 per cent
Sub-Saharan
Africa
0
1.14
Figure
Income inequality in advanced and developing economies and regions
Note: The chart shows employment shares by economic class for developing countries, including forecasts up to 2019. Economic classes are defined by per capita
per day consumption levels in US$ 2005 PPP. A consumption level above US$13 per capita per day is equivalent to advanced economies’ middle-class status.
Source: Kapsos and Bourmpoula, 2013; ILO, Trends Econometric Models, October 2014.
50
75
0
25
100
1991 1993 1995 1997 1999 2001 2003 2005 2007 2009 2011 2013 2015p 2017p 2019p
Extremely poor (less than US$1.25, PPP)
Moderately poor (between US$1.25 and US$2, PPP)
Near poor (between US$2 and US$4, PPP)
Developing middle class (between US$4 and US$13, PPP)
Developed middle class and above (above US$13, PPP)
1.13
Figure
Employment by economic class in developing countries, 1991–2019
ContentsContents
291. Global employment and social developments
… but income inequality is on the rise…
Despite reductions in working poverty and vulnerable employment in the developing world,
income inequality continued to deepen in most developed and developing countries. In several
advanced economies, where inequalities historically have been much lower than in developing
countries, income inequalities have worsened rapidly in the aftermath of the crisis (see figure 1.14,
panel A). Indeed, several advanced economies are seeing income inequality levels approaching
those observed in many emerging economies, whereas some of the latter have made progress in
reducing their high levels of inequalities. Along with the fall in the labour income share described
above, personal income inequality has also worsened further. Importantly, both market income
inequality and disposable income inequality (after taxes and transfers) have increased over the
past decade. As market income inequality increases, the burden placed on tax and transfer
systems becomes larger. Even advanced economies with relatively ambitious tax and transfer
policies have failed in some cases to limit the rise in income inequalities.
In the advanced economies almost 25 per cent of total income went to the richest 10 per cent in
society in 2011 (see figure 1.14, panel B). As larger shares of labour income went to top earners,
investment and job creation did not increase, as the incomes of the middle and lower deciles stag-
nated or declined in most countries and aggregate demand suffered. As Chapter 3 demonstrates,
this rise in income inequality can be linked to long-term stagnation in growth rates in advanced
economies and a lower incidence of growth spurts among developing countries, reducing the
potential for catch-up.
… undermining trust in government and fuelling the risk of social unrest
Rising inequalities have undermined trust in government, with a few exceptions (see figure 1.15).
Confidence in government has been declining particularly rapidly in countries in the Middle East
and North Africa region, but also in the advanced economies, East Asia and Latin America. Falls
of such magnitude, in particular if they accompany stagnant or declining incomes, can contribute
to social unrest, as several countries in the Middle East have demonstrated, with knock-on effects
on social conditions, growth and employment dynamics.
Social unrest at the global level declined during the 1990s and 2000s – in line with the global
unemployment rate – up to the crisis in 2009, when it shot up and is now almost 10 per cent
higher than before the crisis (see figure 1.16). The situation is most pronounced in the Middle East
and North Africa, but has also been increasing in non-EU Central and Eastern Europe and CIS
countries, and to a lesser degree in South Asia.
Note: The question that was asked to the survey respondents: “In this country, do you have confidence in your national government?” The chart shows the
percentage of respondents that said they do have confidence in their national government.
Source: ILO calculations based on Gallup World Poll data, 2014.
–4.5
4.5
–9.0
9.0
Central and
South-Eastern
Europe and CIS
Middle East
and North Africa
East Asia,
South East Asia
and the Pacific
South Asia Developed
Economies
Latin America
and the Caribbean
Sub-Saharan
Africa
–13.5
Percent
0
1.15
Figure
Confidence in government, 2012 vs 2013 (percentages)
ContentsContents
30 World Employment and Social Outlook – Trends 2015
Notes: Panel A: The chart shows the level of social unrest at the global and regional level; higher values of the demeaned level of social unrest divided by
its standard deviation are marked in red, lower values in green. Social unrest is calculated as the number of protests as a percentage of the total number of
events. Global (WORLD) and regional aggregates for DEV = Developed Economies and European Union; CEES = Central and Eastern Europe (non-EU) and CIS;
EA = East Asia; SEAP = South-East Asia and the Pacific; SA = South Asia; LAC = Latin America and the Caribbean; MENA = Middle East and North Africa;
SSA = Sub-Saharan Africa.
Panel B: The chart shows the level of social unrest across the world depending on the level of male youth unemployment. Low, medium and high levels of male
youth unemployment are being identified by terciles of male youth unemployment across countries over the period 1991 to 2013.
Source: BBVA, 2014; GDELT Event database (http://gdeltproject.org/); ILO, Trends Econometric Models, October 2014; own calculations.
0.8
0.4
1.2
0
Socialunrest
Low Medium High
Panel B. Male youth unemployment
and unrest, 1991–2013Panel A. Social unrest across the world
CEES
SSA
DEV
EA
LAC
MENA
SA
SEAP
WORLD
1979 1984 1989 1994 1999 2004 2009 2014
Average level
of youth unemployment
−2
0
2
4
1.16
Figure
Social unrest and youth unemployment
Social unrest is particularly acute in countries and regions were male youth unemployment is high
or rising rapidly whereas no such relationship exists when looking at female youth unemployment
(see figure 1.16, panel B). Young people are often the most demonstrative about their economic
and social situation and problems such as inequality, low wages and high joblessness. Indeed,
social unrest is particularly high in those countries where youth unemployment is widespread
or has been increasing quickly. These tendencies are compounded in countries where edu-
cated young people cannot find satisfactory employment opportunities – as is the case in many
Middle Eastern and North African countries. Similar developments have been observed recently
in European countries where youth unemployment shot up to very high levels with the onset of
the crisis. Given the current global economic and social trends, these developments are unlikely
to reverse quickly as governments find it difficult to mobilize economic resources to address the
sources of social discontent.
ContentsContents
311. Global employment and social developments
Projection differences, 2013 vs 2014
  2008 2009 2010 2011 2012 2013 2014 2015 2016 2017 2018 2019
Unemployment (millions)
Oct. 2013 177.0 197.9 195.2 193.9 196.9 201.8 206.0 208.8 211.0 213.1 215.2
Oct. 2014 178.6 199.0 196.6 195.4 197.4 200.1 201.3 204.4 206.7 208.8 210.8 212.3
Unemployment rate (per cent)
Oct. 2013 5.6 6.2 6.1 6.0 6.0 6.0 6.1 6.1 6.1 6.1 6.0  
Oct. 2014 5.7 6.3 6.1 6.0 6.0 6.0 5.9 5.9 5.9 5.9 5.9 5.9
Source: ILO Trends Econometric Models, October 2014 and October 2013; ILO Research Department calculations.
1.3
Table
Appendix
Changes to the estimates and projections, 2013 vs 2014
As in previous years, global and regional unemployment levels and rates have been revised to take
into account new information as well as revisions in economic growth projections.
Unemployment rate input data: Revisions in the historical unemployment data come either from
revisions made by their original sources or from the fact that sometimes data from national labour
force surveys are available with a substantial lag (oftentimes the lag can be up to one or two years,
or even more in some rare cases).
Overall, there were 120 new observations in Trends Econometric Models (TEM) October 2014
as compared with the TEM October 2013; 24 of these new data refer to the period 2009–12,
38 refer to 2013 and 58 refer to 2014. For example, there were four more observations for Guinea
(i.e. 2009–12), three more observations for Kyrgyzstan (i.e. 2011–13) and two more observations
for Suriname (i.e. 2009–10).
The year 2013 in the TEM October 2013 was a preliminary estimate for 61 countries for which
some quarters were available. In the most recent model run (TEM October 2014), all quarters
are available for 2013. Moreover, the estimates for nine countries (i.e. Algeria, Bahamas, Belize,
Guadeloupe, Libya, Martinique, Namibia, Saudi Arabia and West Bank and Gaza Strip) were revised
upwards by more than 1 percentage point as new data became available or in two cases (i.e. Saudi
Arabia and West Bank and Gaza Strip) old data were revised.
GDP growth rates: Between the IMF World Economic Outlook (WEO) October 2013 and the WEO
October 2014 updates, the estimate for global GDP growth rate in 2013 was revised upwards by
0.4 percentage points and for 2014 and 2015 it was revised downwards by 0.3 and 0.1 percentage
points, respectively. For all the years after 2015, the global GDP growth rate forecast was not
revised. These changes in the revisions of GDP lead to revisions in the estimated relationship
between unemployment rate and the GDP growth rates. However, based on the magnitude of the
above revisions the revisions of the updated projections of the unemployment rate are small.
In total, the baseline projection of the global unemployment rate was revised downwards by 0.2 per-
centage points for the period 2014–18 (see table 1.3). Some 23 and 13 per cent of the revision
in the global unemployment rate in 2012 and 2013, respectively, is caused by GDP growth rate
revisions and 77 per cent and 87 per cent of the revision is caused by the changes in the un-
employment input data. For 2014, the revision in the global unemployment rate was solely due to
data revision.
ContentsContents
22
ContentsContents
332. Regional developments: An uneven and uncertain recovery
Developed Economies and European Union
Revived economic growth in some developed economies
is being offset by another slowdown in Europe and Japan
Growth is expected to strengthen in several developed countries, namely Australia, Canada, New
Zealand and the United States. In the United States, on the heels of robust third-quarter growth in
2014, the International Monetary Fund (IMF) projects growth to reach over 3 per cent in 2015, the
highest value since 2006. This reflects the considerable improvement in economic fundamentals
during 2014, as energy prices fell, household debt contracted, the housing market improved and
firms began to invest again.
Spillover effects from the recovery in the United States are benefiting Canada’s exports and invest-
ments; as a result, its economy is expected to expand by 2.4 per cent in 2015.1
Positive exports and
a stronger construction sector are also boosting GDP growth in New Zealand, which, at 3.6 per cent
in 2014, remains the fastest-growing economy among developed countries. In contrast, Australian
output is increasingly driven by internal demand, offsetting the decline in the extractives sector,
which has been affected by falling commodity prices; it is projected to increase by nearly 3 per
cent in 2015.
In comparison, the European Union as a whole is growing only at a moderate pace (1.3 per cent in
the second quarter of 2014 among the EU-28), and is largely being driven by above-average output
growth in some eastern and northern EU countries outside the euro area.2
In the euro area, the
recovery remains fragile at best. The modest economic growth seen during the second half of 2013
and early 2014 is fading, with large euro-area countries driving the slowdown: in the second quarter
of 2014, output growth reached 1.3 per cent in Germany (down from 2.2 per cent in Q1 2014) and
0.1 per cent in France (down from 1 per cent in Q1 2014).
Difficulties in the euro area have been exacerbated by fiscal consolidation policies, which have
suppressed internal demand without, in most cases, counterbalancing increases in exports. So
far, wage moderation strategies, which have been at the core of policy-making in many euro-area
countries in the aftermath of the crisis, have had very limited effect in boosting competitiveness
and jobs (see box 2.1).
Growth in Japan is expected to have reached 0.9 per cent in 2014, down from 1.5 per cent in
2013. Stronger internal demand, including from government efforts to induce above-inflation wage
increases, and improved industrial confidence should help to offset the slowdown in exports, as
well as the negative impact of fiscal consolidation plans for 2015. However, public debt reduction
remains a priority in the medium and long term, while expansionary monetary policy should con-
tinue until inflation reaches the established target of 2 per cent.
1
  This outlook is likely to be negatively affected by the fall in oil prices that took place in 2014.
2
  Annual GDP growth in the second quarter of 2014 was over 3 per cent in the Czech Republic, Hungary, Lithuania, Poland and the United
Kingdom.
regional developments:
an uneven and
uncertain recovery
ContentsContents
34 World Employment and Social Outlook – Trends 2015
Joblessness is falling in developed economies,
but this is not yielding wage gains
Throughout 2014 unemployment rates continued their downward trend in most of the developed
countries, with the exception of Australia. Despite the fall in joblessness, however, wage growth
remained weak and wage increases continue to lag behind productivity growth (table 2.1). The
modest expected improvements in wage growth in the coming years will only gradually help to close
the current gap between wage growth and productivity growth (ILO, 2014b).
Besides the muted recovery in employment, the sluggish wage growth stems from a reduction in
the bargaining power of workers to negotiate stronger wage increases (see also box 2.1). Indeed,
when comparing wage curve estimates before and after the crisis, wage growth appears to react
less strongly to changes in the unemployment rate after 2009 (figure 2.1). This reflects not only
the relatively weaker bargaining position but also other factors triggered by the prolonged slump in
employment, including the fact many jobseekers have accepted temporary or part-time positions,
often at lower wages.
Competitiveness and wages in Europe
An early policy response to the crisis in Europe, par-
ticularly in the hard-hit southern European countries
which often turned to European and international insti-
tutions for support, was to reduce employment protec-
tion legislation, weaken or decentralize wage bargaining
and reduce minimum wages as a way to increase
competitiveness.
For instance, in Spain, real wages have contracted in
almost all sectors since 2011; positive wage growth has
been registered only in the extractive and electricity
industries and marginally in the arts and entertainment
sector. Wage contraction in Spain has been particularly
marked in the public sector: between 2011 and 2013,
real wages decreased by 4.2 per cent in health care,
2.7 per cent in education and 2.3 per cent in public
administration. Moreover, a number of key economic
sectors – including wholesale and retail trade, pro-
fessional and scientific activities, and transport and
storage – regis­tered average real wage reductions of
around 1.5 per cent. Wage contraction has been even
more pervasive in Greece, where nominal wages for the
entire economy fell, on average, by 5.6 per cent in 2011,
6.9 per cent in 2012 and 8 per cent in 2013.
Wage contraction has helped reduce some of the
cost competitive differentials within the euro area – as
exemplified by converging trends in unit labour cost.
However, this has not always translated into improved
external competitiveness (trade) and internal reallocation
towards more productive sectors. Instead, in some coun-
tries, exports have not yet picked up and are still con-
centrated in low-value-added sectors (Greece); while in
others where exports have recovered (Spain), the growth
of firms is currently challenged by weak internal demand,
tight credit conditions and strict product market regu-
lation. Indeed, evidence suggests that competitiveness
imbalances in the euro area are not simply related to cost
competitiveness gaps, but are connected with structural
weaknesses of the macroeconomic environment. This
includes ineffective economic governance, a weak busi-
ness environment, scarce investment in research and
development, underdeveloped public infrastructures and
low skills levels among the working-age population.
Source: ILO (2014c, 2014d); EC and ILO (2014).
2.1
Box
Economic and social developments in Developed Economies and EU, 2009–19 (percentages)
2009 2012 2013 2014 2015 2016 2017 2018 2019
Labour force participation rate 60.4 60.0 59.9 59.8 59.8 59.7 59.7 59.6 59.5
Unemployment rate (total) 8.4 8.6 8.5 7.8 7.5 7.3 7.1 6.9 6.8
Youth unemployment rate 17.4 18.0 17.7 16.7 16.3 15.8 15.5 15.2 15.0
Employment growth –2.2 0.5 0.4 1.2 0.6 0.5 0.5 0.4 0.4
Youth employment growth –7.5 –1.1 –0.2 0.9 0.1 0.1 0.0 –0.1 –0.1
Real wage growth 1.0 0.2 0.2 0.5 1.4 1.5 1.8 1.8 1.7
Productivity growth –1.5 0.8 0.8 0.6 1.6 1.8 1.8 1.7 1.7
Note: Regional wage and productivity growth includes estimates and projections for 29 out of 36 countries. For a detailed list of countries covered by the
aggregate figures and sources of differences in the estimates in comparison with earlier publications (ILO, 2014b), please refer to Annex 4.
Source: ILO, Trends Econometric Models, October 2014; ILO, Global Wage database, December 2014; ILO Research Department.
2.1
Table
ContentsContents
352. Regional developments: An uneven and uncertain recovery
Unemployment, especially among youth, remains a challenge in Europe
Reflecting the weak economic conditions in Europe, unemployment rates fell gradually throughout
2014. However, young Europeans continued to be confronted with exceptionally high unemployment
rates. In the EU-28, adults faced an unemployment rate of 9 per cent in the second quarter of
2014, whereas young people faced a jobless rate of 22 per cent (see figure 2.2). This translates into
a ratio of youth-to-adult unemployment rates close to 2.5 for EU-28. The ratio was close to 4 or even
higher in a number of countries, notably the United Kingdom (3.5), Italy (3.9) and Romania (4.4).
Conversely, some countries recorded a youth-to-adult unemployment rates ratio slightly lower
than 2, such as Austria, Germany and the Netherlands. At the same time, adult unemployment
rates also showed large inter-country differences. For instance, in the second quarter of 2014, adult
unemployment rates were lower than 5 per cent in Austria, the United Kingdom and Germany,
compared with around 25 per cent in Greece and Spain. In the same period, differences in youth
unemployment rates were even larger, ranging from around 8 per cent in Austria and Germany to
over 40 per cent in Italy and 52 per cent in Greece and Spain.
Note: The chart shows the time-varying coefficient, μt, of the elasticity of real wage growth with respect to changes in unemployment between
1994 and 2019, including forecast changes beyond 2014, for the Developed Economies and EU region. The shaded areas represent the
confidence interval. Estimates have been established using P-splines with the estimation equation:
wt
= w
i =1
4
wt i
+ u
+ µt( )
i = 0
4
ut i
+ t
where wt: (regional) real wage growth, Δut: change in the (regional) unemployment rate and βw
, βu
: the (constant) elasticities of real wage growth
with respect to past wage growth and changes in unemployment.
Source: ILO, Global Wage Database and Trends Econometric Models, October 2014.
2
0
4
–2
20001996 2005 2010 2015 2019
Coefficientestimate
2.1
Figure
Reaction of wages to changes in unemployment, 1994–2019
Note: The diagonal line represents a youth to adult unemployment ratio of 2:1.
Source: ILO Research Department based on Eurostat.
25
45
15
55
5
Age15–24
Age 25+
35
0 7 2114 28
J
J J
J
J
J
J
J
JJ
J
JJ
J
JJ
J
J
J
J
J
J
J
J
J
J
J
J
J
European Union
(28 countries)
Belgium
Bulgaria
Czech Republic
Denmark
Germany
Estonia
Ireland
Greece
Spain
France
Croatia
Italy
Cyprus
Latvia
Lithuania
Luxembourg
Hungary
Malta
Netherlands
Austria
Poland
Portugal
Romania
Slovenia
Slovakia
FinlandSweden
United Kingdom
2.2
Figure
Unemployment rates by age in the EU-28, Q2 2014 (percentages)
ContentsContents
36 World Employment and Social Outlook – Trends 2015
By sex, the EU-28 exhibited a slightly higher unemployment rate for female youth at 10.4 per
cent, compared to 10.2 per cent for males. This difference was most marked in countries such
as Croatia, Czech Republic and Greece, where the female unemployment rate could be nearly
1.5 times the male equivalent. Meanwhile, in countries such as Ireland, Latvia and Lithuania,
females had a lower unemployment rate than males, by as low as 0.7 times the male rate.
Policy responses to these challenges remain timid and there is merit in addressing this severe
labour market urgently. At the beginning of 2014, the European Commission launched a youth
guarantee scheme to tackle youth unemployment in Europe. In many cases, however, there have
been delays in its implementation. Moreover, funding remains inadequate, as only €3 billion of
fresh funds are being deployed over a three-year period, less than 0.05 per cent of European GDP.3
Additional resources to tackle the problem of youth unemployment are needed, including measures
to simplify funding procedures and accelerate programme implementation. Moreover, countries
need to bear in mind the lessons learned from other similar programmes, notably by ensuring
there is: (i) a good balance between active and passive policies, combined with personalized public
employment service; and (ii) greater availability of resources for public employment services, so
they are in a position to operationalize the youth guarantee scheme.
Long-term unemployment and discouragement exist alongside
increased risks of poverty and social exclusion
The persistence of weak economic and labour market conditions in many countries has caused
an unprecedented increase in the duration of unemployment. In the second quarter of 2014,
long-term unemployment4
in the EU-27 was at 50 per cent (table 2.1), up from 38.5 per cent in
the same quarter of 2008 and 47 per cent one year earlier. The highest shares were observed
in Greece (74.4 per cent), followed by Italy (62.7 per cent) and Portugal (62.4 per cent). In
contrast, long-term unemployment was lower than 20 per cent in countries such as Finland and
Sweden, which have a tradition of providing active labour market policies aimed at the long-term
unemployed.
High and increasing levels of long-term unemployment are of particular concern. First, as the
share of long-term unemployed increases, skills are being eroded and social exclusion rises,
which in turn further reduces the likelihood of the long-term unemployed re-entering the labour
market. Second, as the average duration of long-term unemployment spells is increasing in many
countries, a large share of the long-term unemployed is no longer covered by any kind of income
support or social protection. This has contributed to the observed rise in poverty and vulner­
ability across Europe in recent years (see table 2.2). In a number of countries undergoing fiscal
consolidation, notably Greece, this has been exacerbated by significant cuts to social spending,
which have constrained the coverage of the social protection system (see box 2.2). As a result,
16.6 per cent of the EU-27 population was at risk of poverty in 2013. Figures are even more
dramatic among the unemployed: the risk of poverty was close to 47 per cent among this group.
3
  http://europa.eu/rapid/press-release_MEMO-14-571_en.htm.
4
  The long-term unemployment rate is calculated as the share of individuals unemployed for one year or more out of total unemployed individuals.
Long-term unemployment and social indicators in the EU-27 (percentages)
  2008 Latest
Long-term unemployment 38.5 50.0
Population at risk of poverty 16.6 16.6
Unemployed at risk of poverty 44.8 46.6
At risk of poverty and social exclusion 23.8 24.4
Note: Figures here are restricted to EU-27 given that some of the data are limited to 2013. All labour market fig-
ures refer to the population aged 15 and above. Long-term unemployment refers to the share of those unemployed
for over one year out of total unemployed individuals. Figures for long-term unemployment refer to Q2 2008 and
Q2 2014. Latest figures for poverty rates refer to 2013.
Source: ILO Research Department based on Eurostat.
2.2
Table
ContentsContents
372. Regional developments: An uneven and uncertain recovery
If the broader indicator of risk of poverty and social exclusion is considered, more than 24 per
cent of the EU-27 population were attributed such status in 2013.5
The highest rates for risk of
poverty and social exclusion were observed in Bulgaria (48.1 per cent), Romania (40 per cent)
and Greece (35.7 per cent). In contrast, rates lower than 20 per cent were registered for Austria,
Denmark and the Netherlands.
Outside Europe, despite recently improved labour market conditions, discouragement has increased
as a reaction to the prolonged labour market slump.6
In the United States, discouraged persons are
estimated to have nearly doubled as a ratio of the labour force, from 0.3 per cent in 2008 to just
under 0.6 per cent in 2013. There was also an increase in Australia, from 0.5 per cent to 0.7 per
cent over the same period.7
In Japan, the discouragement rate initially increased, but by 2013 it
had returned to its pre-crisis level of 0.8 per cent. Discouragement is particularly concerning when
it affects youth (aged 15–24), when prolonged absence from the labour market can result in social
alienation and lasting damage to employment prospects. While youth unemployment levels are
typically lower in developed countries outside the EU, they remain elevated compared with the
adult rates. For instance, in 2013 youth were 2.6 times more likely to be unemployed than their
adult counterparts in the United States, 1.8 times in Japan, 2.3 times in Canada, and substantially
higher in New Zealand, at 3.6 times more likely. Part of the reason for this is that job creation rates
are failing to keep pace with population growth.
5
  This indicator corresponds to the sum of persons who are at risk of poverty or severely materially deprived or living in households with very low
work intensity. Material deprivation covers indicators relating to economic strain and durables. Severely materially deprived persons have living
conditions severely constrained by a lack of resources and they experience at least four out of the nine deprivation items considered by Eurostat.
6
  In some instances, the unemployment rate has fallen due to lower participation rates.
7
  OECD Employment Database, accessed on 6 November 2014.
The case of Greece
Between 2007 and 2009, social protection expenditure
grew by almost 8 per cent per year, mostly driven by
spending on sickness care and old-age care – which
increased by 27 per cent and 20 per cent, respectively,
over this period. In 2010 a number of changes to the
social protection system were introduced which focused
on reducing benefit amounts or adjusting eligibility
criteria. The result was steep cuts between 2010 and
2011 – notably, sickness- and old-age-related spending
was cut by 21 per cent and 17 per cent, respectively.
Major changes to the various benefits include the
following:
(i)	 Unemployment benefits: In 2012, the monthly un-
employment benefit was set at €360 for full-time
employees, down from the previous €454 per
month.1
The total number of days for which a worker
can claim unemployment benefit over a period of four
years was reduced to 450 from 1 January 2013 and
to 400 from 1 January 2014.2
(ii)	Pensions: Pension payments were reduced succes-
sively through various pieces of legislation during the
crisis and Law No. 3847/2010 abolished the 13th
and 14th monthly pension payments of former public
employees3
and replaced them with more restricted
vacation allowances, which were later abolished
in 2013.4
In November 2011, Act No. 4024/2011
reduced the monthly main pension exceeding €1,000
for public sector pensioners under 55 years of age by
40 per cent, and by 20 per cent for those aged 55
and above with pensions exceeding €1,200.
1
The amount is increased by 10 per cent for each dependent person, and the benefit period ranges from 5 months to 12 months, depending on days worked during the control period.
2
Law 3996/2011 and Law 4203/2013, respectively.  3
Invalidity pensions, social pensions and farmers’ basic pensions were exempted.  4
The 13th and 14th monthly instalments
of invalidity pensions, social pensions and farmers’ basic pensions were also abolished at this time.
Source: ILO (2014c).
2.2
Box
ContentsContents
38 World Employment and Social Outlook – Trends 2015
Central and South-Eastern Europe (non-EU) and the CIS
Political turmoil and falling energy prices
are leading to a growth slowdown
GDP growth was relatively robust following the onset of the crisis, averaging 4.2 per cent per
annum from 2009 to 2013 – benefitting in part from higher energy and commodity prices. This
was despite lower than expected domestic demand, which has remained subdued as a result of
significant weaknesses within the private sector, persistent high rates of unemployment, as well
as tight credit conditions of local banks (burdened by high levels of non-performing loans) for the
enterprise sector.8
This has contributed to the recent slowing in Central and South-Eastern Europe
and the CIS’s output growth since 2012, from 5.6 per cent in 2011 to 2.6 per cent in 2013.
Moreover, growth is expected to continue to decline in 2015 due to falling oil prices, leading to an
economic slowdown in the Russian Federation. Central and South-Eastern Europe and the CIS
are highly susceptible to economic conditions in the Russian Federation. In 2012, for instance,
the Russian Federation directly accounted for just over half of the region’s GDP as well as being a
major trading partner for many of the region’s countries. As such, economic outcomes in the region
depend on a number of key developments, including energy prices, monetary policy in the United
States, economic conditions in the European Union and political upheaval in Ukraine (box 2.3).
Together these developments are having spillover effects on financing conditions, trade and
remittances:
•	 Costs and access to financing: The risk of higher interest rates in the future coupled with higher
global rates stemming from the tapering of quantitative easing in the United States, threaten
to dampen growth. Most Central and South-Eastern European countries as well as Kazakhstan
are highly dependent on external funding (foreign direct investment, cross-border lending and
portfolio investment) and their dependence has increased further since the beginning of the
financial crisis. This high dependence on external funding exposes borrowers to risks of external
shocks. In addition, public finances may be constrained where governments are reliant on
external financing.
8
  Turkey stood out with strong domestic demand, which accelerated economic growth to 4 per cent in 2013.
Geopolitical tensions are affecting economies in Central
and South-Eastern Europe and the CIS
Geopolitical tensions arising from developments in
Ukraine have reverberated across the region. Economic
sanctions imposed on the Russian Federation by the EU,
the United States and several other countries were met
by counter-sanctions banning imports from those econ-
omies, with effects on investment and trade for both the
direct parties to the sanctions and for many of Russia’s
CEES/CIS trading partners.
In Ukraine, the loan agreement with the IMF signed in
April 2014 helped to avert the threat of a public debt
default. The national currency (hryvnya) was devalued
by 40 per cent in February 2014, but the contraction
of exports following the disruption of trade links with
Ukraine’s main trading partner, the Russian Federation,
and a sharp decline in industrial production due to
the conflict in eastern Ukraine (one of the key indus-
trial bases of the country) has caused the value of the
hryvnya to erode further. Currency depreciation and
the abolition of energy subsidies have led to inflationary
pressures. The Ukrainian National Bank has reacted by
lifting the key interest rate, which is having an additional
negative effect on the enterprise sector. Moreover, the
falling budget revenues in combination with mounting
military spending are deepening the budget deficit.
Source: ILO Research Department based on World Bank (2014a).
2.3
Box
ContentsContents
392. Regional developments: An uneven and uncertain recovery
•	 Trade: The slowdown in the European Union and weak demand from the Russian Federation
have hurt export growth, notably in CIS countries, where trade links with the latter are consider-
able. Central and South-Eastern Europe are highly dependent on oil and gas from the Russian
Federation. On the other hand, the embargo imposed by the Russian Federation on food imports
from the United States and the EU could stimulate exports of food not only from Belarus and
Kazakhstan, with whom the Russian Federation has a customs union, but also from Armenia,
Azerbaijan, Kyrgyzstan, Serbia and Turkey, and thus provide an additional boost to their GDP.
•	 Declining remittances: Remittances constitute a significant source of income in the CIS coun-
tries and for Armenia, Moldova, Kyrgyzstan and Tajikistan any substantial decline in remit-
tances would have dramatic implications (remittances contribute 52 per cent to GDP growth in
Tajikistan and 31 per cent in Kyrgyzstan). Economic conditions in the Russian Federation and
a deep recession in Ukraine are likely to have resulted in a fall in remittances in 2014, with a
negative impact on household consumption, economic growth and social development in the
countries of migration origin.
Improvements in the labour market
may stall as a result of these forces
Over the period 2009 to 2014, the employment-to-population ratio rose more than 2 percentage
points, from 53.1 per cent to 55.3 per cent, on the back of a rising labour force participation rate
(see table 2.3). Employment expanded in the Russian Federation despite slowing growth: in 2014
the Russian Federation accounted for 43.5 per cent of all employed persons in Central and South-
Eastern Europe and the CIS, but it only accounted for 18.2 per cent of the increase in the region’s
total employment between 2009 and 2014.
At the same time, the unemployment rate continued its downward trajectory, and is anticipated to
have reached 7.7 per cent in 2014, i.e. 0.4 percentage points lower than in 2008 (see figure 2.3).
Unemployment is expected to rise again in 2015, owing largely to an expected increase in the un-
employment rate in Ukraine from 7.7 per cent in 2014 to 7.8 per cent in 2015. Moreover, a number
of countries in the region, particularly in the Balkans, continue to have very high unemployment
rates, including Serbia at 22.2 per cent in 2014, The Former Yugoslav Republic of Macedonia and
Bosnia and Herzegovina both at 27.9 per cent.
Concerns persist regarding the high incidence of informal employment and, to a lesser extent,
vulnerable employment. In fact, nearly 32 million workers were in vulnerable employment in 2012.
The presence of these precarious forms of employment combined with ageing populations in the
region are likely to contribute to sluggish productivity growth in the medium to long term, reducing
its ability to catch up with advanced economies. It is also affecting, as the following section high-
lights, the incidence of working poverty.
Economic and social developments in Central and South-Eastern Europe (non-EU)
and CIS, 2009–19 (percentages)
2009 2012 2013 2014 2015 2016 2017 2018 2019
Labour force participation rate 59.0 59.7 59.8 59.9 60.0 59.9 59.9 59.7 59.6
Unemployment rate (total) 9.9 8.0 7.8 7.7 7.8 7.8 7.8 7.8 7.8
Youth unemployment rate 20.0 17.4 16.8 16.8 16.9 16.9 17.1 17.1 17.1
Employment growth –1.3 1.1 0.6 0.4 0.1 0.1 –0.1 –0.1 –0.1
Youth employment growth –5.0 –4.6 –2.3 –3.2 –3.4 –3.0 –2.9 –2.5 –1.9
Real wage growth –2.3 8.1 5.1 1.5 1.7 2.7 3.7 4.1 4.2
Productivity growth –5.1 1.9 2.0 0.6 1.7 2.6 3.0 3.2 3.3
Note: Regional wage and productivity growth includes estimates and projections for 16 out of 19 countries. For a detailed list of countries
covered by the aggregate figures and sources of differences in the estimates in comparison with earlier publications (ILO, 2014b), please refer
to Annex 4.
Source: ILO, Trends Econometric Models, October 2014; ILO, Global Wage database, December 2014; ILO Research Department.
2.3
Table
ContentsContents
40 World Employment and Social Outlook – Trends 2015
Social conditions and equity remain a challenge
After the widespread decline in income inequality observed during the first half of the 2000s,
progress in this regard has slowed and since the onset of the crisis income inequality – as meas-
ured by the Gini index – has increased in six of the nine countries with available information (see
table 2.4). This is true among countries with already high levels of income inequality, such as
Georgia, Russian Federation and Turkey. Yet, these countries are, surprisingly, the ones that have
been more successful in reducing poverty. For instance, the share of the population living below
the national poverty line has fallen by almost 6 percentage points in Turkey and Georgia and by
3 percentage points in the Russian Federation.
In contrast, poverty rates increased in Armenia, Kyrgyzstan and Ukraine, which have displayed
relatively stable levels of inequality since 2007. In Kyrgyzstan, according to international poverty
line measures, at the US$1.25-a-day level (PPP) and US$2-a-day level (PPP), the share of
the population below both these thresholds increased between 2008 and 2012; for Armenia,
over the same period, the share in extreme poverty ($1.25 a day) increased while the share in
moderate poverty ($2 a day) decreased. This suggests that policies in Armenia may have failed
to reach the very poorest. Only a few countries managed to simultaneously reduce both income
inequality and poverty.
Effective and sustainable policies to tackle the risks of poverty, inequality, social exclusion and
marginalization remain key challenges across the region. One of the pressing social issues in the
Source: ILO Research Department based on Trends Econometric Models, October 2014.
18
9
36
Unemploymentrate(percent)
27
Ukraine Russian Federation Kazakhstan Tajikistan FYR Macedonia Bosnia
and Herzegovina
2008 2009 2014p
Central and
South-Eastern
Europe and CIS
0
2.3
Figure
Unemployment rates in the Central and South-Eastern Europe and CIS region
and selected countries within, 2008, 2009 and 2014 (percentages)
Income inequality and poverty in selected countries of Central and South-Eastern Europe and CIS
Country
Gini index Poverty rate (per cent)
2007 2012 or latest 2007 2012 or latest
Armenia 29.8 30.3 27.6 32.1
Belarus 28.7 26.4 7.7 6.3
Georgia 40.6 42.1 20.1 14.8
Kazakhstan 29.6 28.5 12.7 2.9
Kyrgyzstan 33.4 33.4 35.0 38.0
Russian Federation 39.2 39.7 13.3 10.7
Turkey 38.4 40.1 8.4 2.3
Ukraine 29.6 24.6 7.1 9.1
Armenia 29.8 30.3 27.6 32.1
Source: World Bank, World Development Indicators database (accessed in October 2014).
2.4
Table
ContentsContents
412. Regional developments: An uneven and uncertain recovery
region is the humanitarian crisis stemming from political and military conflicts as well as the internal
and external displacement of persons. The latest UN reports estimate that as a result of the conflict
in eastern Ukraine roughly 260,000 people are seeking refuge in other parts of the country, while
Ukrainian refugees in the Russian Federation are estimated at 820,000. Meanwhile, Turkey has
absorbed up to 1.6 million refugees from the crisis in Syria, severely straining humanitarian, housing
and employment responses.
Latin America and the Caribbean
After a decade of strong growth, GDP growth is slowing
to levels comparable to those of advanced economies
Between 2003 and 2012, GDP in Latin America and the Caribbean (LAC) grew at an annual
average rate of 3.7 per cent. The growth phase was driven by (i) strong demand for the region’s
minerals and agricultural exports and an associated rise in international commodity prices; (ii) the
availability of capital flows; and (iii) increase in domestic demand (IMF, 2014d). During this period,
growth in LAC outpaced that in advanced economies by over 2 full percentage points (figure 2.4).
Following the region’s initial uptick after the crisis, when annual GDP growth reached 6 per cent in
2010, the pace of growth has slowed and has gradually converged with rates prevailing in advanced
economies. For 2014 (and 2015), GDP growth in LAC is forecast to be below that of advanced
economies – for the first time since 2002.
The recent slowdown is due to a number of factors, most notably weak global aggregate demand
and falling commodity prices. Between 2011 and 2014, the prices of metals fell by more than
65 per cent (whereas between 2003 and 2011, prices increased more than four-fold).9
The decline in economic growth is also partially a reflection of low productivity growth, which
has plagued the region for some time (1.5 per cent between 2003 and 2012 versus 2.0 per cent
globally). The sluggish productivity gains stem from a number of structural issues, including still
high rates of informal employment, inadequate investment in infrastructure, and an export base
that is concentrated in primary sectors such as commodities and agricultural products (ILO, 2014e).
9
  Based on IMF Metals Price Index. Figures for 2014 are provisional.
Source: ILO Research Department based on IMF World Economic Outlook, October 2014.
4
8
–4
2003 2004 2005 2006 2008 2009 2010 2011 2012 2013 2014 2015
Advanced economies Latin America and the Caribbean
0
Forecast
Percent
2.4
Figure
GDP annual growth in LAC and advanced economies, 2003–15 (percentages)
ContentsContents
42 World Employment and Social Outlook – Trends 2015
As a result, the pace of labour market
and social improvements is slowing
Thanks to the fast expansion of GDP and well-targeted policies in some countries, the un-
employment rate in LAC has been falling at a rapid pace over the past decade – from 9.1 per cent
in 2003 to 6.3 per cent in 2013 (see table 2.5). The urban unemployment rate declined at an
even faster pace, going from 11 per cent in 2003 to 6.2 per cent in 2013 (ECLAC and ILO, 2014).
Yet the pace of improvement is slowing: between 2013 and 2014 the unemployment rate rose
by 0.3 percentage points – the first increase since the one of 2009. Moreover, the labour market
outlook suggests that unemployment will stand at 6.8 per cent in 2015 and that it will remain
near this level in the coming years. Male unemployment remains significantly lower than female
unemployment – at 5.2 per cent and 7.8 per cent, respectively, in 2013 – although the gap has
considerably narrowed since the beginning of the 2000s.
Unemployment among youth has also declined considerably, i.e. from 17.5 per cent in 2003 to
13.3 per cent in 2013. Yet, this rate is 2.8 times the adult unemployment rate – a ratio higher than
that registered in the EU (see above). In fact, youth are disproportionately over-represented in un-
employment: young people represent more than 40 per cent of the total unemployed in the region,
but they only represent 24 per cent of the working-age population. The youth unemployment rate
will have slightly increased in 2015 – reaching 14.2 per cent. Moreover, youth are more likely to be
in informal employment than adults – 56 per cent of young workers are employed in the informal
economy compared with 46 per cent of adults (ILO, 2013b). Finally, youth suffer from gaps in the
educational system as well as difficulties in school-to-work transitions.10
Informal employment persists, despite progress to formalize jobs, and represents one of the main
challenges for labour markets in LAC. In 2013, 46.8 per cent of workers in LAC were informally
employed, down from 52 per cent in 2005. Most of the informal employment is in the informal
sector of the economy (30.5 per cent of total employment), while the remainder is composed of
informal employment in the formal sector (11.4 per cent) and domestic workers (4.9 per cent)
(ILO, 2014j). High levels of informal employment were registered in Peru (64.0 per cent), Mexico
(53.8 per cent) and Ecuador (49.3 per cent), while the share of informal employment in Argentina
is in line with the regional average (46.8 per cent), and relatively low levels of informality are found
in Costa Rica (30.7 per cent), Uruguay (33.1 per cent) and Brazil (36.5 per cent).
Inequality has decreased considerably in LAC during the past decade – the Gini index for the region
declined a striking 5 points from 55 to 50 between 2002 and 2012. This was attributable in part
to a reduction in the hourly wage gap between skilled and unskilled workers, a result of substantial
increases in minimum wages in some countries, combined with significant and more progressive
public transfers (Lustig et al., 2013). However, the pace of improvements has slowed in the past two
years.11
Moreover, inequality levels remain higher than in other regions of the world. In particular,
the median Gini index is 44.8 in LAC, compared with an average of 30.2 in developed countries,
42.1 in Sub-Saharan Africa and 36.7 in East Asia and the Pacific (figure 2.5).
10
 See Bassi et al. (2012) for a detailed description of recent trends in youth performance within and outside the labour market.
11
  Socio-Economic Database for Latin America and the Caribbean (CEDLAS and the World Bank).
Economic and social developments in Latin America and the Caribbean, 2009–19 (percentages)
2009 2012 2013 2014 2015 2016 2017 2018 2019
Labour force participation rate 65.7 66.2 66.2 66.2 66.2 66.2 66.2 66.3 66.3
Unemployment rate (total) 7.5 6.3 6.3 6.6 6.8 6.9 6.8 6.8 6.8
Youth unemployment rate 15.5 13.5 13.3 13.8 14.2 14.2 14.1 14.0 14.0
Employment growth 0.7 2.5 1.7 1.4 1.7 1.7 1.6 1.5 1.5
Youth employment growth –3.5 1.6 0.7 –0.2 0.8 0.9 0.7 0.6 0.4
Note: Numbers on labour force and (un)employment might differ from estimates provided by ILO’s Panorama Laboral (ILO, 2014g) publication due to differences
in methodology and coverage.
Source: ILO, Trends Econometric Models, October 2014; ILO Research Department.
2.5
Table
ContentsContents
432. Regional developments: An uneven and uncertain recovery
As a result of the overall improvements in labour market performance and the reduction in in-
equality, poverty has fallen dramatically in LAC during the past decade. The share of the working
poor in total employment – defined as those earning less than US$2 per day (PPP) – has decreased
from 14.1 per cent in 2003 to 5.4 per cent in 2013. Meanwhile the share of the middle class – those
earning more than US$13 per day (PPP) has increased from 17.8 per cent to 30.4 per cent during
the same period. As a result, the income poverty headcount ratio of the entire population – thus
Source: ILO Research Department based on Alvaredo and Gasparini (2013). Data refer to 2010.
45
55
65
25
35
H
H
J
J
H
J
J
H
H
J
J
H
H
J
J
H
H
J
J
H
H
J
J
H
Sub-Saharan
Africa
Latin America
and the Caribbean
Eastern Europe
and Central Asia
East Asia
and the Pacific
Middle East
and North Africa
South Asia
Min
Max
Percentile 25
Percentile 75
2.5
Figure
Inequality levels remain high in comparative terms as measured by Gini index
Social protection programmes in Latin America: The case of Peru
Peru has registered the largest progress in poverty reduc-
tion in LAC during the past decade – its poverty rate
dropped from 52.5 per cent to 23.7 per cent between
2003 and 2012. This reduction was mainly driven by
economic growth and fiscal policies that were comple-
mented by social protection programmes. An example
of this is the National Programme for the Support of the
Poorest (Juntos).
Juntos is a conditional cash transfer (CCT) programme
introduced in 2005 with the aim of reducing poverty by
improving nutrition and access to health and education
for vulnerable populations. The Government’s long-term
objective was to promote human capital accumulation for
future generations as a way of reducing the intergener­
ational transmission of poverty, while in the short term re-
ducing poverty through cash transfers. The programme
is aimed at children as well as expectant and nursing
mothers; requirements for the programme include
regular attendance at school and health checks.
In 2008, the Government decided to give additional sup-
port to the programme and to place it as a key element
of its anti-poverty social policy. In collaboration with the
World Bank, the programme has been closely monitored
since then and its impact evaluated. It has been found
that the programme has moderately reduced poverty
and has had positive effects on income and consump-
tion.1
Moreover, Juntos has improved access to health
services, both for children and women, and increased
school attendance. Finally, more recent studies have
shown that the longer the duration of participation, the
greater the impact of the programme.2
Evaluating programmes of this nature is critical in the
quest of governments for programmes that work effec-
tively. In Peru, availability of specific questions as part
of the Peruvian National Household Survey (ENAHO)
regarding the participation of households in the Juntos
programme was a key element that made these evalu-
ations possible. Additional efforts are, however, ne-
cessary to shed light on the effects of the many other
important social and labour market policies that exist in
Peru and elsewhere in LAC. Conscious of this need, the
ILO Research Department will be publishing a report on
the effectiveness of active labour market policies in Latin
America in the summer of 2015.3
1
Perova and Vakis (2009).  2
Perova and Vakis (2011).  3
ILO (forthcoming).
2.4
Box
ContentsContents
44 World Employment and Social Outlook – Trends 2015
considering individuals of all age groups and both inside and outside the labour market – has
decreased from 43.9 per cent in 2002 to 27.9 per cent in 2013. In absolute terms, this represents
a decrease in the total number of poor people from 225 million to 164 million.12
However, these positive developments have also slowed: the share of working poor in the total
employed population decreased in 2013, but by only 0.23 percentage points – compared with
an average decrease of 0.79 percentage points per year in the previous decade. Given the weak
macroeconomic outlook of the region, achieving further gains in poverty reduction will be an im-
portant challenge. Moreover, wage growth continues to trail increases in productivity, leading to a
fall in the labour income share, despite the good employment performance and the reduction in
poverty. Unless addressed, this will limit the capacity of the region to generate stronger domestic
demand to offset dependence on external demand for its commodity exports. The role of public
policies will thus be crucial to redirect economic growth towards poverty alleviation and shared
prosperity. Some countries in the region, including Argentina, Brazil and Uruguay, have compre-
hensive social and labour market programmes that have obtained significant results in reducing
poverty and inequality over the past decade. The example of the Juntos programme in Peru is
discussed in box 2.4.
East Asia
Slower growth in China is affecting the region’s growth prospects
Economic growth in China, the largest economy in the region, is estimated to have slowed to 7.4 per
cent in 2014, compared with 7.7 per cent in 2013.13
Economic indicators in the third quarter of
2014 declined markedly, with growth in fixed-assets investment, industrial production and foreign
direct investment into China weakening to levels not seen in recent years. In response, the People’s
Bank of China lowered the benchmark loan and deposit interest rates in November 2014.
The slowdown reflects, in part, continued weak external demand based on slow global economic
growth, together with only limited success in the Government’s effort to rebalance the economy
towards greater reliance on household consumption rather than investment and exports. The share
of household consumption in GDP rose from 34.9 per cent in 2010 to 36.2 per cent in 2013. In
addition, credit growth slowed as interest rates rose, although this is expected to bring credit growth
to a more sustainable level. Further, curbs in public investment and infrastructure spending – also
a significant force behind GDP growth over the past decade – have fallen, but should help reduce
the fiscal deficit in the medium term.
A major challenge for China’s outlook in the medium term lies in vulnerabilities of its real estate
sector. Over the past decade, real estate investment (including construction) has made an
increasing contribution to growth and employment, rising from around 5–6 per cent of GDP in
2000 to approximately 15 per cent in 2012, and accounting for around 14 per cent of all urban
employment in 2012 (IMF, 2014b). Such trends are due to a combination of low interest rates,
popular use of real estate as collateral for corporate borrowing, and its role as a significant source of
funding for local governments. The real estate sector has started to decline in terms of investment
activity, but there is a risk of an abrupt or disorderly decline, which would have negative conse-
quences for both employment and output.
Against the backdrop of the slowdown in China, the East Asian economy is projected to have grown
by 6.8 per cent in 2014, with output slowing to 6.6 per cent in 2015. Countries bucking the trend
include the Republic of Korea and Mongolia, where growth in 2014 is expected to have accelerated
to 3.7 per cent and 9.1 per cent, respectively.14
12
  Economic Commission for Latin America and the Caribbean database.
13
  China GDP projections based on IMF (2014a).
14
  Mongolia and Republic of Korea GDP projections based on IMF (2014b).
ContentsContents
452. Regional developments: An uneven and uncertain recovery
New, educated entrants to the labour market are affected –
exacerbating the demographic challenge
The deceleration in growth in East Asia has led to a slow but steady rise in the unemployment rate
(see table 2.6). As such, the unemployment rate is expected to have climbed from 4.2 per cent in
2010 to 4.6 per cent in 2014. During this period, the increase in the unemployment rate has been
more pronounced among youth, increasing from 9.0 per cent in 2010 to 10.5 per cent in 2014,
while that of adults is estimated to have risen from 3.2 per cent in 2010 to 3.7 per cent in 2014.
This partly reflects the difficulties young people face in finding jobs that match their skills and
expectations. In China, for example, the unemployment rate in 2013 was just above 4 per cent in
urban areas, but was more than double among registered graduates in the same area (box 2.5).
Birth rates continue to outpace mortality rates across the East Asian region (12.9 births to
7.3 deaths per 1,000 people), but at a lower rate than in 1990 (21.5 births to 6.8 deaths). This
has resulted in a considerable slowdown in population growth: decreasing from 1.6 per cent per
annum between 2000 and 2009 to 0.7 per cent per annum between 2010 and 2014. In China, for
instance, the old-age dependency ratio – represented here as the ratio of those aged 65+ to every
100 members of the working-age population (15–64) – has increased from 8.9 in 1990 to 12.4 in
2013, and is anticipated to reach 23.8 by 2030. Elsewhere, such as in the Republic of Korea, the
ratio is expected to increase from 16.8 in 2013 to 37.1 in 2030, and in Mongolia, from 5.5 to 10.6
over the same period. The extent to which these trends will put downward pressure on GDP growth
depends in part on the accumulation of wealth achieved through the boom years.
Relative to the global average of 51.5 per cent, the proportion of older women and men receiving
an old-age pension is high in East Asia. In China and the Republic of Korea, around three in
four older persons are pension beneficiaries, while in Mongolia coverage is universal. In early
Economic and social developments in East Asia, 2009–19 (percentages)
2009 2012 2013 2014 2015 2016 2017 2018 2019
Labour force participation rate 70.7 70.6 70.8 70.8 70.9 70.8 70.7 70.5 70.3
Unemployment rate (total) 4.4 4.4 4.5 4.6 4.8 4.9 4.9 5.0 5.0
Youth unemployment rate 9.4 9.7 10.1 10.5 10.8 11.1 11.4 11.6 11.7
Employment growth 0.4 0.8 0.7 0.5 0.4 0.3 0.2 0.1 0.1
Youth employment growth –2.3 –3.9 –5.2 –5.7 –5.5 –5.1 –4.8 –4.3 –3.5
Real wage growth 7.5 7.7 7.1 6.9 6.9 6.9 6.8 6.8 6.7
Productivity growth 7.1 5.9 6.2 6.3 6.2 6.1 6.1 6.0 5.9
Note: Regional wage and productivity growth includes estimates and projections for 3 out of 7 countries. For a detailed list of countries covered by the aggregate
figures and sources of differences in the estimates in comparison with earlier publications (ILO, 2014b), please refer to Annex 4.
Source: ILO, Trends Econometric Models, October 2014; ILO, Global Wage database, December 2014; ILO Research Department.
2.6
Table
China’s graduates: Not enough good jobs
To expand higher education in the country, the
Government of China increased the numbers of colleges
and universities from 1,552 to 2,491 between 2003 and
2013. During the same period, the number of secondary
vocational schools declined by 16.4 per cent (from 14,682
to 12,281). Moreover, 6.4 million college graduates entered
the labour force in 2013, 3.4 times higher than in 2003
(NBS, 2014). According to the Chinese College Graduates’
Employment Annual Report 2014, China now faces the
significant challenge of addressing unemployment among
graduates, which stood at 8.6 per cent in 2013. For those
new graduates who found jobs, the average wage was
3,250 yuan (about US$525, as of 2013) per month, which
is roughly four-fifths of the urban average.1
Approximately
56 per cent of graduates in 2013 expressed dissatis-
faction with their current jobs. One of main challenges
for the country is, therefore, to utilize the potential of
new graduates more productively in the economy.
1
Calculated based on NBS (2014) and assuming that US$100 = 619.32 yuan.
Source: NBS (2014), Annual Report 2014, Blue Book of Employment, Social Sciences and Academic Press (China).
2.5
Box
ContentsContents
46 World Employment and Social Outlook – Trends 2015
2014, China made further strides in strengthening its social security system by merging disparate
schemes and announcing other measures to address issues of adequacy, equality, portability
and sustainability. In the case of the Republic of Korea, addressing the impact of ageing entails
promoting greater economic participation of women, for example through improved childcare
and maternity leave benefits, as outlined in the recent policy initiative to achieve a 70 per cent
employment rate. This would not only help counter concerns related to ageing, but also narrow
labour market gender gaps.
The region’s social outlook could be weighed down by high (and in some case rising) levels of
income inequality. In China, for example, the Gini index increased from 32.4 in 1990 to 42.6 in
2002 and has changed very little since.15
Meanwhile, the share of total income held by the most
wealthy 10 per cent of the population increased by 4.7 percentage points, from 25.3 per cent in
1990 to 30.0 per cent in 2009. Likewise, in Mongolia, the comparable income share rose 5.5 per-
centage points, from 22.9 per cent in 1998 to 28.4 per cent in 2008, reflecting the growing uneven
distribution of natural resource revenues.
In this context, policy priorities in China have shifted to promote consumption and wages as critical
aspects of reforms and rebalancing of growth. The Government has used minimum wage policies
aggressively, with annual double digit increases over more than a decade. Other policies aim to
accelerate urbanization to help close the rural–urban income and opportunity divide.16
South-East Asia and the Pacific
Developments in the region’s large economies
are weighing on regional GDP growth
Economic growth in the South-East Asia and the Pacific region is forecast to have fallen below 5 per
cent in 2014 – the lowest level since 2008. Growth in the region has been affected by develop-
ments in Indonesia, the region’s largest economy, whose exports have remained weak since early
2013. Although the pace of decline has slowed in recent months, export growth has been negative,
year-on-year, since February 2013. Both domestic policies to increase value added and spillovers
from slower growth in China have taken a toll on Indonesia’s export growth.
Economic growth in the South-East Asia and the Pacific region was also dampened by political
developments in Thailand: annual GDP growth is expected to have fallen to 1.5 per cent in 2014 as
political uncertainty in the country weighed on consumer and business sentiment as well as tourism.17
Similarly, while economic growth remains robust in the Philippines, in part due to gains in manufac-
turing, the pace of growth is set to have slowed to 6.5 per cent in 2014, compared with 7.2 per cent
15
  The latest available information from the World Bank (2014c) indicates that the Gini index in China stood at 42.1 in 2010.
16
  For further discussion, see ADB (2014) and Buckley (2014).
17
  GDP forecast based on Bank of Thailand.
Economic and social developments in South-East Asia and the Pacific, 2009–19 (percentages)
2009 2012 2013 2014 2015 2016 2017 2018 2019
Labour force participation rate 70.3 70.4 70.4 70.4 70.4 70.3 70.2 70.1 70.0
Unemployment rate (total) 5.2 4.1 4.3 4.3 4.3 4.2 4.2 4.2 4.1
Youth unemployment rate 14.0 12.7 13.6 13.6 13.6 13.6 13.6 13.6 13.5
Employment growth 1.8 2.0 1.5 1.6 1.5 1.5 1.4 1.4 1.3
Youth employment growth –0.2 0.6 –0.7 0.3 0.0 –0.1 –0.2 –0.2 –0.1
Real wage growth 2.6 3.6 6.1 1.9 3.1 3.4 3.7 3.7 3.8
Productivity growth 0.0 4.0 3.4 2.8 3.7 3.7 3.9 4.0 4.0
Note: Regional wage and productivity growth includes estimates and projections for 7 out of 14 countries. For a detailed list of countries covered by the aggregate
figures and sources of differences in the estimates in comparison with earlier publications (ILO, 2014b), please refer to Annex 4.
Source: ILO, Trends Econometric Models, October 2014; ILO, Global Wage database, December 2014; ILO Research Department.
2.7
Table
ContentsContents
472. Regional developments: An uneven and uncertain recovery
in 2013.18
On the upside, GDP growth in Fiji, Papua New Guinea and Timor-Leste is projected to have
picked up in 2014, reaching 3.8 per cent, 9.0 per cent and 6.0 per cent, respectively.19
Sudden capital flow reversals remain a key concern in this region. Net flows in the ten member
countries of the Association of Southeast Asian Nations (ASEAN) rebounded in the first half of
2014, but concerns linger on the possible rapid retrenchment of capital flows if global investors
reassess policy rate differential and risk outlooks. For the moment, however, net foreign direct
investment inflows in the ASEAN countries have remained relatively stable, even during the
recent period of financial market turmoil. In addition to potential spillovers from monetary policy
in advanced economies, especially the United States, the South-East Asia and the Pacific region
is also confronted by potential spillovers from slowing growth and rebalancing in China, given
the region’s increasing trade and investment linkages.20
Research indicates, for example, that
each percentage point deceleration in China’s output growth could lower GDP growth in the median
ASEAN-5 economy by 0.35 percentage points (IMF, 2014c).21
Employment growth has been steady, including for youth and women,
but structural shifts will bring institutional challenges
Between 2010 and 2014, overall employment grew on average by 1.8 per cent per annum. During
that period, women’s employment grew at a slightly faster rate, i.e. 1.9 per cent, compared with
1.7 per cent for men. This was likely driven by the trend in a few countries, such as Indonesia,
Malaysia and Viet Nam (see box 2.6), where women’s employment expanded primarily in labour-­
intensive manufacturing and trade-related services. In addition, women in vulnerable employment
as a share of total female employment declined 1.7 percentage points in the same period, while
vulnerable employment among men decreased by 1.0 percentage point.22
Job creation among
youth has also been fairly robust, averaging 0.6 per cent per annum between 2010 and 2013,
compared with the period 2000 to 2009, during which employment of young men and women fell
by the same margin per annum.
The overall employment dynamics continue to evolve: the share of agricultural employment con-
tinues to decline and increased economic integration within the region will have important labour
market and social consequences.23
With respect to the latter, in 2015 the ASEAN Economic
Community (AEC) will become a single common market and production base.24
This is likely to
spur greater trade and investment flows and accelerate structural change. But analysis of the
impact on the labour market shows that the benefits of the AEC could be uneven (ILO and ADB,
2014). Labour demand in some sectors (and countries) may expand while in others it could decline.
Without strong social protection measures and employment services in place, the social outlook
for redundant workers and young graduates without the right skills could be daunting. In addition,
strong and appropriate wage-setting institutions will be needed to avoid beggar-thy-neighbour
strategies that could impede further progress in the areas of poverty reduction and inequality.
Indeed, with a few exceptions, public investment in social protection in the region remains limited
in comparison with the global average of 8.6 per cent and labour market institutions have not
developed sufficiently. However, notable progress has been achieved recently in Cambodia and Viet
Nam, for example, where existing weaknesses in wage-setting institutions have been addressed
through new tripartite wage-setting mechanisms covering at least some sectors.
18
  Manufacturing expanded by 10.2 per cent in the second quarter of 2014 compared with the same period in the previous year.
19
  Growth in Fiji is forecast to have been the highest rate since 1999, as the build-up to democratic elections in September 2014 boosted
economic confidence.
20
  The combined share of ASEAN total trade with China rose from 4.4 per cent in 2000 to 13.1 per cent in 2012. See ILO and ADB (2014).
21
  Other research finds that a 1.0 percentage point deceleration in China’s investment growth is associated with a decline in GDP growth of
around 0.6 percentage points in Malaysia and the Republic of Korea, by around 0.4 percentage points in Thailand and by around 0.2 percentage
points in the Philippines. See Ahuja and Nabar (2012).
22
  However, despite notable gains in raising women’s profiles in the Southeast Asian labour market, employment in the region continues to be
marked by gender differences. The gap in labour force participation rates between 2010 and 2014 remained steady at approximately 23 per-
centage points and while 55.6 per cent of employed men were vulnerable, the rate was much higher for women, 62.6 per cent.
23
  The share of employment in agriculture declined from 40.5 per cent in 2010 to 37.1 per cent in 2014 (though the decline in Thailand has
modestly reversed, and in Samoa extremely low labour force participation rates can be largely attributed to the high significance and persistence
of subsistence agriculture. In fact, in Thailand between 2010 and 2013, there was a slight increase in the share of agricultural employment (in
the third quarter) from 42.4 per cent to 44.1 per cent for men and from 38.7 per cent to 39.3 per cent for women (ILO, 2014h).
24
  The ten members of ASEAN are Brunei Darussalam, Cambodia, Indonesia, Lao People’s Democratic Republic, Malaysia, Myanmar, Philippines,
Singapore, Thailand and Viet Nam.
ContentsContents
48 World Employment and Social Outlook – Trends 2015
Finally, a critical driver weighing on the social outlook of South-East Asia and the Pacific is the
impact of climate change and frequent natural disasters that destroy livelihoods and communities.
For example, Samoa’s economy was devastated by Cyclone Evan in December 2012, which caused
damage and losses estimated at 30 per cent of GDP (ILO, 2014i). In the Philippines, Typhoon
Haiyan struck in November 2013 and impacted an estimated 5.9 million workers and their families
(ILO, 2013c). In this context, reconstruction strategies that include social protection measures and
emergency employment responses would help affected workers to more rapidly rebuild their lives,
their families and their communities. Greater investment in disaster preparedness and risk reduction
through stronger international cooperation will also help.25
25
  For further discussion, see United Nations (2014).
Female employment in Malaysia
Between 2010 and 2013, the employment growth rate
for female workers in Malaysia was higher than for their
male counterparts (5.9 per cent compared with 2.2 per
cent). However, job quality remains of concern given that
almost half (around 46 per cent) of the jobs for women
were created in vulnerable employment, compared with
less than 10 per cent for men.
In addition, the vast majority of additional female jobs
were in the service sector (79.5 per cent), followed by
the industrial sector (15.8 per cent) and agriculture
(4.7 per cent). In contrast, male employment in agri-
culture contracted by 3.9 per cent. The largest gains in
male employment were in the service sector (59.4 per
cent), followed by the industrial sector (44.4 per cent).
2.6
Box
Note: Figures in parenthesis represent the percentage increase in the
employment level over the period 2010–13.
Source: ILOSTAT, Malaysian Labour Force Survey.
6
9
3
(thousands)
Male Female
0
(9.1%)
(17.6%)
2010 2013
2.6
Figure
Employment level in Malaysia
by gender, 2010 and 2013
ContentsContents
492. Regional developments: An uneven and uncertain recovery
South Asia
Growth is recovering but challenges from global
and domestic forces remain
India, the region’s largest economy, experienced a sharp slowdown in 2012 and 2013, when growth
dropped below 5 per cent, driven in particular by weak industrial output. Following this, the Indian
economy grew slightly faster in 2014, reaching 5.4 per cent, reflecting an improvement in the
growth rate of the services sector and a better monsoon than originally forecast.
Bangladesh and Sri Lanka have been able to maintain robust economic growth rates in recent years.
In Bangladesh’s case, the economy has grown at around 6 per cent for an extended period due to
the strong growth in exports (driven by the garment industry) and consumption (fuelled by remittance
inflows). The Sri Lankan economy has performed even better, with the GDP growth rate estimated
at 7.0 per cent in 2014, on the heels of strong domestic demand and a rise in exports and tourism.
The economies of Nepal and Pakistan have consistently grown below the regional average, with
the former suffering in recent years from political tensions and the latter having been hit by inse-
curity, political uncertainty and weak macroeconomic fundamentals. Growth in Afghanistan and
the Maldives also slowed in 2014.
Like other developing regions, South Asia faces uncertainty stemming from spillover effects of
monetary policy in advanced economies and energy price disruptions. India, whose economy
remains the main destination for foreign direct and institutional investment flows in the region, was
particularly affected in 2013. During the country’s fiscal year 2013–14, foreign direct investment
inflows reached US$36.0 billion and net foreign institutional investment (FII) flows in just the first
three months of the same fiscal year amounted to US$12.5 billion.26
Thereafter there was a swift
reversal of FII flows: between June and August 2013, net FII outflows amounted to US$15.4 billion,
before short-term capital flows stabilized and returned by the end of 2013 due to measures taken
by the Reserve Bank of India.
Jobless growth underpinned by informal employment
and working poverty
South Asia faces a serious challenge of jobless growth, as average annual economic growth of
6.1 per cent from 2009 to 2014 corresponded to employment expansion of only 1.4 per cent per
year for the same period (table 2.8). Moreover, much of the employment growth that occurred
was in vulnerable and informal employment (IILS, 2013). For instance, vulnerable employment
accounted for over three-quarters of all employment in 2014, with many of those in vulnerable
employment working in subsistence agriculture and likely to be among the working poor. Moreover,
the majority of women in South Asia are still heavily dependent on this sector, at 62.0 per cent in
2014, compared with 42.1 per cent for men. Most South Asian countries face a challenge of low
labour force participation for women, with the exception of Nepal (see figure 2.7). Typically, low
female participation in South Asia has been attributed to social norms associated with women
burdened with household duties as well as relatively lower levels of female education.
The process of structural transformation remains unfinished in South Asia. In 2014 agriculture
accounted for 46.8 per cent of all employment in the region, compared with the global average
of 29.1 per cent.27
While the share in agriculture has been declining, from 52.2 per cent in 2008,
there is a scarcity of quality opportunities for those leaving rural areas and for the large number of
young people entering the labour market. An additional 2.1 million youth will enter the labour force
over the next five years, potentially aggravating already high youth unemployment, which is 4 times
higher than that for adults.
The unemployment rate is relatively low in South Asia, at 3.9 per cent in 2014 – lower than in all
other regions – but this fails to reflect the quality of jobs. The share of those in employment who live
below PPP US$1.25 per day (the international extreme poverty threshold) is estimated at 19.3 per
26
  EXIM Bank, http://www.eximbankindia.in/sites/default/files/ind-eco.pdf.
27
  There has been significant cross-country variation in employment in the manufacturing sector: from just 6.6 per cent in Nepal to 18.5 per
cent in Sri Lanka.
ContentsContents
50 World Employment and Social Outlook – Trends 2015
cent in 2014 – equivalent to 124 million people. Only Sub-Saharan Africa has a higher share.
The same is true at the US$2-a-day level (PPP), which accounts for over half of the employed
population (54.4 per cent in 2014), equivalent to 350 million people.
Nonetheless, over the past decade, many countries in the region have also been able to reduce
the extent of extreme poverty. This owes largely to the anti-poverty focus adopted in national devel-
opment plans by countries including India, Bangladesh and Nepal, such as the rural employment
guarantee in India and enhanced access to finance for the poor. The share of the population living
on less than US$1.25 a day (PPP) fell from 58.6 per cent in 2000 to 43.3 per cent in 2010 in
Bangladesh, while in Nepal it dropped from 53.1 per cent in 2003 to 23.7 per cent in 2010 (see
table 2.9). Declines of a similar magnitude have been observed in India and Pakistan, where the
share was 24.7 per cent and 12.7 per cent, respectively, in 2011. Bhutan, Maldives and Sri Lanka
Economic and social developments in South Asia, 2009–19 (percentages)
2009 2012 2013 2014 2015 2016 2017 2018 2019
Labour force participation rate 57.8 56.1 56.1 56.2 56.2 56.3 56.3 56.3 56.3
Unemployment rate (total) 4.2 3.9 3.9 3.9 3.9 4.0 4.0 4.0 4.0
Youth unemployment rate 9.8 9.9 9.9 10.0 10.1 10.2 10.2 10.3 10.3
Employment growth 0.7 1.0 2.0 1.9 1.9 1.8 1.8 1.7 1.7
Youth employment growth –2.1 –1.8 0.6 0.4 0.3 0.3 0.3 0.2 0.1
Real wage growth 4.8 1.3 3.3 2.3 2.7 3.1 3.3 3.5 3.6
Productivity growth 6.8 3.8 3.2 3.6 4.2 4.4 4.6 4.8 4.8
Note: Regional wage and productivity growth includes estimates and projections for 5 out of 8 countries. For a detailed list of countries covered by the aggregate
figures and sources of differences in the estimates in comparison with earlier publications (ILO, 2014b), please refer to Annex 4.
Source: ILO, Trends Econometric Models, October 2014; ILO, Global Wage database, December 2014; ILO Research Department.
2.8
Table
Source: ILO Research Department based on ILOSTAT and national sources.
25
100
Labourforceparticipationrate
(percent)
75
Male Female
Pakistan (2013) India (2011–12) Sri Lanka (2013) Bangladesh (2010) Nepal (2013)
50
68.9
21.5
31.2
35.6 36.0
77.579.8
75.5
82.5
85.6
0
2.7
Figure
Gender differences in labour force participation rates, selected countries (percentages)
Poverty headcount ratio and inequality, selected countries, latest available data
Country
Poverty headcount ratio at US$1.25
a day (PPP) (% of population)
Poverty headcount ratio at US$2
a day (PPP) (% of population)
Gini index
Afghanistan – – 27.8 (2008)
Bangladesh 43.3 76.5 32.1 (2010)
Bhutan 1.7 15.5 38.7 (2012)
India 24.7 60.5 33.9 (2010)
Maldives 1.5 12.2 37.4 (2004)
Nepal 23.7 55.9 32.8 (2010)
Pakistan 12.7 50.6 29.6 (2011)
Sri Lanka 4.1 23.9 36.4 (2010)
Source: World Bank Poverty and Equity Databank and PovcalNet.
2.9
Table
ContentsContents
512. Regional developments: An uneven and uncertain recovery
have almost eradicated extreme poverty during the past decade. However, these countries show
the highest levels of income inequality in the region, which has remained relatively persistent over
the past decade. This suggests that poverty alleviation does not automatically translate into a
more equal distribution of the benefits of economic growth. The share of people living on less than
US$2 a day (PPP) remains extremely high, at 60 per cent in India (2012) and over 50 per cent
in Pakistan (2011) and Nepal (2010). The situation is even more dramatic in Bangladesh, where
three out of four people lived on less than US$2 a day (PPP) in 2010.
Middle East and North Africa
Geopolitical uncertainty continues to hold back economic growth
Difficult political transitions, security challenges and rising regional conflicts continue to weigh
on the economic prospects of Middle East and North Africa (MENA). GDP growth in the region
is expected to have remained tepid in 2014, at around 2.6 per cent, slightly above the 2.3 per
cent registered in 2013. This represents a significant slowdown in regional economic progress,
considering that annual growth had averaged 5.3 per cent between 2000 and 2012. In 2015, GDP
growth should reach 3.8 per cent. However, projected economic growth will not be sufficient to
reduce the persistently high unemployment rates.
Domestic consumption, supported by large remittances and public subsides, will continue to drive
growth among oil-importing economies, which are expected to grow on average by around 3 per
cent in 2014 and 4 per cent in 2015. Below-average GDP growth in 2014 is expected in Egypt
and Lebanon, while Morocco and Tunisia should have grown by 3.5 per cent and 2.8 per cent,
respectively.
Declining oil prices, conflicts and unstable security situations continue to weigh on the economic
prospects of many countries in the region. While GDP growth in Gulf Cooperation Council (GCC)
countries28
was sustained in 2014 – reaching 4.6 per cent in Saudi Arabia and 6.5 per cent in Qatar,
this does not take into account the significant fall in the price of oil that took place in the second half
of 2014.29
Even before oil’s price decline, capital outflows had been larger in those GCC countries
with the weakest external positions, such as Bahrain and Oman.30
The fall in oil prices could thus lead to deterioration in their fiscal positions. Indeed, the share of
non-oil revenues in total public revenues remains limited, ranging between 10 per cent and 20 per
cent in five out of six GCC countries in 2013 – the exception was Qatar, where it stood at around
40 per cent. Moreover, lower prices will strain public finances for a number of countries, including
Algeria, Bahrain, Iran, Iraq, Libya and Saudi Arabia, which may have considerable negative impli-
cations for social spending (IMF, 2014d). As such, diversification into non-oil sectors may need to
accelerate: in 2014, steady economic growth in GCC countries was already, in part, a reflection of
economic diversification spurred by large amounts of private credit.
Unemployment persists at high levels
Labour markets in the MENA region have yet to recover from the political instability that surfaced in
2011 (see table 2.10). Indeed, in 2011 the unemployment rate rose to 11.6 per cent – from 10.8 per
cent the previous year – and is expected to remain at 11.7 per cent through to 2015, with a youth
unemployment rate remaining 3.7 times higher than the adult rate. As such, unemployment rates in
the region continue to be the highest in the world, with the youth unemployment rate at a staggering
29.5 per cent in 2014 and expected to rise to 29.8 per cent in 2015. Making strides in reducing
unemployment, especially among youth, is hampered by the size of the growing and comparatively
28
  The GCC countries are Bahrain, Kuwait, Oman, Qatar, Saudi Arabia and the United Arab Emirates.
29
  According to IMF (2014d), the future oil price may be uncertain, as there is a more than 30 per cent probability that the oil price will be above
US$112 or below US$87 per barrel in the middle of 2015. Indeed, between June and December 2014, the IMF’s petroleum price index had
fallen by nearly 90 per cent and as of 31 December 2014, the Brent Crude price of oil per barrel stood at US$55.
30
  GCC economies have recently experienced net outflows of private capital, though this has been somewhat smaller than in other emerging
economies (IMF, 2014d).
ContentsContents
52 World Employment and Social Outlook – Trends 2015
young population. In 2014, 26.2 per cent of the working-age population was aged 15–24 years,
compared with 22.4 per cent globally.
Female participation in the labour force remains very low. The labour force participation rate for
women in the region was 21.7 per cent in 2014, which is 53.5 percentage points lower than the
rate for men (75.2 per cent). The gender gap in labour market performance extends beyond partici-
pation. For instance, the female unemployment rate stood at 21.3 per cent in 2014, 2.3 times the
male equivalent, and compares with a global female unemployment rate of 6.3 per cent. Moreover,
27.3 per cent of employed women in the MENA region are classified as “unpaid family workers”,
compared with 18.2 per cent globally.
The lack of employment opportunities has led to an increase in informality: the informal economy is
estimated now to employ two-thirds of the labour force and produce one-third of GDP in non-GCC
countries.31
ILO survey results show that the incidence of job informality among youth reaches
above 50 per cent in Jordan and Tunisia, while it is over 90 per cent in Egypt and Occupied
Palestinian Territories. Moreover, the informal economy is growing as a result of the deteriorating
geopolitical situation in the region. Preliminary ILO estimates of the impact of Syrian refugees on
local labour markets in Lebanon and Jordan show increasing informality alongside deteriorating
wage levels and working conditions (box 2.7).
Skills mismatch is another key structural challenge for the region. At present the public sector is
often one of the largest employers of workers with higher-than-average educational attainment
(World Bank, 2013). However, the ILO finds that for a number of countries, undereducation in
employment was more prevalent than overeducation.32
Accordingly, improved education for youth,
coupled with improved linkages between the government, educational institutes and the mar-
ketplace, is needed to resolve the incidence of skills mismatch and to facilitate school-to-work
transitions.
Lack of inclusive development has caused
persistent poverty and inequality
The share of the population in extreme poverty – i.e. living on less than US$1.25 a day (PPP) – is
rather low in the whole region, at around 7.4 per cent in 2012, though this was an increase from
4.1 per cent in 2010 (ESCWA, 2014). However when national poverty lines are considered, poverty
incidence rises in many countries, reaching 25 per cent in Egypt, 18 per cent in Iraq and 15 per
cent in Jordan and Tunisia. Moreover, around 23.4 per cent of Arab people were living below the
national poverty line in 2012, up from 22.7 in 1990 (ESCWA and League of Arab States, 2013).
In addition, income inequality – as measured by the Gini index – ranges from around 30 in Egypt
and Iraq to more than 40 in Morocco. High levels of income inequality are primarily a result
of the lack of adequate wage policies (minimum wages where they exist are low) and limited
31
  This figure is based on the definition of the informal economy “as the share of all employment with no access to social security” (Angel-Urdinola
and Tanabe, 2012).
32
  ILO School to Work Transition Surveys found, for instance, that in Occupied Palestinian Territories, Tunisia, Egypt and Jordan, those considered
undereducated for their employment accounted for 47.1 per cent, 31.8 per cent, 38.9 per cent and 43.0 per cent of the respondents, respectively,
with overeducated accounting for 13.2 per cent, 6.4 per cent, 8.8 per cent and 9.4 per cent, respectively.
Economic and social developments in Middle East and North Africa, 2009–19 (percentages)
2009 2012 2013 2014 2015 2016 2017 2018 2019
Labour force participation rate 48.0 48.8 49.2 49.4 49.6 49.7 49.8 49.9 50.0
Unemployment rate (total) 10.5 11.7 11.6 11.7 11.7 11.6 11.6 11.5 11.5
Youth unemployment rate 24.0 28.7 29.1 29.5 29.8 29.9 29.9 29.9 29.9
Employment growth 2.9 2.6 2.9 2.3 2.3 2.3 2.2 2.1 2.0
Youth employment growth –0.2 –1.9 –1.1 –1.6 –1.2 –0.8 –0.4 –0.2 0.0
Real wage growth –1.2 2.0 1.2 –0.5 –0.4 0.6 1.0 1.3 1.6
Productivity growth –0.5 1.2 –1.6 1.0 1.6 1.9 2.1 2.3 2.4
Note: Regional wage and productivity growth includes estimates and projections for 13 out of 19 countries. For a detailed list of countries covered by the
aggregate figures and sources of differences in the estimates in comparison with earlier publications (ILO, 2014c), please refer to Annex 4.
Source: ILO, Trends Econometric Models, October 2014; ILO, Global Wage database, December 2014; ILO Research Department.
2.10
Table
ContentsContents
532. Regional developments: An uneven and uncertain recovery
social protection. In fact, the social protection system remains comparatively underdeveloped in
the large majority of countries in the region. Social security systems usually cover public and
private sector employees only, leaving self-employed, domestic and informal workers without any
form of assistance. Indeed, the share of unemployed people covered by unemployment benefit
was just above 2 per cent in the Middle East, against the world average of over 10 per cent
(ILO, 2014m). Only Algeria, Bahrain, Egypt and Kuwait, and more recently Saudi Arabia, have made
unemployment insurance schemes available to jobseekers.
Some low- and middle-income countries in the region are also facing challenges in providing
adequate health-care services. On average, public health insurance covers only one-third of the
population, with large disparities in geographic coverage (ILO and UNDP, 2012). Public resources
invested in health-care provision are particularly limited in the Middle East subregion, where they
accounted for 2 per cent of GDP in 2013, against a world average of 2.8 per cent. Limited access
to public services leads to increasing reliance on private health services, so putting further pressure
on the incomes of vulnerable groups.
Sub-Saharan Africa
Strong economic growth rates are expected to continue
despite increasing uncertainties in the outlook
Sub-Saharan Africa continues to record strong growth rates, despite infrastructural weaknesses,
institutional challenges and limited fiscal space. In 2015 and 2016, GDP growth is expected to
reach 5.8 per cent and 6.0 per cent, respectively (IMF, 2014d).
Over the longer term, the outlook is boosted by the region’s favourable population structure. Indeed,
in 2014, Sub-Saharan Africa is estimated to have had the highest share of the population aged
10–24 of all regions, at approximately 32 per cent, compared with 27 per cent in Latin America
and the Caribbean and 25 per cent in Asia and the Pacific (UNFPA, 2014). With declining fertility
rates, this means that Sub-Saharan Africa is in the early stages of a demographic transition. Such
a transition could prompt a “demographic dividend”, as the productive capacity of the working-age
population surges with the additional labour supply. To reach this dividend, however, further invest-
ment in human capital and infrastructure, improvements in governance and better social protection
systems, in particular providing adequate health care is required to ensure sufficient productive
opportunities are available for those entering the labour market.
The labour market impact of the Syrian refugee crisis on Jordan and Lebanon
By mid-2014 the number of Syrian refugees fleeing to
the neighbouring countries of Jordan, Lebanon, Iraq
and Turkey had reached almost 3 million. According to
the UNHCR, this is the largest movement of refugees
since the Second World War. In Lebanon almost one in
every four people is a Syrian refugee. The massive inflow
of displaced people has put considerable pressure on
the already scarce natural resources and fragile public
infrastructure.
An ILO survey of 2,000 individuals found that Syrian
refugees are confronted with dire working conditions.
The average monthly income for a Syrian refugee in
Lebanon is almost 40 per cent less than the minimum
wage. Female Syrian refugees are particularly vulner-
able, earning about 40 per cent less than their male
counterparts. Informal work dominates Syrian refugee
employment, with nine out of ten Syrian refugees
employed without a formal contract and 56 per cent
working on a seasonal, weekly or daily basis. The ILO
assessment in Jordan found that Syrian refugees are
likely to be gradually integrated into the job market, but
the influx may give rise to greater incidence of irregular
employment.
Sources: ILO (2014j, 2014k).
2.7
Box
ContentsContents
54 World Employment and Social Outlook – Trends 2015
However, a number of developments will pose challenges and uncertainties. This includes the
human and economic costs of the Ebola virus (see box 2.8), as well as a potential reversal of inward
capital flows based on changes in monetary conditions in advanced economies. The immediate
effects would increase pressure on external reserves and exchange rates, prompting fiscal adjust-
ments that could compromise investment commitments and social spending. The setbacks would
weigh heavily on aggregate demand.
The region remains heavily dependent on exports of primary commodities to a few emerging
markets. Brazil, China and India collectively account for approximately 38.3 per cent of all Sub-
Saharan African exports (equivalent to around 8.3 per cent of Sub-Saharan African GDP). Fuels,
including oil and coal, make up a large share of exports to these countries, accounting for approx-
imately 55.6 per cent of the region’s total export receipts in 2013, whilst non-fuel commodities,
such as copper, platinum and gold, accounted for a further 24.8 per cent. Recent drops in
commodity prices have already put strain on growth and public finances in countries of the region,
most notably in its largest economy, Nigeria, where the fiscal break-even point is estimated to
lie above US$100 per barrel of oil whereas as of 31 December the Brent Crude price per barrel
stood at US$55, thus requiring significant budgetary adjustments and possible exchange rate
depreciation.
Meanwhile, the labour market still lacks
sufficient productive opportunities
Sub-Saharan Africa has the highest labour force participation rate of all regions, estimated at 70.9 per
cent – compared with a global average of 63.5 per cent in 2014 (see table 2.11). In addition, un-
employment at 7.7 per cent in 2014 is expected to remain stable through to 2018. In terms of youth,
the youth unemployment rate is comparatively low in relation to the adult rate, with a youth-to-adult
ratio of 1.9 – the lowest of all regions worldwide. Indeed, the youth unemployment rate was 11.8 per
cent in 2014 – only East Asia and South Asia had lower rates, at 10.5 per cent and 10.0 per cent,
respectively. Furthermore, the unemployment rate is also comparable across genders: the female
unemployment rate, at 8.7 per cent, is only marginally higher than the rate for men (6.9 per cent).
However, the quality of jobs is of considerable concern, with working poverty and vulnerable
employment the highest across all regions. In particular, nearly eight out of ten employed per-
sons in Sub-Saharan Africa were in vulnerable forms of employment. Accordingly, the vulner-
able employment rate – the share of own-account workers and unpaid family workers in total
employment – was estimated at 76.6 per cent in 2014, significantly higher than the global average of
45.3 per cent, and followed closely by South Asia at 75.6 per cent. Female vulnerable employment
(typically unpaid family work) was considerably higher than the rate for males, at 84.3 per cent
compared with 70.1 per cent for males in 2014.
Economic impact of the Ebola outbreak for the most affected countries
and the wider region
The Ebola virus in West Africa has had a significant toll
on the countries most affected, namely Guinea, Liberia
and Sierra Leone. By the end of 2014, estimates by the
World Health Organization put the human cost at around
8,000 people (WHO, 2014). In addition, the economic
costs continue to mount: tourism receipts have plum-
meted, fiscal budgets have become stretched and indus-
tries such as mining, manufacturing and agriculture are
constrained. The World Bank estimates the economic
cost to Liberia – the most affected country – to be equiv-
alent to a drop of 3.4 percentage points of GDP in 2014
(World Bank, 2014b).
For the wider region, the cost of doing business has risen
as risk aversion has affected neighbouring countries and
movement of workers and business is restricted. As such,
the World Bank estimates the economic cost to the three
core-affected countries to be around US$359 million in
2014, and expected to be between US$97 million and
US$809 million in 2015 in terms of forgone GDP. The
social impact is also likely to be long lasting, with higher
migration flows, increased poverty incidence and reduced
labour market opportunities (World Bank, 2014b).
2.8
Box
ContentsContents
552. Regional developments: An uneven and uncertain recovery
Despite progress, inequality and poverty remain endemic
Gross National Income (GNI) per capita grew by 15.5 per cent per annum between 2000 and
2012. However, this still equated to a GNI per capita of only US$1,390 in 2012, the lowest across
all regions.33
By comparison, GNI per capita was estimated for South Asia at US$1,661 in 2012,
South-East Asia at US$3,825 and East Asia at US$6,844. There was significant variation within
Sub-Saharan Africa: Eastern Africa exhibited the lowest GNI per capita, at US$622, followed by
Western Africa, at US$1,160.
The incidence of extreme poverty – measured at the US$1.25-a-day level (PPP) – was recorded
at 46.8 per cent in 2011 (latest year with data available) according to the World Bank, down from
56.6 per cent in 1990 and 57.1 per cent in 2002.34
This compares with 24.5 per cent in South Asia
(the second highest in 2011) and 7.9 per cent in East Asia and the Pacific (the third highest in 2011).
Progress has lagged behind in comparison with other regions, in particular East Asia and the Pacific.
Estimates by the African Development Bank Group find that inequality has increased in Africa since
the 1980s, but fallen slightly since the 1990s (African Development Bank Group, 2012). The levels
of inequality are found to be inversely proportional to GNI per capita, suggesting that the wealthiest
benefit disproportionately from output growth.
33
  UNCTAD statistics.
34
  World Bank PovCalnet (the online tool for poverty measurement developed by the Development Research Group of the World Bank. Available
at: http://iresearch.worldbank.org/PovcalNet/index.htm.
Economic and social developments in Sub-Saharan Africa, 2009–19 (percentages)
2009 2012 2013 2014 2015 2016 2017 2018 2019
Labour force participation rate 70.4 70.6 70.8 70.9 71.0 71.1 71.2 71.2 71.3
Unemployment rate (total) 7.9 7.9 7.7 7.7 7.7 7.7 7.7 7.7 7.6
Youth unemployment rate 12.5 12.3 11.8 11.8 11.8 11.8 11.8 11.8 11.8
Employment growth 2.8 3.1 3.3 3.1 3.1 3.1 3.1 3.0 3.0
Youth employment growth 2.2 2.7 3.3 2.7 2.7 2.7 2.7 2.7 2.6
Real wage growth 3.2 2.5 0.4 0.3 0.7 1.1 1.4 1.4 1.4
Productivity growth –1.5 0.8 0.4 1.0 1.3 1.7 1.6 1.5 1.5
Note: Regional wage and productivity growth includes estimates and projections for 15 out of 45 countries. For a detailed list of countries covered by the
aggregate figures and sources of differences in the estimates in comparison with earlier publications (ILO, 2014b), please refer to Annex 4.
Source: ILO, Trends Econometric Models, October 2014; ILO, Global Wage database, December 2014; ILO Research Department.
2.11
Table
ContentsContents
33
ContentsContents
573. Medium-term challenges for jobs with equity
Introduction
As shown in Chapter 1, the economic recovery is facing significant challenges and there is concern
that the continued weakness of global economic activity may lead to a further widening of the global
jobs gap – currently standing at 61 million – caused by the crisis.
Behind these trends, important structural factors are shaping the world of work in a profound
manner. The purpose of this chapter is to shed light on several of these structural factors and their
relation to trends in economic growth. These include: the slowdown in labour supply growth, which
is partly associated with population ageing in many parts of the world (section A); major shifts in the
demand for different skills (section B); and persistent income inequalities (section C).
In order to analyse how these structural factors may shape employment outcomes in the medium
term, the chapter identifies periods of growth acceleration and growth slowdown and examines
how structural factors interact with such periods.1
From the methodological point of view, growth
accelerations and slowdowns are detected by comparing per capita growth rates over extended
periods of time.2
A. Shrinking labour supply and population ageing
As discussed in Chapter 1, global labour markets are on the brink of a significant slowdown in the
growth of labour supply (see box 1.2). Comparing projected average annual labour force growth
until 2030 with the growth rates observed over the past two and a half decades, the largest
slowdowns are projected to occur in the Middle East and North Africa and in Latin America and
the Caribbean. Sub-Saharan Africa is the only region where labour supply will continue to rise as
rapidly as before. Globally, the slowdown of annual labour force growth amounts to almost half
a percentage point. The share of the economically most active prime-age population in total popu-
lation currently stands at 40.8 per cent, having steadily increased from 38.8 per cent in 2000.3
However, this share is projected to reach a peak of 41.0 per cent in 2017 before embarking on a
protracted downward trend, reaching 39.7 per cent in 2030.
At the same time, the number of older persons continues to rise in almost all regions. The global
labour force is estimated to become older by around one and a half months every year. In line with
1
  The reason for focusing on growth accelerations and slowdowns is that these dynamics are directly related to changes in unemployment, as
illustrated in Chapter 1 (figure 1.11).
2
  Comparisons are made with respect to per capita growth over the previous seven years with per-capita growth over the following seven years.
A growth acceleration occurs if growth rates increase by at least 2 percentage points to above 3.5 per cent. On the other hand, a country is
suffering from a growth slowdown if growth decelerates by more than 2 percentage points, coming down from above 3.5 per cent. These turning
point years then mark persistent accelerations and slowdowns of economic growth over the medium term.
3
  The prime-age population is defined as population aged 25–54.
medium-term challenges
for jobs with equity
ContentsContents
58 World Employment and Social Outlook – Trends 2015
Note: The figure shows the impact of labour supply characteristics on the likelihood of economic growth slowdowns (panel A) and accelerations
(panel B). The data points shown correspond to standardized coefficients (orange columns for point estimates and green dots for the upper
and lower bounds of the 90 per cent confidence interval), estimated with a pooled probit model described in the Appendix to this chapter. If the
confidence interval comprises only values above (below) 0, the variable on the horizontal axis has a significantly positive (negative) impact on the
likelihood that an economic growth slowdown (panel A) or acceleration (panel B) will occur.
Source: ILO Research Department estimates.
0.15
0.30
–0.15
Standardizedcoefficientestimate
–0.30
Panel A. Slowdowns
Change in average
labour force age
Average labour
force age
Female labour force
participation rate
Share of prime-age
population
J
J
J
J
J
J
J
J
0
0.30
0.45
0.60
0.75
Standardizedcoefficientestimate
–0.15
Panel B. Accelerations
Change in average
labour force age
Average labour
force age
Female labour force
participation rate
Share of prime-age
population
0.15
J
J
J
J
J
J
J
J
0
3.1
Figure
Impact of labour supply characteristics on the probability
of economic growth slowdowns and accelerations
these figures, the share of older workers aged 55 or above in the global labour force expanded from
10.5 per cent in 1990 to a hitherto unseen 14.3 per cent in 2014. By 2030, the number of older
workers in the labour force is projected to increase by a further 270 million to almost 750 million
workers, which will then correspond to more than 18 per cent of the total labour force.
Increased female labour force participation has the potential to offset both shrinking labour supply
and labour force ageing. A rise in female labour force participation rates has been observed in many
regions, even though female labour force participation at the global level has been on a decline,
standing at 50.3 per cent in 2014 compared with 51.9 per cent in 2000. This overall decline has
been driven by East Asia and South Asia as well as some developed economies (e.g. the United
States) whereas female labour force participation rates have increased in all other regions.4
4
  Trends in South Asia are primarily shaped by India, which has seen a rapid decline in female participation rates, partly driven by increased
educational attendance and higher household incomes (Kapsos et al., 2014).
ContentsContents
593. Medium-term challenges for jobs with equity
Shrinking prime-age population affects economic growth…
Economies with a lower incidence of prime-age population are less likely to experience economic
growth accelerations (see figure 3.1), as this typically entails a contraction in the size of the work-
force. This can lead to labour shortages and thus constrain economic growth unless older workers
remain in the workforce for longer periods. Moreover, for some vacancies, employers might find
it more difficult to make a suitable match, forgoing increases in output (ManpowerGroup, 2013).
Conversely, an increase in the incidence of prime-age population tends to support economic growth.
Medium-term growth prospects are affected by both the average age and the process of ageing
of the labour force, albeit in opposite directions. A fast-ageing labour force leads to a higher inci-
dence of economic growth slowdowns (figure 3.1). However, economies that have a labour force
that is older on average are, if anything, more likely to experience growth accelerations. In other
words, rather than the age of the labour force, it is the ageing of the labour force that makes an
economy more vulnerable to economic growth slowdowns. Among possible explanations for these
differing effects is that economies in which the labour force is rapidly ageing may experience
skills mismatches and may have to adapt the workplace to the needs of older workers, which may
entail costs. On the other hand, the estimated positive impact of an older workforce might be
explained by more effective technology adoption, as older workers’ greater experience may help
them to judge more accurately whether a new technology will be beneficial to work processes. In
general, older workers may also be more inclined to adopt new technologies, given that techno-
logical progress often operates in their favour, allowing them to replace physically demanding
tasks with cognitive tasks, for which they may be better equipped than less experienced younger
workers (Weinberg, 2002; Gordo and Skirbekk, 2013). Measures such as the promotion of team-
work between different generations can also enhance the productivity of enterprises (Göbel and
Zwick, forthcoming). Older workers’ participation in the labour force can be encouraged through
policies that remove tax and other penalties for work by those receiving pensions and address
the effect of future pension accumulation.
… while higher female participation is beneficial to economic growth
Economies with high female labour force participation rates experience economic growth slow-
downs less often, indicating a higher resilience to adverse economic shocks (figure 3.1). With more
women in the labour market, an economy makes greater use of its productive potential. Moreover,
female labour force participation also presents a powerful anti-poverty device.5
Policies that encourage female labour force participation are, therefore, likely to make economies
less vulnerable to economic growth slowdowns. Such policies include measures that facilitate
women’s participation by allowing parents to balance work and family responsibilities, such as avail-
ability of more flexible working-time arrangements, maternity and parental leave and the provision
of affordable childcare facilities. They also include policies that encourage women to join the labour
force by improving women’s pay through measures such as minimum wage increases to tackle the
over-representation of women in low-wage jobs and anti-discrimination policies that are actively
enforced. Other policy areas include tax policy to eliminate tax penalties for the second earner in
a household as well as supportive educational policies to improve career options and progression
for women.
5
  If household incomes are based on the labour incomes from paid work of more than one household member, the risk that households lose all
their labour income and slip into poverty as a consequence of an adverse macroeconomic shock is lessened, in particular if different household
members work in sectors and occupations that are asymmetrically affected by economic downturns. This in turn lowers the likelihood of adverse
household consumption shocks leading to growth slowdowns.
ContentsContents
60 World Employment and Social Outlook – Trends 2015
B. Changes in occupational patterns
As discussed in Chapter 1, the share of low-skilled non-routine manual jobs has declined at the
global level, while the share of high-skilled non-routine cognitive jobs has increased. The incidence
of traditional occupations (such as shoemaker, blacksmith and carpenter) has been gradually
declining in developed economies, while new occupations such as software engineer, business
consultant and product marketing manager are emerging. Importantly, medium-skilled routine jobs
have slowly but steadily been disappearing over the recent years (see box 3.1).6
These occupational changes have not only shaped employment patterns, but they may have
also contributed to the widening of income inequality recorded over the past couple of decades.
Earnings data for developed economies illustrate that non-routine cognitive jobs pay considerably
higher wages, on average, than routine and non-routine manual occupations.7
An increase in
the number of jobs at both the lower and upper ends of the skills ladder at the expense of
6
  The classification of jobs into routine, non-routine cognitive and non-routine manual occupations follows Autor et al. (2003) and Jaimovich and
Siu (2012) and is based on the International Standard Classifications of Occupations (ISCO).
7
  This ranking of occupations in terms of earnings holds, for example, in the European Union and in the United States. In the EU-28, average
hourly earnings in non-routine cognitive occupations are €19.36 while routine and non-routine manual occupations respectively pay €10.66
and €10.13 (Eurostat, 2010). In the United States, non-routine cognitive occupations pay on average US$33.81, while earnings in routine and
non-routine manual occupations are respectively US$18.78 and US$14.93 (BLS, 2013).
The hollowing-out of medium-skilled jobs
Technological progress is often cited as the main cause
of the hollowing-out of medium-skilled jobs in developed
countries. New technologies – such as information and
communication technologies (ICT) – have been replacing
routine tasks (Autor et al., 2003; Goos and Manning,
2007), which are repetitive tasks characteristic of many
medium-skilled cognitive and production activities such
as bookkeeping and clerical work. New technologies
have raised relative demand for non-routine tasks that
depend on high skill levels, such as lawyers, and manual
tasks that require little in the way of formal education,
such as janitors and security personnel (Autor, 2010). In
addition, countries with faster upgrading of ICT such as
Finland, the Netherlands, the United Kingdom and the
United States also saw the most rapid increase in high-
skilled workers and replacement of medium-skilled jobs
(Michaels et al., 2010). However, this rapid technological
progress does not necessarily reduce the overall demand
for labour. It simply shifts the demand to different types
of work, including new occupations that might not have
existed before (Brynjolfsson and McAfee, 2014).
Globalization has also been cited as a cause of job
polarization to higher and lower skilled occupations, with
possible effects on inequality. Freer international trade
has raised the relative cost of production in developed
economies by eliminating many tariff wedges. Lower
labour cost in developing countries and falling transpor-
tation costs make overseas production a more favour-
able option. This has led to offshoring of certain parts
of the production process, contributing to changes in
the employment structure and to the fall in many medi-
um-skilled manufacturing jobs in advanced economies.
Moreover, this process has led to changing income levels
for workers across the occupation and skill spectrum.
Although the manufacturing sector has recovered in
some advanced economies in the past few years, the
jobs that are returning are more often temporary and
with lower pay. Former medium-skilled workers who are
able to secure new employment often find themselves
earning significantly less than before (Ruckelshaus and
Leberstein, 2014). Outsourcing also puts direct pressure
on the wages of workers in manufacturing, as foreign
competition pushes down the price of goods and forces
employers to cut cost (Bivens, 2008). Finally, some
of those with higher education attainment and skills
enjoy higher earnings for jobs in science, engineering
and management (Zaccone, 2012), although some
college‑educated workers also face wage stagnation in
some advanced economies.
Policy choices by governments have also been consid-
ered as possible causes of changing conditions of work
for different types of occupations. This includes trade
policies, industry deregulation, minimum wage policies
and policies that weaken collective bargaining and union
representation (Mishel et al., 2014). Their role is also dis-
cussed in the context of widening income gaps, espe-
cially the wage disparity between medium-skilled and
high-skilled jobs (idem, 2012).
3.1
Box
ContentsContents
613. Medium-term challenges for jobs with equity
medium-skilled routine jobs hence contributes to a rise in income inequality (this is the case even
if wages remain unchanged). This finding is in line with the trends in inequality that have been
observed in some of the larger advanced economies.
In developing countries, changes in living standards and occupational employment shifts are closely
associated with each other (see figure 3.2). A larger share of high-skilled non-routine cognitive
occupations and, to a lesser extent, of medium-skilled routine jobs can be associated with a lower
working poverty rate and a larger middle class. Conversely, a larger share of low-skilled non-routine
manual occupations is, on average, associated with a higher prevalence of poverty among workers
and a smaller middle class. Hence, in many developing countries, the trends in the occupational
employment structure that were discussed in Chapter 1 are likely to have triggered some of the
observed improvements in workers’ living conditions, shifting many workers into a prospering and
rapidly increasing middle class.
The number of routine jobs has decreased not only in advanced economies, but also in a number
of developing economies for which data are available (e.g. Malaysia, South Africa and Thailand).
A large number of these occupations (e.g. machine operators or assemblers) are in the manufac-
turing sector. This has raised some concerns, given that jobs in manufacturing can potentially help
workers to escape poverty (see ILO, 2013d; box 3.2). Non-routine cognitive occupations in cities
might not be easily accessible to workers without sufficient formal education. These trends are
likely to result in higher inequality, since they further raise the barriers preventing poor workers from
moving up the economic and social ladder. Addressing these mismatches remains one of the key
development challenges in the medium term.
Note: This chart shows cross-country-time correlations between shares of employment by occupation and estimated shares of employment by
economic class in an unbalanced panel of 667 observations, covering the period 1991–2013. A positive (negative) correlation indicates that
a higher share of the considered occupation in total employment is associated with a higher (lower) incidence of employment in the economic
class under consideration. All correlations are statistically significant at the 1 per cent level.
Source: ILO Research Department calculations based on ILO, Trends Econometric Models, October 2014; Kapsos and Bourmpoula (2013).
0.35
0.70
–0.35
–0.70
0
Non-routine manual occupations
Routine occupations
Non-routine cognitive occupations
Extremely poor Moderately poor Near poor Developing
middle class
Developed middle class
and above
J J
J
J J
J J
J
J
J
J J
J
J
J
3.2
Figure
Correlations between type of occupation and income levels,
developing economies, 1991–2013
ContentsContents
62 World Employment and Social Outlook – Trends 2015
Is premature de-industrialization a concern?
In the history of economic development, manufacturing
has often played a key role in job creation, attracting
rural agricultural workers into cities, where they were
able to earn considerably higher wages. This process
of structural transformation has helped many countries
move up the income ladder, from low-income to mid-
dle-income status, underlining the importance of manu-
facturing for economic development (see ILO, 2014l).
Export sectors, which are often exposed to more compe-
tition, may require enterprises to continuously improve
productivity, which can also have a positive impact on
economic growth. Relating changes in manufacturing
employment shares to medium-term changes in eco-
nomic growth suggests that faster declines in the manu-
facturing employment share make economies more
vulnerable to adverse shocks and cause slowdowns of
economic growth (see figure 3.3).
Some observers therefore expressed some concern
about the phenomenon of premature de-­industrialization
of developing countries that has recently been identi-
fied (Rodrik, 2013; Subramanian, 2014; Felipe et al.,
2014). Countries seem to start de-industrializing earlier
on their path of economic development and peak levels
of manufacturing output and employment are consid-
erably lower than in the past (figure 3.4). With earlier
de-­industrialization, low-income countries that currently
aim to catch up might face more difficulties in replicating
earlier successes in economic development.
3.2
Box
Note: The figure shows the impact of manufacturing employment changes on the likelihood of economic growth slowdowns (panel A) and accelerations (panel B).
The data points shown correspond to standardized coefficients (orange columns for point estimates and green dots for the upper and lower bounds of the 90 per
cent confidence interval), estimated with a pooled probit model described in the Appendix to this chapter. If the confidence interval comprises only values
above (below) 0, the variable on the horizontal axis has a significantly positive (negative) impact on the likelihood that an economic growth slowdown (panel A)
or acceleration (panel B) will occur.
Source: ILO Research Department estimates.
Panel A. Slowdowns Panel B. Accelerations
–0.06
0
–0.18
Standardizedcoefficientestimate
–0.24
–0.12
0
0.08
Standardizedcoefficientestimate
–0.16
–0.08
J
J
J J
J
J
J
J
Share of
manufacturing
employment
(annual change)
Share of
manufacturing
employment
(3-year change)
Share of
manufacturing
employment
(annual change)
Share of
manufacturing
employment
(3-year change)
3.3
Figure
Impact of manufacturing employment changes on the probability
of economic growth slowdowns and accelerations ContentsContents
633. Medium-term challenges for jobs with equity
Is premature de-industrialization a concern? (cont.)
A consensus has not yet been established regarding
the main driving forces and consequences of prema-
ture de-industrialization. One potential explanation is
the changing nature of trade, which is now based on
complex global supply chains, where most of the value
added is generated through the marketing, engineering
or design of products rather than the actual manufac-
turing process, which leaves less rents to be absorbed
by manufacturers. Moreover, rising incomes may have
created changes in demand, shifting demand from
manufacturing goods to services. However, the extent to
which services can take over the role of manufacturing
and facilitate the convergence of developing to developed
countries is still under scrutiny (Ghani and O’Connell,
2014). A more pessimistic view emphasizes the partial
non-tradability of services and the limitations of product-
ivity gains in their production (Rodrik, 2014), suggesting
that the preservation of manufacturing employment is
likely to be an important ingredient for economic devel-
opment of low-income countries in the future.
Note: This chart shows (i) when different countries are at their peak manufacturing employment share, and (ii) what level this share reaches in that peak year.
The chart identifies peak years on the basis of a database that includes estimates and projections of the manufacturing employment share for 1991–2019.
It illustrates that, more recently, employment peaks in manufacturing are lower than they used to be in the past.
Source: ILO Research Department calculations based on ILO, Trends Econometric Models, October 2014.
20
25
10
5
15
1993 1994 1995 1996 1997 1998 1999 2000 2001 2002 2003 2004 2005 2006 2007 2008 2009 2010 2011 2012
Argentina
Bangladesh
Bhutan
Botswana
Chile
China
Costa Rica
Cuba
El Salvador
Ghana
Honduras
India
Indonesia
Madagascar
Mexico
Nicaragua
Pakistan
Panama
Paraguay Peru
Philippines
Senegal
Sri Lanka
Thailand
Venezuela
J
J
J
J
J
J
J
J
J
J
J
JJ
J
J
J
J
J
J
J
J
J
J
J
J
20131992
Percentoftotalemployment
3.4
Figure
Share of workers in manufacturing employment when manufacturing
employment was at its peak, 1992–2013 (percentages)
ContentsContents
64 World Employment and Social Outlook – Trends 2015
C. Income inequality and economic growth
accelerations and slowdowns
Income inequalities may have contributed to
the ongoing global economic weakening
Recent evidence points to a link between income inequality and less persistent economic growth,
as described in Chapter 1. Some studies show that lower income inequality is associated with a
higher persistence of economic growth or, put differently, longer growth spells (Berg and Ostry,
2011; Ostry et al., 2014). Tackling excessive income inequality can therefore be an important
policy response to rekindle economic growth and foster long-term development. Moreover, lower
inequality can boost aggregate demand by shifting income to those that have a high propensity to
consume, which in turn has the potential to increase economic growth (OECD, 2012; Stiglitz, 2013;
Cingano, 2014).8
Lower inequality can also enhance socio-political cohesion, and it may increase
support for growth-friendly policies and reduce business uncertainty (Alesina and Perrotti, 1996).
8
  Higher inequalities may also hamper economic growth in the longer term. For instance, economies where a large share of the population has
no access to credit markets may suffer from under-investment in education and health, which can adversely affect long-term economic growth
(Galor and Zeira, 1993; Cingano, 2014). Finally, higher income inequality tends to fuel the rising rates of household leverage that make economies
vulnerable to financial crises (Rajan, 2010; Kumhof and Rancière, 2010).
Note: The figure shows the impact of inequality (measured with the Gini index that lies between 0 and 100 and increases
with rising inequality) on the likelihood of economic growth slowdowns (panel A) and accelerations (panel B). The data
points shown correspond to coefficients (orange columns for point estimates and green dots for the upper and lower bounds
of the 90 per cent confidence interval), estimated with a pooled probit model described in the Appendix to this chapter.
Where applicable, the multiple imputation nature of the inequality data are taken into account in the estimation procedure.
If the confidence interval comprises only values above (below) 0, the variable on the horizontal axis has a significantly pos-
itive (negative) impact on the likelihood that an economic growth slowdown (panel A) or acceleration (panel B) will occur.
Source: ILO Research Department estimates.
0.06
Gini, consumption
(World Bank WDI)
Gini, net income
(SWIID; Solt, 2014)
Gini, market income
(SWIID; Solt, 2014)
0.02
0.04
–0.02
Coefficientestimate
–0.04
Panel A. Slowdowns
J
J
J
J
J
J
Gini, consumption
(World Bank WDI)
Gini, net income
(SWIID; Solt, 2014)
Gini, market income
(SWIID; Solt, 2014)
0.03
Coefficientestimate
0.09
Panel B. Accelerations
J
J
J
J
J
J
0
0
3.5
Figure
Impact of income inequality on the probability
of economic growth slowdowns and accelerations
ContentsContents
653. Medium-term challenges for jobs with equity
Further analysis presented in this chapter sheds light on how inequalities may contribute to
explaining the fragile and uneven economic recovery presently underway. The findings, as illus-
trated in figure 3.5, provide evidence on the role of inequality in slowdowns and accelerations of
economic growth. The evidence suggests that higher inequality tends to be related with a higher
risk of an economic slowdown – this is at least the case when considering inequality of market
incomes (i.e. incomes before taxes and transfers). In contrast, lowering inequality may help to coun-
teract the economic slowdown currently observed in many economies. A reduction in inequality
indeed appears to provide the necessary prerequisites for economies to experience accelerations
of economic growth. Since growth slowdowns can be associated with higher unemployment rates
and growth accelerations with less unemployment, as shown in Chapter 1, less inequality is also
likely to be beneficial to the labour market, preventing a further widening of the jobs gap that has
opened up since the onset of the crisis.
Concluding remarks
This chapter demonstrates the importance of recent developments regarding global trends in labour
markets and income inequality for medium-term perspectives of growth and employment. In par-
ticular, the chapter presents new evidence on how population ageing, changes in occupational skill
demand and increases in personal income inequality have weighed on global economic growth.
Therefore, policies to address these changes need to be incorporated into overall strategies to
strengthen growth. Previous ILO analyses have examined how this can be achieved, through a com-
bination of macroeconomic policies, employment and wage policies (ILO, 2013d, 2014a, 2014b).
ContentsContents
66 World Employment and Social Outlook – Trends 2015
Appendix
Data description and methodology: The relationship between labour market
characteristics and economic growth slowdowns and accelerations
This chapter relates labour market characteristics to economic growth slowdowns and accelera-
tions on the basis of pooled probit regressions. The two alternative dependent variables in these
regressions are dummy variables, constructed on the basis of data on GDP per capita growth for
1950–2011 from Penn World Tables 8.0. These dummy variables have a value of 1 in years that
can be identified as growth slowdown years or, alternatively, as growth acceleration years, and are
0 otherwise. To identify such slowdowns and accelerations of economic growth, this chapter follows
closely the methodology of Eichengreen et al. (2012 and 2013) and defines year t as a growth
slowdown year if the following two conditions are fulfilled:
gt,t–7 ≥ 0.035
gt,t–7 – gt,t+7 ≥ 0.02
where gt,t–7 is the average annual GDP per capita growth rate between t–7 and t, and gt,t+7 is the
average annual GDP per capita growth rate between t and t+7.9
Symmetrically, growth acceleration
years are identified similarly as in Hausman et al. (2005), imposing that:
gt,t+7 ≥ 0.035
gt,t+7 – gt,t–7 ≥ 0.02
In words, years are identified as growth slowdown (acceleration) years if average per capita growth
in the past (coming) seven years was above 3.5 per cent and, in addition, by more than 2 per-
centage points higher than average growth in the coming (past) seven years.10
The comparison of
the past seven years with the coming seven years takes a medium-term perspective and is likely
to avoid an identification of slowdowns and accelerations merely on the basis of business cycle
movements.
The following two equations are estimated:
Pr (SLWt = 1) = Φ (α + βΧt + γ Lt  )
Pr (ACCt = 1) = Φ (α + βΧt + γ Lt  )
where SLWt (ACCt) is the slowdown (acceleration) dummy variable (constructed on the basis
of data on economic growth between t – 7 and t + 7). Φ(.) is the normal cumulative distribution
function, Χt is a vector of control variables and Lt is a vector of variables measuring a selection of
structural labour market characteristics or changes thereof.
Control variables are chosen in line with Eichengreen et al. (2012 and 2013). Since the probabilities
of a country experiencing an economic growth slowdown or an acceleration are likely to depend
non-linearly on the level of economic development (figure A.1), regressions control for GDP per
capita and its square. Moreover, regression control for the ratio (and its square) of a country’s
GDP per capita to the leading countries’ GDP per capita. Finally, pre-slowdown (pre-acceleration)
economic growth is included as a control variable. All these variables are taken from or constructed
on the basis of Penn World Tables 8.0. Data on structural labour market characteristics or changes
thereof, focused on in this chapter, are from various sources (table A.1).
Tables A.2 and A.3 show the full regression results presented in this chapter. There are alternative
ways of defining economic growth slowdowns and accelerations (Aiyar et al., 2013; Eichengreen
et al., 2012 and 2013). For a series of robustness checks and more extensive results, please see
Viegelahn (forthcoming).
9
  This implies that growth slowdowns and accelerations are not defined in the seven years at the end of our sample, which drop out of the analysis.
10
  Eichengreen et al. (2012 and 2013), in addition, impose that GDP per capita (in 2005 constant PPP US$) should be larger than 10,000, since
they intend to identify only middle-income growth traps.
ContentsContents
673. Medium-term challenges for jobs with equity
Note: GDP per capita is in constant 2005 US$ (chained PPP).
Source: ILO Research Department calculations.
12
16
4
Panel A. Slowdowns
8
12
16
4
Panel B. Accelerations
8
0–2000 2–4000 4–6000 6–8000 8–10000 10–12000 12–14000 14000
0–2000 2–4000 4–6000 6–8000 8–10000 10–12000 12–14000 14000
0
0
A.1
Figure
Share of economic growth slowdowns and accelerations in total number
of observations, by income per capita level (percentages)
Data sources for labour market variables
Variable Data source
Prime-age population share UN, World Population Prospects, the 2012 Revision
Average labour force age* ILO Research Department calculations based on ILO, EAPEP Database, October 2014
Female labour force participation ILO, EAPEP Database, October 2014
Manufacturing employment share ILO, Trends Econometric Models, October 2014
Gini (World Bank) World Bank, World Development Indicators
Gini net (Solt database) Standardized World Income Inequality Database (Solt, 2014)
Gini market (Solt database) Standardized World Income Inequality Database (Solt, 2014)
*  To calculate a proxy for the average labour force age, labour force aged 65+ is assumed to have an average age of 67.5. Labour force in five-year
age group intervals is assumed to have an average age that corresponds to the centre of the five-year interval.
A.1
Table
ContentsContents
68 World Employment and Social Outlook – Trends 2015
Determinants of economic growth slowdowns
Dependent variable: SLW
(slowdown)
(1)
Labour
supply
(2)
Sector
(3)
Sector
(4)
Income
inequality
(5)
Income
inequality
(6)
Income
inequality
GDP per capita 0.036
(0.050)
–0.111
(0.072)
–0.070
(0.085)
–0.534*
(0.308)
0.077***
(0.029)
0.071***
(0.027)
(GDP per capita)^2 –0.000
(0.000)
0.002**
(0.001)
0.002
(0.001)
0.028**
(0.013)
–0.001
(0.001)
–0.001
(0.000)
Ratio 3.541
(0.077)
12.001***
(4.502)
9.808*
(5.550)
68.352***
(24.713)
–1.641
(1.538)
–1.556
(1.506)
Ratio^2 –3.525
(2.788)
–12.026***
(4.383)
–11.575**
(5.361)
–200.69***
(74.678)
0.655
(1.516)
0.681
(1.501)
Pre-slowdown growth 0.785***
(2.201)
0.609***
(0.055)
0.614***
(0.061)
0.474***
(0.067)
0.515***
(0.024)
0.525***
(0.025)
Annual change in average labour force age 0.959**
(0.489)
Labour force age 0.057
(0.047)
Female labour force participation –0.035***
(0.010)
Prime-age population share –0.006
(0.030)
Manufacturing employment share
(annual change)
–0.261**
(0.121)
Manufacturing employment share
(change over 3 years)
–0.131*
(0.076)
Gini, consumption (World Bank, WDI) –0.002
(0.022)
Gini, net income (SWIID; Solt, 2014) 0.007
(0.007)
Gini, market income (SWIID; Solt, 2014) 0.013*
(0.007)
Pseudo R2 0.57 0.50 0.49 0.53 – –
Number of observations 1069 798 638 320 2837 2836
Note: Pooled probit coefficient estimates. Standard errors are reported in brackets. Ratio refers to the ratio of a country’s GDP per capita to the leading country’s
GDP per capita.
*/**/*** denotes significance at the 10/5/1 per cent level.
A.2
Table
ContentsContents
693. Medium-term challenges for jobs with equity
Determinants of economic growth accelerations
Dependent variable: ACC
(acceleration)
(1)
Labour
supply
(2)
Sector
(3)
Sector
(4)
Income
inequality
(5)
Income
inequality
(6)
Income
inequality
GDP per capita –0.224***
(0.039)
0.023
(0.060)
–0.035
(0.069)
0.431**
(0.205)
–0.134***
(0.027)
–0.113***
(0.026)
(GDP per capita)^2 0.003***
(0.001)
–0.001
(0.001)
–0.000
(0.001)
–0.031***
(0.011)
0.002**
(0.001)
0.001*
(0.001)
Ratio 7.243***
(2.544)
2.516
(3.363)
6.643
(4.048)
–14.042
(10.944)
8.143***
(1.532)
7.794***
(1.507)
Ratio^2 –10.601***
(2.881)
–7.104*
(4.002)
–10.711**
(4.853)
58.144*
(30.656)
–11.516***
(2.254)
–10.838***
(2.207)
Pre-acceleration growth –0.144***
(0.024)
–0.150***
(0.029)
–0.120***
(0.035)
–0.101***
(0.025)
–0.083***
(0.011)
–0.085***
(0.011)
Annual change in average labour force age –0.214
(0.276)
Labour force age 0.050*
(0.030)
Female labour force participation 0.002
(0.005)
Prime-age population share 0.143***
(0.020)
Manufacturing employment share
(annual change)
0.009
(0.075)
Manufacturing employment share
(change over 3 years)
–0.058
(0.049)
Gini, consumption (World Bank, WDI) –0.061***
(0.012)
Gini, net income (SWIID; Solt, 2014) –0.018***
(0.004)
Gini, market income (SWIID; Solt, 2014) –0.018***
(0.004)
Pseudo R2 0.24 0.14 0.12 0.15 – –
Number of observations 1069 798 638 320 2837 2836
Note: Pooled probit coefficient estimates. Standard errors are reported in brackets. Ratio refers to the ratio of a country’s GDP per capita to the leading country’s
GDP per capita.
*/**/*** denotes significance at the 10/5/1 per cent level.
A.3
Table
ContentsContents
Title
AnnexesAnnexes
ContentsContents
71Annex 1. Global and regional figures
Annexes
 World, pp. 72–73
 Developed Economies and European Union, pp. 74–75
 Central and South-Eastern Europe (non EU) and CIS, pp. 76–77
 East Asia, pp. 78–79
 South-East Asia and the Pacific, pp. 80–81
 South Asia, pp. 82–83
 Latin America and the Caribbean, pp. 84–85
 Middle East and North Africa, pp. 86–87
 Sub-Saharan Africa, pp. 88–89
In the Employment-growth-by-sector charts the sectors are classified according to ISIC 2008, rev.4:
 A = Agriculture, forestry, hunting and fishing
 B = Mining and quarrying
 C = Manufacturing
 D and E = Utilities (electricity, gas, etc.)
 F = Construction
 G = Wholesale and retail trades, repair of motor vehicles, motorcycles and personal and household goods
 I = Accommodation and restaurants
 H and J = Transport, storage and communication
 K = Financial activities
 P = Education
 Q = Health and social work activities
 O = Public administration and defence, compulsory social security
 L, M and N = Real estate, business and administrative activities
 Others
1
Global and regional figures
ContentsContents
72 World Employment and Social Outlook – Trends 2015
Annexes
1
Global and regional figures World
50
100
150
200
250
20
01
20
00
20
02
20
03
20
04
20
05
20
06
20
07
20
08
20
09
20
10
20
11
20
12
20
13
20
14
20
15
20
16
20
17
20
18
20
19
Total unemployment (millions)
63.5
64.5
65.5
20
01
20
00
20
02
20
03
20
04
20
05
20
06
20
07
20
08
20
09
20
10
20
11
20
12
20
13
20
14
20
15
20
16
20
17
20
18
20
19
Labour force participation rate (%)
1000
2000
3000
4000
20
01
20
00
20
02
20
03
20
04
20
05
20
06
20
07
20
08
20
09
20
10
20
11
20
12
20
13
20
14
20
15
20
16
20
17
20
18
20
19
Total employment (millions)
15
30
45
60
20
01
20
00
20
02
20
03
20
04
20
05
20
06
20
07
20
08
20
09
20
10
20
11
20
12
20
13
20
14
20
01
20
00
20
02
20
03
20
04
20
05
20
06
20
07
20
08
20
09
20
10
20
11
20
12
20
13
20
14
Employment by occupation – Type of task (%)
5.4
5.8
6.2
6.6
20
01
20
00
20
02
20
03
20
04
20
05
20
06
20
07
20
08
20
09
20
10
20
11
20
12
20
13
20
14
20
15
20
16
20
17
20
18
20
19
Total unemployment rate (%)
8.0
12.0
16.0
20
01
20
00
20
02
20
03
20
04
20
05
20
06
20
07
20
08
20
09
20
10
20
11
20
12
20
13
20
14
20
15
20
16
20
17
20
18
20
19
Youth unemployment rate (%)
59.5
60.5
61.5
20
01
20
00
20
02
20
03
20
04
20
05
20
06
20
07
20
08
20
09
20
10
20
11
20
12
20
13
20
14
20
15
20
16
20
17
20
18
20
19
Total employment-to-population ratio (%)
20
40
60
80
Employment by occupation – Skill level (%)
Non-routine cognitive occupations
Routine occupations
Non-routine manual occupations
Low skills
Medium skills
High skills
0
62.5
0
0
5.0
4.0
58.5
0
Estimate
Projections
Lower and upper boundPoint projection
Estimate
Projections
Lower and upper boundPoint projection
Projection
Estimate
Projections
Lower and upper boundPoint projection
Estimate
Projections
Lower bound Point projection Upper bound
Estimate
Projections
Lower bound Point projection Upper bound
ContentsContents
73Annex 1. Global and regional figures
Annexes
World Global and regional figures
1
20
01
20
00
20
02
20
03
20
04
20
05
20
06
20
07
20
08
20
09
20
10
20
11
20
12
20
13
Working poor (millions) – US$2/day Working poor as a share
of total employment (%)
Developing middle class US$4–13/day
(millions)
Developing middle class as a
share of total employment (%)
1
2
3
4
20
01
20
00
20
02
20
03
20
04
20
05
20
06
20
07
20
08
20
09
20
10
20
11
20
12
Real wage growth (%)
–25.2
–24.8
–24.4
–24.0
20
01
20
00
20
02
20
03
20
04
20
05
20
06
20
07
20
08
20
09
20
10
20
11
20
12
20
13
20
14
20
15
20
16
20
17
20
18
20
19
Gender gap: difference between male and female
employment-to-population ratios (percentage points)
0.35
0.70
1.05
1.40
Social unrest (in percent of all events) (%)
0
1
2
3
4
20
13
5
20
01
20
00
20
02
20
03
20
04
20
05
20
06
20
07
20
08
20
09
20
10
20
11
20
12
20
13
20
14
20
15
20
16
20
17
20
18
20
19
Productivity growth (%)
20
01
20
00
20
02
20
03
20
04
20
05
20
06
20
07
20
08
20
09
20
10
20
11
20
12
20
13
20
14
20
15
20
16
20
17
20
18
20
19
Employment growth by sector (%)
20
14
280 10
560 20
840 30
1120 40
1400 50
20
01
20
00
20
02
20
03
20
04
20
05
20
06
20
07
20
08
20
09
20
10
20
11
20
12
20
13
Vulnerable employment (millions) Share of vulnerable employment (%)
20
14
1340
1360
1380
1400
1420
1460
1440
1480
43.5
47.0
50.5
54.0
40.0
20
01
20
00
20
02
20
03
20
04
20
05
20
06
20
07
20
08
20
09
20
10
20
11
20
12
20
13
20
14
A
B
C
DE
F
G
I
HJ
K
P
Q
O
L, M  N
Others
0 5 10
0
–25.6
0
–1
0 0
1320
20
01
20
00
20
02
20
03
20
04
20
05
20
06
20
07
20
08
20
09
20
10
20
11
20
12
20
13
20
14
200 7
400 14
600 21
800 28
1000 35
0 0
Working poor US$2/day
Working poor as a share
of total employment
Projection
Projection
Vulnerable employment
Share of vulnerable employment
Projection
Projection
Developing middle class US$4–13/day
Developing middle class as a share
of total employment
Projection
Projection
Projection
Projection
Projection
ContentsContents
74 World Employment and Social Outlook – Trends 2015
Annexes
1
Global and regional figures Developed Economies and European Union
10
20
30
40
50
20
01
20
00
20
02
20
03
20
04
20
05
20
06
20
07
20
08
20
09
20
10
20
11
20
12
20
13
20
14
20
15
20
16
20
17
20
18
20
19
Total unemployment (millions)
59.2
59.6
60.0
60.4
60.8
20
01
20
00
20
02
20
03
20
04
20
05
20
06
20
07
20
08
20
09
20
10
20
11
20
12
20
13
20
14
20
15
20
16
20
17
20
18
20
19
Labour force participation rate (%)
450
480
510
20
01
20
00
20
02
20
03
20
04
20
05
20
06
20
07
20
08
20
09
20
10
20
11
20
12
20
13
20
14
20
15
20
16
20
17
20
18
20
19
Total employment (millions)
15
30
45
20
01
20
00
20
02
20
03
20
04
20
05
20
06
20
07
20
08
20
09
20
10
20
11
20
12
20
13
20
14
20
01
20
00
20
02
20
03
20
04
20
05
20
06
20
07
20
08
20
09
20
10
20
11
20
12
20
13
20
14
Employment by occupation – Type of task (%)
6
7
8
9
20
01
20
00
20
02
20
03
20
04
20
05
20
06
20
07
20
08
20
09
20
10
20
11
20
12
20
13
20
14
20
15
20
16
20
17
20
18
20
19
Total unemployment rate (%)
13
16
19
20
01
20
00
20
02
20
03
20
04
20
05
20
06
20
07
20
08
20
09
20
10
20
11
20
12
20
13
20
14
20
15
20
16
20
17
20
18
20
19
Youth unemployment rate (%)
54.5
55.5
56.5
57.5
20
01
20
00
20
02
20
03
20
04
20
05
20
06
20
07
20
08
20
09
20
10
20
11
20
12
20
13
20
14
20
15
20
16
20
17
20
18
20
19
Total employment-to-population ratio (%)
15
30
45
60
Employment by occupation – Skill level (%)
0
58.8
420
0
5
10
53.5
0
Estimate
Projections
Lower and upper boundPoint projection
Estimate
Projections
Lower and upper boundPoint projection
Estimate
Projections
Lower and upper boundPoint projection
Estimate
Projections
Lower bound Point projection Upper bound
Estimate
Projections
Lower bound Point projection Upper bound
Non-routine cognitive occupations
Routine occupations
Non-routine manual occupations
Low skills
Medium skills
High skills
Projection
ContentsContents
75Annex 1. Global and regional figures
Annexes
1
Developed Economies and European Union Global and regional figures
–1
0
1
2
3
4
5
20
01
20
00
20
02
20
03
20
04
20
05
20
06
20
07
20
08
20
09
20
10
20
11
20
12
20
13
20
14
20
15
20
16
20
17
20
18
20
19
Real wage growth (%)
–16
–12
–8
20
01
20
00
20
02
20
03
20
04
20
05
20
06
20
07
20
08
20
09
20
10
20
11
20
12
20
13
20
14
20
15
20
16
20
17
20
18
20
19
Gender gap: difference between male and female
employment-to-population ratios (percentage points)
0.3
0.6
0.9
1.2
Social unrest (in percent of all events) (%)
–1
0
1
2
3
20
01
20
00
20
02
20
03
20
04
20
05
20
06
20
07
20
08
20
09
20
10
20
11
20
12
20
13
20
14
20
15
20
16
20
17
20
18
20
19
Productivity growth (%)
20
01
20
00
20
02
20
03
20
04
20
05
20
06
20
07
20
08
20
09
20
10
20
11
20
12
20
13
20
14
20
15
20
16
20
17
20
18
20
19
Employment growth by sector (%)
20
01
20
00
20
02
20
03
20
04
20
05
20
06
20
07
20
08
20
09
20
10
20
11
20
12
20
13
Vulnerable employment (millions) Share of vulnerable employment (%)
20
14
45
46
47
48
49
50
51
8.9
9.3
9.7
10.1
10.5
11.3
10.9
8.5
20
01
20
00
20
02
20
03
20
04
20
05
20
06
20
07
20
08
20
09
20
10
20
11
20
12
20
13
20
14
A
B
C
DE
F
G
I
HJ
K
P
Q
O
L, M  N
Others
–2 –2
–20 0 20
–20
044
Estimate
Projections
Lower and upper boundPoint projection
Vulnerable employment
Share of vulnerable employment
Projection
Projection
Projection
Projection
Projection
ContentsContents
76 World Employment and Social Outlook – Trends 2015
Annexes
1
Global and regional figures Central and South-Eastern Europe (non EU) and CIS
5
10
15
20
20
01
20
00
20
02
20
03
20
04
20
05
20
06
20
07
20
08
20
09
20
10
20
11
20
12
20
13
20
14
20
15
20
16
20
17
20
18
20
19
Total unemployment (millions)
57.5
58.5
59.5
60.5
20
01
20
00
20
02
20
03
20
04
20
05
20
06
20
07
20
08
20
09
20
10
20
11
20
12
20
13
20
14
20
15
20
16
20
17
20
18
20
19
Labour force participation rate (%)
140
150
160
170
20
01
20
00
20
02
20
03
20
04
20
05
20
06
20
07
20
08
20
09
20
10
20
11
20
12
20
13
20
14
20
15
20
16
20
17
20
18
20
19
Total employment (millions)
10
20
30
40
50
20
01
20
00
20
02
20
03
20
04
20
05
20
06
20
07
20
08
20
09
20
10
20
11
20
12
20
13
20
14
20
01
20
00
20
02
20
03
20
04
20
05
20
06
20
07
20
08
20
09
20
10
20
11
20
12
20
13
20
14
Employment by occupation – Type of task (%)
7
8
9
10
11
20
01
20
00
20
02
20
03
20
04
20
05
20
06
20
07
20
08
20
09
20
10
20
11
20
12
20
13
20
14
20
15
20
16
20
17
20
18
20
19
Total unemployment rate (%)
17
19
21
20
01
20
00
20
02
20
03
20
04
20
05
20
06
20
07
20
08
20
09
20
10
20
11
20
12
20
13
20
14
20
15
20
16
20
17
20
18
20
19
Youth unemployment rate (%)
15
30
45
60
20
01
20
00
20
02
20
03
20
04
20
05
20
06
20
07
20
08
20
09
20
10
20
11
20
12
20
13
20
14
20
15
20
16
20
17
20
18
20
19
Total employment-to-population ratio (%)
20
40
60
80
Employment by occupation – Skill level (%)
0
56.5
130
0
6
15
0
0
Estimate
Projections
Lower and upper boundPoint projection
Estimate
Projections
Lower and upper boundPoint projection
Estimate
Projections
Lower and upper boundPoint projection
Estimate
Projections
Lower bound Point projection Upper bound
Estimate
Projections
Lower bound Point projection Upper bound
Non-routine cognitive occupations
Routine occupations
Non-routine manual occupations
Low skills
Medium skills
High skills
Projection
ContentsContents
77Annex 1. Global and regional figures
Annexes
1
Central and South-Eastern Europe (non EU) and CIS Global and regional figures
20
01
20
00
20
02
20
03
20
04
20
05
20
06
20
07
20
08
20
09
20
10
20
11
20
12
20
13
Working poor (millions) – US$2/day Working poor as a share
of total employment (%)
Developing middle class US$4–13/day
(millions)
Developing middle class as a
share of total employment (%)
0
5
10
15
20
20
01
20
00
20
02
20
03
20
04
20
05
20
06
20
07
20
08
20
09
20
10
20
11
20
12
20
13
20
14
20
15
20
16
20
17
20
18
20
19
Real wage growth (%)
–18.5
–17.5
20
01
20
00
20
02
20
03
20
04
20
05
20
06
20
07
20
08
20
09
20
10
20
11
20
12
20
13
20
14
20
15
20
16
20
17
20
18
20
19
Gender gap: difference between male and female
employment-to-population ratios (percentage points)
0.6
1.2
1.8
Social unrest (in percent of all events) (%)
–3
0
3
6
20
01
20
00
20
02
20
03
20
04
20
05
20
06
20
07
20
08
20
09
20
10
20
11
20
12
20
13
20
14
20
15
20
16
20
17
20
18
20
19
Productivity growth (%)
20
01
20
00
20
02
20
03
20
04
20
05
20
06
20
07
20
08
20
09
20
10
20
11
20
12
20
13
20
14
20
15
20
16
20
17
20
18
20
19
Employment growth by sector (%)
20
14
3 2
6 4
9 6
12 8
15 10
18 12
20
01
20
00
20
02
20
03
20
04
20
05
20
06
20
07
20
08
20
09
20
10
20
11
20
12
20
13
Vulnerable employment (millions) Share of vulnerable employment (%)
20
14
30
31
32
33
18.5
20.0
21.5
23.0
17.0
20
01
20
00
20
02
20
03
20
04
20
05
20
06
20
07
20
08
20
09
20
10
20
11
20
12
20
13
20
14
A
B
C
DE
F
G
I
HJ
K
P
Q
O
L, M  N
Others
–16.5
20
01
20
00
20
02
20
03
20
04
20
05
20
06
20
07
20
08
20
09
20
10
20
11
20
12
20
13
20
14
79 54
84 56
89 58
94 60
74 52
9
–5
–19.5
0
–6
0 0
29
Estimate
Projections
Lower and upper boundPoint projection
Working poor US$2/day
Working poor as a share
of total employment
Projection
Projection
Vulnerable employment
Share of vulnerable employment
Projection
Projection
0 20–20 40
Developing middle class US$4–13/day
Developing middle class as a share
of total employment
Projection
Projection
Projection
Projection
Projection
ContentsContents
78 World Employment and Social Outlook – Trends 2015
Annexes
1
Global and regional figures East Asia
10
20
30
40
50
20
01
20
00
20
02
20
03
20
04
20
05
20
06
20
07
20
08
20
09
20
10
20
11
20
12
20
13
20
14
20
15
20
16
20
17
20
18
20
19
Total unemployment (millions)
69
71
73
75
77
20
01
20
00
20
02
20
03
20
04
20
05
20
06
20
07
20
08
20
09
20
10
20
11
20
12
20
13
20
14
20
15
20
16
20
17
20
18
20
19
Labour force participation rate (%)
140
150
160
170
20
01
20
00
20
02
20
03
20
04
20
05
20
06
20
07
20
08
20
09
20
10
20
11
20
12
20
13
20
14
20
15
20
16
20
17
20
18
20
19
Total employment (millions)
20
40
60
80
20
01
20
00
20
02
20
03
20
04
20
05
20
06
20
07
20
08
20
09
20
10
20
11
20
12
20
13
20
14
20
01
20
00
20
02
20
03
20
04
20
05
20
06
20
07
20
08
20
09
20
10
20
11
20
12
20
13
20
14
Employment by occupation – Type of task (%)
3.5
4.0
4.5
5.0
5.5
20
01
20
00
20
02
20
03
20
04
20
05
20
06
20
07
20
08
20
09
20
10
20
11
20
12
20
13
20
14
20
15
20
16
20
17
20
18
20
19
Total unemployment rate (%)
9
11
13
20
01
20
00
20
02
20
03
20
04
20
05
20
06
20
07
20
08
20
09
20
10
20
11
20
12
20
13
20
14
20
15
20
16
20
17
20
18
20
19
Youth unemployment rate (%)
66
68
70
72
74
20
01
20
00
20
02
20
03
20
04
20
05
20
06
20
07
20
08
20
09
20
10
20
11
20
12
20
13
20
14
20
15
20
16
20
17
20
18
20
19
Total employment-to-population ratio (%)
25
50
75
100
Employment by occupation – Skill level (%)
64
0
67
130
0
3.0
7
0
Estimate
Projections
Lower and upper boundPoint projection
Estimate
Projections
Lower and upper boundPoint projection
Estimate
Projections
Lower and upper boundPoint projection
Estimate
Projections
Lower bound Point projection Upper bound
Estimate
Projections
Lower bound Point projection Upper bound
Non-routine cognitive occupations
Routine occupations
Non-routine manual occupations
Low skills
Medium skills
High skills
Projection
ContentsContents
79Annex 1. Global and regional figures
Annexes
1
East Asia Global and regional figures
20
01
20
00
20
02
20
03
20
04
20
05
20
06
20
07
20
08
20
09
20
10
20
11
20
12
20
13
Working poor (millions) – US$2/day Working poor as a share
of total employment (%)
Developing middle class US$4–13/day
(millions)
Developing middle class as a
share of total employment (%)
3
6
9
12
20
01
20
00
20
02
20
03
20
04
20
05
20
06
20
07
20
08
20
09
20
10
20
11
20
12
20
13
20
14
20
15
20
16
20
17
20
18
20
19
Real wage growth (%)
–13
–12
20
01
20
00
20
02
20
03
20
04
20
05
20
06
20
07
20
08
20
09
20
10
20
11
20
12
20
13
20
14
20
15
20
16
20
17
20
18
20
19
Gender gap: difference between male and female
employment-to-population ratios (percentage points)
0.6
1.2
1.8
Social unrest (in percent of all events) (%)
3
6
9
20
01
20
00
20
02
20
03
20
04
20
05
20
06
20
07
20
08
20
09
20
10
20
11
20
12
20
13
20
14
20
15
20
16
20
17
20
18
20
19
Productivity growth (%)
20
01
20
00
20
02
20
03
20
04
20
05
20
06
20
07
20
08
20
09
20
10
20
11
20
12
20
13
20
14
20
15
20
16
20
17
20
18
20
19
Employment growth by sector (%)
20
14
90 12
180 24
270 36
360 48
450 60
20
01
20
00
20
02
20
03
20
04
20
05
20
06
20
07
20
08
20
09
20
10
20
11
20
12
20
13
Vulnerable employment (millions) Share of vulnerable employment (%)
20
14
90
180
270
360
450
12
24
60
48
36
0
20
01
20
00
20
02
20
03
20
04
20
05
20
06
20
07
20
08
20
09
20
10
20
11
20
12
20
13
20
14
A
B
C
DE
F
G
I
HJ
K
P
Q
O
Others
12
–11
20
01
20
00
20
02
20
03
20
04
20
05
20
06
20
07
20
08
20
09
20
10
20
11
20
12
20
13
20
14
90 12
180 24
270 36
360 48
450 60
0 0
0
–14
0
0
0 0
0
Estimate
Projections
Lower and upper boundPoint projection
Working poor US$2/day
Working poor as a share
of total employment
Projection
Projection
Vulnerable employment
Share of vulnerable employment
Projection
Projection
0 5 10–5 15
Developing middle class US$4–13/day
Developing middle class as a share
of total employment
Projection
Projection
Projection
Projection
Projection
L, M  N
ContentsContents
80 World Employment and Social Outlook – Trends 2015
1
Global and regional figures South-East Asia and the Pacific
5
10
15
20
20
01
20
00
20
02
20
03
20
04
20
05
20
06
20
07
20
08
20
09
20
10
20
11
20
12
20
13
20
14
20
15
20
16
20
17
20
18
20
19
Total unemployment (millions)
70.0
70.4
70.8
20
01
20
00
20
02
20
03
20
04
20
05
20
06
20
07
20
08
20
09
20
10
20
11
20
12
20
13
20
14
20
15
20
16
20
17
20
18
20
19
Labour force participation rate (%)
100
200
300
400
20
01
20
00
20
02
20
03
20
04
20
05
20
06
20
07
20
08
20
09
20
10
20
11
20
12
20
13
20
14
20
15
20
16
20
17
20
18
20
19
Total employment (millions)
15
30
45
60
20
01
20
00
20
02
20
03
20
04
20
05
20
06
20
07
20
08
20
09
20
10
20
11
20
12
20
13
20
14
20
01
20
00
20
02
20
03
20
04
20
05
20
06
20
07
20
08
20
09
20
10
20
11
20
12
20
13
20
14
Employment by occupation – Type of task (%)
4
5
6
7
20
01
20
00
20
02
20
03
20
04
20
05
20
06
20
07
20
08
20
09
20
10
20
11
20
12
20
13
20
14
20
15
20
16
20
17
20
18
20
19
Total unemployment rate (%)
8
12
16
20
20
01
20
00
20
02
20
03
20
04
20
05
20
06
20
07
20
08
20
09
20
10
20
11
20
12
20
13
20
14
20
15
20
16
20
17
20
18
20
19
Youth unemployment rate (%)
66
67
68
20
01
20
00
20
02
20
03
20
04
20
05
20
06
20
07
20
08
20
09
20
10
20
11
20
12
20
13
20
14
20
15
20
16
20
17
20
18
20
19
Total employment-to-population ratio (%)
20
40
60
80
Employment by occupation – Skill level (%)
65
0
69.6
0
0
3
4
0
Estimate
Projections
Lower and upper boundPoint projection
Estimate
Projections
Lower and upper boundPoint projection
Estimate
Projections
Lower and upper boundPoint projection
Estimate
Projections
Lower bound Point projection Upper bound
Estimate
Projections
Lower bound Point projection Upper bound
Non-routine cognitive occupations
Routine occupations
Non-routine manual occupations
Low skills
Medium skills
High skills
Projection
Annexes
ContentsContents
81Annex 1. Global and regional figures
1
South-East Asia and the Pacific Global and regional figures
20
01
20
00
20
02
20
03
20
04
20
05
20
06
20
07
20
08
20
09
20
10
20
11
20
12
20
13
Working poor (millions) – US$2/day Working poor as a share
of total employment (%)
Developing middle class US$4–13/day
(millions)
Developing middle class as a
share of total employment (%)
0
2
4
6
8
10
20
01
20
00
20
02
20
03
20
04
20
05
20
06
20
07
20
08
20
09
20
10
20
11
20
12
20
13
20
14
20
15
20
16
20
17
20
18
20
19
Real wage growth (%)
–23
–22
20
01
20
00
20
02
20
03
20
04
20
05
20
06
20
07
20
08
20
09
20
10
20
11
20
12
20
13
20
14
20
15
20
16
20
17
20
18
20
19
Gender gap: difference between male and female
employment-to-population ratios (percentage points)
0.4
0.8
1.2
1.6
Social unrest (in percent of all events) (%)
0
2
4
20
01
20
00
20
02
20
03
20
04
20
05
20
06
20
07
20
08
20
09
20
10
20
11
20
12
20
13
20
14
20
15
20
16
20
17
20
18
20
19
Productivity growth (%)
20
01
20
00
20
02
20
03
20
04
20
05
20
06
20
07
20
08
20
09
20
10
20
11
20
12
20
13
20
14
20
15
20
16
20
17
20
18
20
19
Employment growth by sector (%)
20
14
30
60
120
150
180
20
01
20
00
20
02
20
03
20
04
20
05
20
06
20
07
20
08
20
09
20
10
20
11
20
12
20
13
Vulnerable employment (millions) Share of vulnerable employment (%)
20
14
145
155
165
175
20
01
20
00
20
02
20
03
20
04
20
05
20
06
20
07
20
08
20
09
20
10
20
11
20
12
20
13
20
14
A
B
C
DE
F
G
I
HJ
K
P
Q
O
L, M  N
Others
6
–21
17.5
35.0
52.5
70.0
0
–1
–24
0
–1
0
135
20
01
20
00
20
02
20
03
20
04
20
05
20
06
20
07
20
08
20
09
20
10
20
11
20
12
20
13
20
14
30 10
60 20
90 30
120 40
0 0
14
28
42
56
70
0
Working poor US$2/day
Working poor as a share
of total employment
Projection
Projection
Developing middle class US$4–13/day
Developing middle class as a share
of total employment
Projection
Projection
Vulnerable employment
Share of vulnerable employment
Projection
Projection
0 10050
Estimate
Projections
Lower and upper boundPoint projection
Projection
Projection
Projection
Annexes
ContentsContents
82 World Employment and Social Outlook – Trends 2015
1
Global and regional figures South Asia
7
14
21
28
35
20
01
20
00
20
02
20
03
20
04
20
05
20
06
20
07
20
08
20
09
20
10
20
11
20
12
20
13
20
14
20
15
20
16
20
17
20
18
20
19
Total unemployment (millions)
56
58
60
62
20
01
20
00
20
02
20
03
20
04
20
05
20
06
20
07
20
08
20
09
20
10
20
11
20
12
20
13
20
14
20
15
20
16
20
17
20
18
20
19
Labour force participation rate (%)
200
400
600
800
20
01
20
00
20
02
20
03
20
04
20
05
20
06
20
07
20
08
20
09
20
10
20
11
20
12
20
13
20
14
20
15
20
16
20
17
20
18
20
19
Total employment (millions)
15
30
45
60
20
01
20
00
20
02
20
03
20
04
20
05
20
06
20
07
20
08
20
09
20
10
20
11
20
12
20
13
20
14
20
01
20
00
20
02
20
03
20
04
20
05
20
06
20
07
20
08
20
09
20
10
20
11
20
12
20
13
20
14
Employment by occupation – Type of task (%)
3.6
4.2
4.8
20
01
20
00
20
02
20
03
20
04
20
05
20
06
20
07
20
08
20
09
20
10
20
11
20
12
20
13
20
14
20
15
20
16
20
17
20
18
20
19
Total unemployment rate (%)
9.5
10.5
11.5
20
01
20
00
20
02
20
03
20
04
20
05
20
06
20
07
20
08
20
09
20
10
20
11
20
12
20
13
20
14
20
15
20
16
20
17
20
18
20
19
Youth unemployment rate (%)
53
55
57
59
20
01
20
00
20
02
20
03
20
04
20
05
20
06
20
07
20
08
20
09
20
10
20
11
20
12
20
13
20
14
20
15
20
16
20
17
20
18
20
19
Total employment-to-population ratio (%)
10
20
30
40
50
60
70
Employment by occupation – Skill level (%)
51
54 8.5
0
0
0
3.0
0
Estimate
Projections
Lower and upper boundPoint projection
Estimate
Projections
Lower and upper boundPoint projection
Estimate
Projections
Lower and upper boundPoint projection
Estimate
Projections
Lower bound Point projection Upper bound
Estimate
Projections
Lower bound Point projection Upper bound
Non-routine cognitive occupations
Routine occupations
Non-routine manual occupations
Low skills
Medium skills
High skills
Projection
Annexes
ContentsContents
83Annex 1. Global and regional figures
1
South Asia Global and regional figures
20
01
20
00
20
02
20
03
20
04
20
05
20
06
20
07
20
08
20
09
20
10
20
11
20
12
20
13
Working poor (millions) – US$2/day Working poor as a share
of total employment (%)
Developing middle class US$4–13/day
(millions)
Developing middle class as a
share of total employment (%)
0
2
4
6
8
10
20
01
20
00
20
02
20
03
20
04
20
05
20
06
20
07
20
08
20
09
20
10
20
11
20
12
20
13
20
14
20
15
20
16
20
17
20
18
20
19
Real wage growth (%)
–48
–46
–44
20
01
20
00
20
02
20
03
20
04
20
05
20
06
20
07
20
08
20
09
20
10
20
11
20
12
20
13
20
14
20
15
20
16
20
17
20
18
20
19
Gender gap: difference between male and female
employment-to-population ratios (percentage points)
0.5
1.0
1.5
2.0
Social unrest (in percent of all events) (%)
3
6
20
01
20
00
20
02
20
03
20
04
20
05
20
06
20
07
20
08
20
09
20
10
20
11
20
12
20
13
20
14
20
15
20
16
20
17
20
18
20
19
Productivity growth (%)
20
01
20
00
20
02
20
03
20
04
20
05
20
06
20
07
20
08
20
09
20
10
20
11
20
12
20
13
20
14
20
15
20
16
20
17
20
18
20
19
Employment growth by sector (%)
20
14
90
180
270
360
450
20
01
20
00
20
02
20
03
20
04
20
05
20
06
20
07
20
08
20
09
20
10
20
11
20
12
20
13
Vulnerable employment (millions) Share of vulnerable employment (%)
20
14
395
430
465
500
20
01
20
00
20
02
20
03
20
04
20
05
20
06
20
07
20
08
20
09
20
10
20
11
20
12
20
13
20
14
A
B
C
DE
F
G
I
HJ
K
P
Q
O
L, M  N
Others
9
–42
74.5
77.0
79.5
82.0
72.0
–2
–50
0
0
0
360
20
01
20
00
20
02
20
03
20
04
20
05
20
06
20
07
20
08
20
09
20
10
20
11
20
12
20
13
20
14
0.5 3
1.0 6
60 9
80 12
0 0
18
36
54
72
90
0
Working poor US$2/day
Working poor as a share
of total employment
Projection
Projection
Developing middle class US$4–13/day
Developing middle class as a share
of total employment
Projection
Projection
Vulnerable employment
Share of vulnerable employment
Projection
Projection
–10 10 200
Estimate
Projections
Lower and upper bound
Point projection
Projection
Projection
Projection
Annexes
ContentsContents
84 World Employment and Social Outlook – Trends 2015
1
Global and regional figures Latin America and the Caribbean
6
12
18
24
30
20
01
20
00
20
02
20
03
20
04
20
05
20
06
20
07
20
08
20
09
20
10
20
11
20
12
20
13
20
14
20
15
20
16
20
17
20
18
20
19
Total unemployment (millions)
63.5
64.5
65.5
66.5
20
01
20
00
20
02
20
03
20
04
20
05
20
06
20
07
20
08
20
09
20
10
20
11
20
12
20
13
20
14
20
15
20
16
20
17
20
18
20
19
Labour force participation rate (%)
70
140
210
280
350
20
01
20
00
20
02
20
03
20
04
20
05
20
06
20
07
20
08
20
09
20
10
20
11
20
12
20
13
20
14
20
15
20
16
20
17
20
18
20
19
Total employment (millions)
15
30
45
60
20
01
20
00
20
02
20
03
20
04
20
05
20
06
20
07
20
08
20
09
20
10
20
11
20
12
20
13
20
14
20
01
20
00
20
02
20
03
20
04
20
05
20
06
20
07
20
08
20
09
20
10
20
11
20
12
20
13
20
14
Employment by occupation – Type of task (%)
6.5
8.0
9.5
20
01
20
00
20
02
20
03
20
04
20
05
20
06
20
07
20
08
20
09
20
10
20
11
20
12
20
13
20
14
20
15
20
16
20
17
20
18
20
19
Total unemployment rate (%)
12
14
16
18
20
01
20
00
20
02
20
03
20
04
20
05
20
06
20
07
20
08
20
09
20
10
20
11
20
12
20
13
20
14
20
15
20
16
20
17
20
18
20
19
Youth unemployment rate (%)
20
10
40
60
30
50
70
Employment by occupation – Skill level (%)
0
62.5
0
0
5.0
10
0
Estimate
Projections
Lower and upper boundPoint projection
59
61
63
20
01
20
00
20
02
20
03
20
04
20
05
20
06
20
07
20
08
20
09
20
10
20
11
20
12
20
13
20
14
20
15
20
16
20
17
20
18
20
19
Total employment-to-population ratio (%)
57
Estimate
Projections
Lower and upper boundPoint projection
Estimate
Projections
Lower and upper boundPoint projection
Estimate
Projections
Lower bound Point projection Upper bound
Estimate
Projections
Lower bound Point projection Upper bound
Non-routine cognitive occupations
Routine occupations
Non-routine manual occupations
Low skills
Medium skills
High skills
Projection
Annexes
ContentsContents
85Annex 1. Global and regional figures
1
Latin America and the Caribbean  Global and regional figures
20
01
20
00
20
02
20
03
20
04
20
05
20
06
20
07
20
08
20
09
20
10
20
11
20
12
20
13
Working poor (millions) – US$2/day Working poor as a share
of total employment (%)
Developing middle class US$4–13/day
(millions)
Developing middle class as a
share of total employment (%)
0.4
0.8
1.2
1.6
Social unrest (in percent of all events) (%)
20
14
10
20
30
40
20
01
20
00
20
02
20
03
20
04
20
05
20
06
20
07
20
08
20
09
20
10
20
11
20
12
20
13
Vulnerable employment (millions) Share of vulnerable employment (%)
20
14
70
75
80
85
90
20
01
20
00
20
02
20
03
20
04
20
05
20
06
20
07
20
08
20
09
20
10
20
11
20
12
20
13
20
14
30.6
32.2
33.8
35.4
37.0
29.0 0
0
65
20
01
20
00
20
02
20
03
20
04
20
05
20
06
20
07
20
08
20
09
20
10
20
11
20
12
20
13
20
14
40 43
80 46
49120
160 52
0 40
4.5
9.0
13.5
18.0
0
Working poor US$2/day
Working poor as a share
of total employment
Projection
Projection
Developing middle class US$4–13/day
Developing middle class as a share
of total employment
Projection
Projection
Vulnerable employment
Share of vulnerable employment
Projection
Projection
–30
–26
20
01
20
00
20
02
20
03
20
04
20
05
20
06
20
07
20
08
20
09
20
10
20
11
20
12
20
13
20
14
20
15
20
16
20
17
20
18
20
19
Gender gap: difference between male and female
employment-to-population ratios (percentage points)
20
01
20
00
20
02
20
03
20
04
20
05
20
06
20
07
20
08
20
09
20
10
20
11
20
12
20
13
20
14
20
15
20
16
20
17
20
18
20
19
Employment growth by sector (%)
A
B
C
DE
F
G
I
HJ
K
P
Q
O
L, M  N
Others
–22
–34
−20−30 −10 0 10 20 30
Projection
Projection
Annexes
ContentsContents
86 World Employment and Social Outlook – Trends 2015
1
Global and regional figures Middle East and North Africa
5
10
15
20
25
20
01
20
00
20
02
20
03
20
04
20
05
20
06
20
07
20
08
20
09
20
10
20
11
20
12
20
13
20
14
20
15
20
16
20
17
20
18
20
19
Total unemployment (millions)
46.5
47.5
48.5
49.5
50.5
20
01
20
00
20
02
20
03
20
04
20
05
20
06
20
07
20
08
20
09
20
10
20
11
20
12
20
13
20
14
20
15
20
16
20
17
20
18
20
19
Labour force participation rate (%)
40
80
120
160
20
01
20
00
20
02
20
03
20
04
20
05
20
06
20
07
20
08
20
09
20
10
20
11
20
12
20
13
20
14
20
15
20
16
20
17
20
18
20
19
Total employment (millions)
10
20
30
40
50
20
01
20
00
20
02
20
03
20
04
20
05
20
06
20
07
20
08
20
09
20
10
20
11
20
12
20
13
20
14
20
01
20
00
20
02
20
03
20
04
20
05
20
06
20
07
20
08
20
09
20
10
20
11
20
12
20
13
20
14
Employment by occupation – Type of task (%)
3.5
4.0
4.5
5.0
5.5
20
01
20
00
20
02
20
03
20
04
20
05
20
06
20
07
20
08
20
09
20
10
20
11
20
12
20
13
20
14
20
15
20
16
20
17
20
18
20
19
Total unemployment rate (%)
26
30
34
20
01
20
00
20
02
20
03
20
04
20
05
20
06
20
07
20
08
20
09
20
10
20
11
20
12
20
13
20
14
20
15
20
16
20
17
20
18
20
19
Youth unemployment rate (%)
41
43
45
20
01
20
00
20
02
20
03
20
04
20
05
20
06
20
07
20
08
20
09
20
10
20
11
20
12
20
13
20
14
20
15
20
16
20
17
20
18
20
19
Total employment-to-population ratio (%)
20
40
60
80
Employment by occupation – Skill level (%)
39
0
45.5
0
0
3.0
22
0
Estimate
Projections
Lower and upper boundPoint projection
Estimate
Projections
Lower and upper boundPoint projection
Estimate
Projections
Lower and upper boundPoint projection
Estimate
Projections
Lower bound Point projection Upper bound
Estimate
Projections
Lower bound Point projection Upper bound
Non-routine cognitive occupations
Routine occupations
Non-routine manual occupations
Low skills
Medium skills
High skills
Projection
Annexes
ContentsContents
87Annex 1. Global and regional figures
1
Middle East and North Africa  Global and regional figures
20
01
20
00
20
02
20
03
20
04
20
05
20
06
20
07
20
08
20
09
20
10
20
11
20
12
20
13
Working poor (millions) – US$2/day Working poor as a share
of total employment (%)
Developing middle class US$4–13/day
(millions)
Developing middle class as a
share of total employment (%)
0
3
6
20
01
20
00
20
02
20
03
20
04
20
05
20
06
20
07
20
08
20
09
20
10
20
11
20
12
20
13
20
14
20
15
20
16
20
17
20
18
20
19
Real wage growth (%)
–50.6
20
01
20
00
20
02
20
03
20
04
20
05
20
06
20
07
20
08
20
09
20
10
20
11
20
12
20
13
20
14
20
15
20
16
20
17
20
18
20
19
Gender gap: difference between male and female
employment-to-population ratios (percentage points)
1
2
3
Social unrest (in percent of all events) (%)
0
2
20
01
20
00
20
02
20
03
20
04
20
05
20
06
20
07
20
08
20
09
20
10
20
11
20
12
20
13
20
14
20
15
20
16
20
17
20
18
20
19
Productivity growth (%)
20
01
20
00
20
02
20
03
20
04
20
05
20
06
20
07
20
08
20
09
20
10
20
11
20
12
20
13
20
14
20
15
20
16
20
17
20
18
20
19
Employment growth by sector (%)
20
14
13
14
15
20
01
20
00
20
02
20
03
20
04
20
05
20
06
20
07
20
08
20
09
20
10
20
11
20
12
20
13
Vulnerable employment (millions) Share of vulnerable employment (%)
20
14
15
30
45
20
01
20
00
20
02
20
03
20
04
20
05
20
06
20
07
20
08
20
09
20
10
20
11
20
12
20
13
20
14
A
B
C
DE
F
G
I
HJ
K
P
Q
O
L, M  N
Others
–49.6
4
–3
–51.6
0
–2
12
0
15
30
45
0
15
30
45
0
20
01
20
00
20
02
20
03
20
04
20
05
20
06
20
07
20
08
20
09
20
10
20
11
20
12
20
13
20
14
15 34.5
30 37.0
39.545
60 42.0
0 32.0
6
12
18
0
Working poor US$2/day
Working poor as a share
of total employment
Projection
Projection
Developing middle class US$4–13/day
Developing middle class as a share
of total employment
Projection
Projection
Vulnerable employment
Share of vulnerable employment
Projection
Projection
0 5 10−5
Estimate
Projections
Lower and upper boundPoint projection
Projection
Projection
Projection
Annexes
ContentsContents
88 World Employment and Social Outlook – Trends 2015
1
Global and regional figures Sub-Saharan Africa
10
20
30
40
20
01
20
00
20
02
20
03
20
04
20
05
20
06
20
07
20
08
20
09
20
10
20
11
20
12
20
13
20
14
20
15
20
16
20
17
20
18
20
19
Total unemployment (millions)
69.5
70.0
70.5
71.0
71.5
20
01
20
00
20
02
20
03
20
04
20
05
20
06
20
07
20
08
20
09
20
10
20
11
20
12
20
13
20
14
20
15
20
16
20
17
20
18
20
19
Labour force participation rate (%)
150
300
450
20
01
20
00
20
02
20
03
20
04
20
05
20
06
20
07
20
08
20
09
20
10
20
11
20
12
20
13
20
14
20
15
20
16
20
17
20
18
20
19
Total employment (millions)
20
40
60
80
20
01
20
00
20
02
20
03
20
04
20
05
20
06
20
07
20
08
20
09
20
10
20
11
20
12
20
13
20
14
20
01
20
00
20
02
20
03
20
04
20
05
20
06
20
07
20
08
20
09
20
10
20
11
20
12
20
13
20
14
Employment by occupation – Type of task (%)
3
4
5
20
01
20
00
20
02
20
03
20
04
20
05
20
06
20
07
20
08
20
09
20
10
20
11
20
12
20
13
20
14
20
15
20
16
20
17
20
18
20
19
Total unemployment rate (%)
11
12
13
14
20
01
20
00
20
02
20
03
20
04
20
05
20
06
20
07
20
08
20
09
20
10
20
11
20
12
20
13
20
14
20
15
20
16
20
17
20
18
20
19
Youth unemployment rate (%)
63.5
64.5
64.5
66.5
20
01
20
00
20
02
20
03
20
04
20
05
20
06
20
07
20
08
20
09
20
10
20
11
20
12
20
13
20
14
20
15
20
16
20
17
20
18
20
19
Total employment-to-population ratio (%)
30
60
90
Employment by occupation – Skill level (%)
62.5
20
69.0
0
0
10
0
Estimate
Projections
Lower and upper boundPoint projection
Estimate
Projections
Lower and upper boundPoint projection
Estimate
Projections
Lower and upper boundPoint projection
Estimate
Projections
Lower bound Point projection Upper bound
Estimate
Projections
Lower bound Point projection Upper bound
Non-routine cognitive occupations
Routine occupations
Non-routine manual occupations
Low skills
Medium skills
High skills
Projection
Annexes
ContentsContents
89Annex 1. Global and regional figures
1
Sub-Saharan Africa Global and regional figures
20
01
20
00
20
02
20
03
20
04
20
05
20
06
20
07
20
08
20
09
20
10
20
11
20
12
20
13
Working poor (millions) – US$2/day Working poor as a share
of total employment (%)
Developing middle class US$4–13/day
(millions)
Developing middle class as a
share of total employment (%)
0
–2
2
4
6
8
10
20
01
20
00
20
02
20
03
20
04
20
05
20
06
20
07
20
08
20
09
20
10
20
11
20
12
20
13
20
14
20
15
20
16
20
17
20
18
20
19
Real wage growth (%)
–14
–13
–12
–11
20
01
20
00
20
02
20
03
20
04
20
05
20
06
20
07
20
08
20
09
20
10
20
11
20
12
20
13
20
14
20
15
20
16
20
17
20
18
20
19
Gender gap: difference between male and female
employment-to-population ratios (percentage points)
0.4
0.8
1.2
Social unrest (in percent of all events) (%)
0
2
20
01
20
00
20
02
20
03
20
04
20
05
20
06
20
07
20
08
20
09
20
10
20
11
20
12
20
13
20
14
20
15
20
16
20
17
20
18
20
19
Productivity growth (%)
20
01
20
00
20
02
20
03
20
04
20
05
20
06
20
07
20
08
20
09
20
10
20
11
20
12
20
13
20
14
20
15
20
16
20
17
20
18
20
19
Employment growth by sector (%)
20
14
180
200
220
20
01
20
00
20
02
20
03
20
04
20
05
20
06
20
07
20
08
20
09
20
10
20
11
20
12
20
13
Vulnerable employment (millions) Share of vulnerable employment (%)
20
14
100
200
300
20
01
20
00
20
02
20
03
20
04
20
05
20
06
20
07
20
08
20
09
20
10
20
11
20
12
20
13
20
14
A
B
C
DE
F
G
I
HJ
K
P
Q
O
L, M  N
Others
–10
77
79
81
75
4
160
0
–4
–15
0
–2
20
01
20
00
20
02
20
03
20
04
20
05
20
06
20
07
20
08
20
09
20
10
20
11
20
12
20
13
20
14
10
20
30
40
50
0
30
60
90
0
2.8
5.6
8.4
11.2
14.0
0
Estimate
Projections
Lower and upper boundPoint projection
Working poor US$2/day
Working poor as a share
of total employment
Projection
Projection
Developing middle class US$4–13/day
Developing middle class as a share
of total employment
Projection
Projection
Vulnerable employment
Share of vulnerable employment
Projection
Projection
0 5 10 15
Projection
Projection
Projection
Annexes
ContentsContents
90 World Employment and Social Outlook – Trends 2015
Annexes
2
Labour market estimates and projections
The source of all global and regional labour market estimates in this World Employment and Social Outlook report is
ILO, Trends econometric models, October 2014. The ILO Research Department has designed and actively maintains
econometric models which are used to produce estimates of labour market indicators in the countries and years for
which country-reported data are unavailable. These give the ILO the ability to produce and analyse global and regional
estimates of key labour market indicators and the related trends.
The Global Employment Trends Model (GET Model) is used to produce estimates and projections – disaggregated by
age and sex as appropriate – of unemployment, employment and status in employment. The output of the model is a
complete matrix of data for 178 countries. The country-level data can then be aggregated to produce regional and global
estimates of labour market indicators such as the unemployment rate, the employment-to-population ratio, status in
employment shares and vulnerable employment.
Prior to running the GET Model, labour market information specialists in the Research Department, in cooperation
with specialists in ILO field offices, evaluate existing country-reported data and select only those observations deemed
sufficiently comparable across countries – with criteria including: (1) type of data source; (2) geographic coverage; and
(3) age group coverage.
 With regard to the first criterion, in order to be included in the model, data must be derived from either a labour
force survey or population census. National labour force surveys are typically similar across countries, and the data
derived from these surveys are more comparable than data obtained from other sources. A strict preference is
therefore given to labour force survey-based data in the selection process. Yet many developing countries without
adequate resources to carry out a labour force survey do report labour market information based on population
censuses. Consequently, due to the need to balance the competing goals of data comparability and data coverage,
some population census-based data are included in the model.
 The second criterion is that only nationally representative (i.e. not prohibitively geographically limited) labour market
indicators are included. Observations corresponding to only urban or only rural areas are not included, as large
differences typically exist between rural and urban labour markets, and using only rural or urban data would not
be consistent with benchmark files such as GDP.
 The third criterion is that the age groups covered by the observed data must be sufficiently comparable across
countries. Countries report labour market information for a variety of age groups and the age group selected can
have an influence on the observed value of a given labour market indicator.
Apart from country-reported labour market information, the GET Model uses the following benchmark files:
 United Nations World Population Prospects, 2012 revision for population estimates and projections.
 ILO Economically Active Population, Estimates and Projections (EAPEP) for labour force estimates and projections.
 IMF/World Bank data on GDP (PPP, per capita GDP and GDP growth rates) from the World Development Indicators
and the World Economic Outlook October 2014 database.
 World Bank poverty estimates from the PovcalNet database.
ContentsContents
91Annex 2. Labour market estimates and projections
Annexes
2
Labour market estimates and projections
Estimates of labour market indicators
The GET Model produces estimates of unemployment rates to fill in missing values in the countries and years for which
country-reported data are unavailable. Multivariate regressions are run separately for different regions in the world
in which unemployment rates broken down by age and sex (youth male, youth female, adult male, adult female) are
regressed on GDP growth rates. Weights are used in the regressions to correct for biases that may result from the fact
that countries that report unemployment rates tend to be different (in statistically important respects) than countries
that do not report unemployment rates.1
For 2014, a preliminary estimate is produced, using quarterly and monthly
information available up to the time of production of this World Employment and Social Outlook report (October 2014).
The model also estimates employment by status using similar techniques to impute missing values at the country level.
In addition to GDP growth rate, the variables used as explanatory variables are the value added shares of the three
broad sectors in GDP, per capita GDP and the share of people living in urban areas. Additional econometric models
are used to produce global and regional estimates of working poverty and employment by economic class (Kapsos and
Bourmpoula, 2013).
Projections of labour market indicators
Unemployment rate projections are obtained using the historical relationship between unemployment rates and GDP
growth during the worst crisis/downturn period for each country between 1991 and 2005, and during the corresponding
recovery period.2
This was done through the inclusion of interaction terms of crisis and recovery dummy variables
with GDP growth in fixed effects panel regressions.3
Specifically, the logistically transformed unemployment rate was
regressed on a set of covariates, including the lagged unemployment rate, the GDP growth rate, the lagged GDP growth
rate and a set of covariates consisting of the interaction of the crisis dummy, and of the interaction of the recovery-year
dummy with each of the other variables.
Separate panel regressions were run across three different groupings of countries, based on:
(1)	 geographic proximity and economic/institutional similarities;
(2)	income levels;4
(3)	level of export dependence (measured as exports as a percentage of GDP).5
The rationale behind these groupings is the following. Countries within the same geographic area or with similar eco-
nomic/institutional characteristics are likely to be similarly affected by the crisis and have similar mechanisms to atten-
uate the crisis impact on their labour markets. Furthermore, because countries within geographic areas often have
strong WTO and financial linkages, the crisis is likely to spill over from one economy to its neighbour (e.g. Canada’s
economy and labour market developments are intricately linked to developments in the United States). Countries of
similar income levels are also likely to have more similar labour market institutions (e.g. social protection measures) and
similar capacities to implement fiscal stimulus and other policies to counter the crisis impact. Finally, as the decline in
exports was the primary crisis transmission channel from developed to developing economies, countries were grouped
according to their level of exposure to this channel, as measured by their exports as a percentage of GDP. The impact
of the crisis on labour markets through the export channel also depends on the type of exports (the affected sectors
of the economy), the share of domestic value added in exports and the relative importance of domestic consumption
1
  For instance, if simple averages of unemployment rates in reporting countries in a given region were used to estimate the unemployment rate in that
region, and the countries that do not report unemployment rates are different with respect to unemployment rates than reporting countries, without such
a correction mechanism, the resulting estimated regional unemployment rate would be biased. The “weighted least squares” approach adopted in the
GET Model corrects for this potential problem.
2
  The crisis period comprises the span between the year in which a country experienced the largest drop in GDP growth, and the “turning point year”
when growth reached its lowest level following the crisis, before starting to climb back to its pre-crisis level. The recovery period comprises the years
between the “turning point year” and the year when growth has returned to its pre-crisis level.
3
  In order to project unemployment during the current recovery period, the crisis-year and recovery-year dummies were adjusted based on the following
definition: a country was considered “currently in crisis” if the drop in GDP growth after 2007 was larger than 75 per cent of the absolute value of the
standard deviation of GDP growth over the 1991–2008 period and/or larger than 3 percentage points.
4
  The income groups correspond to the World Bank income group classification of four income categories, based on countries’ 2008 GNI per capita
(calculated using the Atlas method): low-income countries, US$975 or less; lower middle-income countries, US$976–US$3,855; upper middle-income
countries, US$3,856–US$11,905; and high-income countries, US$11,906 or more.
5
  The export dependence-based groups are: highest exports (exports ≥70 per cent of GDP); high exports (exports 70 per cent but ≥50 per cent of GDP);
medium exports (exports 50 per cent but ≥20 per cent of GDP); and low exports (exports 20 per cent of GDP).
ContentsContents
92 World Employment and Social Outlook – Trends 2015
Annexes
Labour market estimates and projections
2
(for instance, countries such as India and Indonesia with a large domestic market were less vulnerable than countries
such as Singapore and Thailand). These characteristics are controlled for by using fixed-effects in the regressions.
In addition to the panel regressions, country-level regressions were run for countries with sufficient data. The ordinary
least squares country-level regressions included the same variables as the panel regressions.
To take into account the uncertainty around GDP prospects as well as the complexity of capturing the relationship
between GDP and unemployment rate for all the countries, a variety of 10 (similar) multilevel mixed-effects linear
regressions (varying-intercept and varying-coefficient models) are utilized. The main component that changes across
these 10 versions is the lag structure of the independent variables. The potential superiority of these models lies in
the fact that not only is the panel structure is fully exploited (e.g. increased degrees of freedom), but also it is possible
to estimate the coefficients specifically for each unit (country), taking into account unobserved heterogeneity at the
cluster-level and correcting for the random effects’ approach caveat that the independent variables are not correlated
with the random effects term.
Overall, the final projection was generated as a simple average of the estimates obtained from the three group panel
regressions and also, for countries with sufficient data, the country-level regressions. For a selection of countries
(44 out of 178), an average of another set of forecast combination was made according to judgemental examination in
order to represent more realistically the recent trends observed in each country’s economic forecast.
Short-term projection model
For G7 countries, the preliminary unemployment estimate for 2014 and the projection for 2015 are based on results
from country-specific short-term projection models. The ILO maintains a database on monthly and quarterly un-
employment flows that contains information on inflow and outflow rates into and out of unemployment, estimated on
the basis of unemployment by duration, following the methodologies proposed by Shimer (2012) and Elsby et al. (2013).
Seven different models are specified that either project the unemployment rate directly or both inflow and outflow
rates, using ARIMA, VAR, VARX and combined forecast techniques. The model relies on several explanatory variables
including hiring uncertainty (Ernst and Viegelahn, 2014), policy uncertainty (Baker et al., 2013) and GDP growth.
For the final forecast, projections of one of the seven models are chosen for each country, based on results from a
pseudo-out-of-sample analysis.
ContentsContents
93Annex 3. Occupational and sectoral employment estimates and projections
Annexes
Occupational and sectoral employment estimates and projections
3
Besides other labour market indicators, this report also presents new estimates and projections of detailed sectoral
and occupational employment shares, total and by sex. The principal database used for the sectoral and occupational
employment shares is the most recent version of the ILO Key Indicators of the Labour Market (KILM), 8th edition.1
The
KILM is a wide-ranging database of 18 labour market indicators from 1980 to the latest available year for about 226
countries. Employment by sector captures the distribution of the employed population across sectors of economic
activity. Employment by occupation is an indicator that attempts to categorize the employed population into groups of
jobs with similar tasks and duties that are hierarchically organized in a number of levels. The main source of additional
data is ILOSTAT, ILO Short-Term Indicators (STI). For India, tabulations based on data from the National Sample Survey
Organization (NSSO) survey on the Employment and Unemployment Situation in India were used. Data based on the
most recent labour force survey conducted in Bangladesh were also considered.
The groups for occupations are selected in order to be representative of broad levels of skills as defined by educational
level required and by type of skills required. The broad occupational categories (skills) are chosen according to the broad
level of educational attainment required based on the International Standard Classification of Education (ISCED); primary,
secondary and tertiary educational level. The broad occupational categories (routine) are defined, following Jaimovich
and Siu (2012) and Autor et al. (2003).
To produce estimates and projections, data on sectoral value added shares of GDP are taken from the United Nations
Statistics Division – System of National Accounts – National Accounts Main Aggregates (UNSD SNAAMA) database.
The Economist Intelligence Unit (EIU) database was used to supplement the data from the above sources and also to
assist in projecting the value added shares by sector. For only one country (i.e. Taiwan, China) the entire series from EIU
was utilized because there were data for this country neither in World Bank WDI nor in UNSD SNAAMA. The demo-
graphic variables used in the model come from the United Nations World Population Prospects (UN WPP), the United
Nations World Urbanization Prospects (UN WUP) and the ILO Economically Active Population Estimates and Projections
(ILO EAPEP).
Other sources of data for explanatory variables are the IMF World Economic Outlook database and the World Bank World
Development Indicators database. For one variable, the IMF International Financial Statistics was used. The explanatory
variables that are considered include: GDP per capita, output per worker, investment, exports of goods, imports of goods,
general government final consumption expenditure, gross capital formation, trade in services, real effective exchange
rate index, value added by sector, ratio of female-to-male labour force aged 30 to 64 years old, share of urban population
in total population, share of population aged less than 15 years old in total population, share of population aged less
than 15 years old and population aged above 65 years old in total population, share of wage and salary workers in total
employment.
Estimates and projections are produced on the basis of the methodology that proceeds in three steps: (1) run regressions
with a set of different combinations of the potential explanatory variables; (2) select the specifications for which the
goodness-of-fit is best; and (3) run a bootstrap procedure on those specifications and calculate for each geographical
region and each category of employment (i.e. sector and broad occupation) the RSME, based on this procedure. At
this point, the RMSE is produced not only for these specifications but also for the average prediction among all the
specifications selected, the average among the three best and among the five best performers. Then, for each sector
or occupation and for each region, the specification with the lowest RMSE is selected to be used for the final estimates.
Finally, some adjustments are made to the estimates in order to make sure that the sum of shares across all categories
equals 100 and that the sum of men and women working in a specific sectoral or occupational category equals the
number of the estimate for both sexes.
1
  KILM 8th edition is available online at: www.ilo.org/kilm.
ContentsContents
94 World Employment and Social Outlook – Trends 2015
Annexes
Real wage growth estimates and projection
4
This report includes regional wage estimates and projections for 1999–2019, which are constructed on the basis of a
large set of econometric models that exploit the relationship between wages and different macroeconomic and labour
market variables. The underlying wage data are taken from the ILO’s Global Wage Database1
for 1999–2013 and from
the ILO Key Indicators of the Labour Market (KILM), 8th edition for 1995–1998. Data for explanatory variables come
from the IMF World Economic Outlook, October 2014 and ILO Trends Econometric Models, October 2014. The regional
estimates and projections cover 107 countries for 1995–2013.
The different models that are specified make use of panel estimation techniques and differ with respect to various
dimensions:
 the estimation methodology;
 the form in which wages enter the models as dependent variable (as real wage growth, difference between real
wage and productivity growth, or logarithm of the real wage);
 the set of explanatory variables;
 the way in which different countries are grouped together.
The models consider a wide range of explanatory variables such as investment, labour productivity, proxies for the
reservation wage, sectoral and occupational employment shares and demographic variables, allowing for a variety of
factors that are (potentially) related to real wage trends. In addition, some specifications account for the fact that the
relationship of wages with these variables can change, depending on the position within the business cycle. Regressions
are run on the whole panel dataset as well as on different groups of countries. Country groupings are based on differ-
ences in minimum wage legislation, minimum-wage setting mechanisms, geographic proximity and the distribution of
unemployment over different durations and changes thereof.
In total, more than 1,000 models are available for testing. In a first step, this number is reduced to about 600, based
on a pre-selection of models that excludes those with the smallest explanatory power. As a second step, a detailed
analysis that evaluates the pseudo-out-of-sample performance of the different wage projections is conducted to create
country-specific performance rankings of the different models. The final projection for each country then corresponds to
the simple average of the projections produced by the top-10 best performing models. The regional average wage growth
is calculated by taking into account each country’s weight in the total regional wage bill, following the methodology used
in the Global Wage Report (ILO, 2014b).
The regional wage growth aggregates cover 107 out of the 178 countries that are included in this report (see Annex 5;
ILO, 2014b). The following countries are included into the regional wage growth figures: Albania, Algeria, Armenia,
Australia, Austria, Azerbaijan, Bahrain, Bangladesh, Belarus, Belgium, Plurinational State of Bolivia, Botswana, Brazil,
Bulgaria, Burundi, Cambodia, Canada, Chad, Chile, China, Colombia, Congo, Costa Rica, Cyprus, Denmark, Dominican
Republic, Ecuador, Egypt, El Salvador, Ethiopia, Fiji, Finland, France, Germany, Greece, Guatemala, Guyana, Honduras,
Hong Kong (China), Hungary, Iceland, India, Indonesia, Islamic Republic of Iran, Ireland, Israel, Italy, Jamaica, Japan,
Jordan, Kazakhstan, Kenya, Republic of Korea, Kuwait, Kyrgyzstan, Latvia, Lebanon, Lesotho, Luxembourg, Madagascar,
Malawi, Malaysia, Mauritius, Mexico, Republic of Moldova, Mongolia, Morocco, Mozambique, Nepal, Netherlands, New
Zealand, Nicaragua, Norway, Oman, Pakistan, Panama, Paraguay, Peru, Philippines, Poland, Portugal, Qatar, Romania,
Russian Federation, Saudi Arabia, Senegal, Singapore, Slovenia, South Africa, Spain, Sri Lanka, Sweden, Switzerland,
Taiwan (China), Tajikistan, United Republic of Tanzania, Thailand, Tunisia, Turkey, Uganda, Ukraine, United Arab
Emirates, United Kingdom, United States, Uruguay, Bolivarian Republic of Venezuela, Viet Nam.
For more details on the methodology, please see Ernst et al. (forthcoming).
1
  This database is accessible via http://www.ilo.org/ilostat/GWR.
ContentsContents
95Annex 5. Regional groupings
Annexes
Regional groupings
5
Developed Economies
and European Union
European Union
Austria
Belgium
Bulgaria
Croatia
Cyprus
Czech Republic
Denmark
Estonia
Finland
France
Germany
Greece
Hungary
Ireland
Italy
Latvia
Lithuania
Luxembourg
Malta
Netherlands
Poland
Portugal
Romania
Slovakia
Slovenia
Spain
Sweden
United Kingdom
North America
Canada
United States
Other Developed Economies
Australia
Israel
Japan
New Zealand
Western Europe (non-EU)
Iceland
Norway
Switzerland
Central and South-
Eastern Europe
(non-EU) and CIS
Central and
South-Eastern Europe
Albania
Bosnia and Herzegovina
Montenegro
Serbia
The former Yugoslav Republic
of Macedonia
Turkey
Commonwealth
of Independent States
Armenia
Azerbaijan
Belarus
Georgia
Kazakhstan
Kyrgyzstan
Moldova, Republic of
Russian Federation
Tajikistan
Turkmenistan
Ukraine
Uzbekistan
South Asia
Afghanistan
Bangladesh
Bhutan
India
Maldives
Nepal
Pakistan
Sri Lanka
South-East Asia
and the Pacific
South-East Asia
Brunei Darussalam
Cambodia
Indonesia
Lao People’s Democratic
Republic
Malaysia
Myanmar
Philippines
Singapore
Thailand
Timor-Leste
Viet Nam
Pacific Islands
Fiji
Papua New Guinea
Solomon Islands
East Asia
China
Hong Kong (China)
Korea, Democratic People’s
Republic of
Korea, Republic of
Macau (China)
Mongolia
Taiwan (China)
Latin America
and the Caribbean
Caribbean
Bahamas
Barbados
Cuba
Dominican Republic
Guadeloupe
Guyana
Haiti
Jamaica
Martinique
Puerto Rico
Suriname
Trinidad and Tobago
Central America
Belize
Costa Rica
El Salvador
Guatemala
Honduras
Mexico
Nicaragua
Panama
South America
Argentina
Bolivia, Plurinational State of
Brazil
Chile
Colombia
Ecuador
Paraguay
Peru
Uruguay
Venezuela, Bolivarian
Republic of
Middle East
Bahrain
Iran, Islamic Republic of
Iraq
Jordan
Kuwait
Lebanon
Oman
Qatar
Saudi Arabia
Syrian Arab Republic
United Arab Emirates
Occupied Palestinian Territories
Yemen
North Africa
Algeria
Egypt
Libya
Morocco
Sudan
Tunisia
Sub-Saharan Africa
Eastern Africa
Burundi
Comoros
Eritrea
Ethiopia
Kenya
Madagascar
Malawi
Mauritius
Mozambique
Réunion
Rwanda
Somalia
Tanzania, United Republic of
Uganda
Zambia
Zimbabwe
Middle Africa
Angola
Cameroon
Central African Republic
Chad
Congo
Congo, Democratic Republic of
Equatorial Guinea
Gabon
Southern Africa
Botswana
Lesotho
Namibia
South Africa
Swaziland
Western Africa
Benin
Burkina Faso
Cabo Verde
Côte d’Ivoire
Gambia
Ghana
Guinea
Guinea-Bissau
Liberia
Mali
Mauritania
Niger
Nigeria
Senegal
Sierra Leone
Togo
ContentsContents
BibliographyBibliography
ContentsContents
97Bibliography
African Development Bank Group. 2012. Income inequality in Africa, Briefing Note 5, briefing notes for
AfDB’s long-term strategy.
Ahuja, A.; Nabar, M. 2012. Investment-led growth in China: Global spillovers, IMF Working Paper
No. 12/267 (Washington, DC, International Monetary Fund).
Aiyar, S.; Duval, R.; Puy, D.; Wu, Y.; Zhang, L. 2013. Growth slowdowns and the middle-income trap,
IMF Working Paper No. 13/71 (Washington, DC, International Monetary Fund).
Alesina, A.; Perotti, R. 1996. “Income distribution, political instability, and investment”, in European
Economic Review, Vol. 40, No. 6, pp. 1203–1228.
Alvaredo, F.; Gasparini, L. 2013. Recent trends in inequality and poverty in developing countries, Working
Paper No. 151, Center for Distributive, Labor and Social Studies (Universidad Nacional de la
Plata, La Planta).
Angel-Urdinola, D.F.; Tanabe, K. 2012. Micro-determinants of informal employment in the Middle East and
North Africa region, Social Protection Discussion Paper No. 1201 (Washington, DC, World Bank).
Asian Development Bank (ADB). 2014. Asian Development Outlook 2014 Update: Asia in global value chains
(Mandaluyong City).
Autor, D.H. 2010. The polarization of job opportunities in the U.S. labor market: implications for employment
and earnings (Washington, DC, The Center for American Progress and The Hamilton Project).
—; Levy, F.; Murnane, R. 2003. “The skill content of recent technological change: An empirical exploration”,
in Quarterly Journal of Economics, Vol. 118, No. 4, pp. 1279–1333.
Baker, S.; Bloom, N.; Davis, S. 2013. Measuring economic policy uncertainty. Available at:
www.policyuncertainty.com/media/BakerBloomDavis.pdf [10 Jan. 2015].
Ball, L.; Leigh, D.; Loungani, P. 2013. Okun’s Law: Fit at 50?, IMF Working Paper, No. 13/10 (Washington,
DC, International Monetary Fund).
Banco Bilbao Vizcaya Argentaria (BBVA). 2014. Country Risk Quarterly Report, September 2014 (Madrid).
Available at: https://www.bbvaresearch.com/en/publicaciones/country-risk-third-quarter-2014/
[7 Jan. 2015].
Bassi, M.; Busso, M.; Urzúa, S.; Vargas, J. 2012. Disconnected: Skills, education and employment in Latin
America (Washington, DC, Inter-American Development Bank).
Berg, A.; Ostry, J. 2011. Inequality and unsustainable growth: Two sides of the same coin?, IMF Staff
Discussion Note No. 11/08 (Washington, DC, International Monetary Fund).
Bivens, J. 2008. Everybody wins, except for most of us: What economics teaches about globalization
(Washington, DC, Economic Policy Institute).
Brynjolfsson, E.; McAfee, A. 2014. The second machine age: Work, progress, and prosperity in a time of
brilliant technologies (New York, W.W. Norton  Company).
Buckley, C. 2014. “China moves to ease home-registration rules in urbanization push”, in The New York
Times, 30 July.
Bureau of Labor Statistics (BLS). 2013. Occupational Employment Statistics Survey 2013 (Washington, DC,
United States Department of Labor). Available at: http://www.bls.gov/oes/current/oes_tec.htm
[11 Jan. 2015].
Cingano, F. 2014. Trends in income inequality and its impact on economic growth, OECD Social,
Employment and Migration Working Paper No. 163 (Paris, Organisation for Economic
Co-operation and Development).
ContentsContents
98 World Employment and Social Outlook – Trends 2015
The Conference Board. 2014. From not enough jobs to not enough workers. Research Report,
R‑1558‑14‑RR (New York, NY).
Davis, S.J.; Haltiwanger, J. 2014. Labor market fluidity and economic performance, paper prepared for the
Federal Reserve Bank of Kansas City’s economic policy symposium on Re-Evaluating Labor
Market Dynamics, Jackson Hole (WY), 21–23 Aug. Available at: http://www.kc.frb.org/publicat/
sympos/2014/083014-1.pdf [7 Jan. 2015].
Economic and Social Commission for Western Asia (ESCWA). 2014. Sustainable development goals…
An Arab regional perspective, discussion paper prepared by the ESCWA and presented at the
Arab High Level Forum on Sustainable Development, Amman, 2–4 Apr.
—; League of Arab States. 2013. Arab Millennium Development Goals report: Facing challenges and looking
beyond 2015 (Beirut, ESCWA).
Economic Commission for Latin America and the Caribbean (ECLAC); International Labour Organization
(ILO). 2014. The employment situation in Latin America and the Caribbean: Conditional transfer
programmes and the labour market, No. 10, May (Santiago, Chile).
Eichengreen, B.; Park, D.; Shin, K. 2013. Growth slowdowns redux: New evidence on the middle-income trap,
NBER Working Paper No. 18673 (Cambridge, MA, National Bureau of Economic Research).
—; —; —. 2012. “When fast growing economies slow down: International evidence and implications for
China”, in Asian Economic Papers, Vol. 11, pp. 42–87.
Elsby, M.; Hobijn, B.; Sahin, A. 2013. “Unemployment dynamics in the OECD”, in Review of Economics and
Statistics, Vol. 95, No. 2, pp. 530–548.
Ernst, E.; Viegelahn, C. 2014. Hiring uncertainty: A new labour market indicator (ILO, Geneva).
Available at: http://www.policyuncertainty.com/media/HiringUncertainty.pdf [7 Jan. 2015].
—; —; Narasimhan, V.; Duda, M. Forthcoming. Estimating and projecting global wage growth.
ILO Research Department Working Paper (Geneva, ILO).
European Commission (EC); International Labour Organization (ILO). 2014. Crisis responses, competitiveness
and jobs, ILO Research Department (Geneva).
Eurostat. 2010. Structure of Earnings Survey 2010. Available at: http://ec.europa.eu/eurostat/cache/
metadata/en/earn_ses2010_esms.htm [11 Jan. 2015].
Export-Import Bank of India (EXIM). 2013. West Africa: A study of India’s trade and investment potential,
Research Brief No. 72 (Mumbai). Available at: http://www.eximbankindia.in/sites/default/files/
ind-eco.pdf [11 Jan. 2015].
Felipe, J.; Mehta, A.; Rhee, C. 2014. Manufacturing matters… but it’s the jobs that count, ADB Economics
Working Paper Series No. 420 (Manila, Asian Development Bank).
Galor, O.; Zeira, J. 1993. “Income distribution and macroeconomics”, in The Review of Economic Studies,
Vol. 60, No. 1, pp. 35–52.
Ghani, E.; O’Connell, S.D. 2014. Can service be a growth escalator in low income countries?, Policy Research
Working Paper No. 6971 (Washington, DC, World Bank).
Göbel, C.; Zwick, T. Forthcoming. “Which personnel measures are effective in increasing productivity of old
workers?” in Labour Economics.
Goos, M.; Manning, A. 2007. “Lousy and lovely jobs: The rising polarization of work in Britain”,
in The Review of Economics and Statistics, Vol. 89, No. 1, pp. 118–133.
Gordo, L.; Skirbekk, V. 2013. “Skill demand and the comparative advantage of age: Jobs tasks and earnings
from the 1980s to the 2000s in Germany”, in Labour Economics, Vol. 22, pp. 61–69.
Hausman, R.; Pritchett, L.; Rodrik, D. 2005. “Growth accelerations”, in Journal of Economic Growth, Vol. 10,
No. 4, pp. 303–329.
International Institute for Labour Studies (IILS). 2013. World of Work Report 2013: Repairing the economic
and social fabric (Geneva, ILO).
International Labour Organization (ILO). 2012. Statistical update on employment in the informal economy
(Geneva). Available at: http://laborsta.ilo.org/applv8/data/INFORMAL_ECONOMY/2012-06-
Statistical%20update%20-%20v2.pdf [7 Jan. 2015].
—. 2013a. Key Indicators of the Labour Market (KILM), 8th edition (Geneva).
—. 2013b. 2013 Labour Overview: Latin America and the Caribbean (Lima, ILO Regional Office).
—. 2013c. Asia-Pacific Labour Market Update, Dec. (Bangkok, ILO Regional Office).
—. 2013d. Global Employment Trends 2013: Recovering from a second jobs dip (Geneva).
ContentsContents
99Bibliography
—. 2014a. Global Employment Trends 2014: Risk of a jobless recovery? (Geneva).
—. 2014b. Global Wage Report 2014/15: Wages and income inequality (Geneva).
—. 2014c. Greece: Productive jobs, Studies on growth with equity, Research Department (Geneva).
—. 2014d. Spain: Growth with jobs, Studies on growth with equity, Research Department (Geneva).
—. 2014e. Twenty-first century challenges for the Americas: Full and productive employment and decent
work, Report of the Director-General for the 18th American Regional Meeting, Lima, Peru,
13–16 Oct. (Geneva).
—. 2014f. Thematic labour overview. Transition to formality in Latin America and the Caribbean (Lima,
ILO Regional Office).
—. 2014g. Panorama Laboral 2014 (Lima, ILO Regional Office).
—. 2014h. Thailand Labour Market Update, Mar. (Bangkok, ILO Country Office for Thailand, Cambodia and
Lao People’s Democratic Republic). Available at: http://www.ilo.org/wcmsp5/groups/public/---
asia/---ro-bangkok/---sro-bangkok/documents/publication/wcms_240328.pdf [11 Jan. 2015].
—. 2014i. Samoa Labour Market Update, Aug. (Suva, ILO Office for Pacific Island Countries).
—. 2014j. Assessment of the impact of Syrian refugees in Lebanon and their employment profile (Beirut,
ILO Regional Office).
—. 2014k. The impact of the Syrian refugee crisis on the labour market in Jordan: A preliminary analysis
(Beirut, ILO Regional Office).
—. 2014l. World of Work Report 2014: Developing with jobs (Geneva).
—. 2014m. World Social Protection Report 2014/15: Building economic recovery, inclusive development and
social justice (Geneva).
—. Forthcoming. Latin America: Effectiveness of ALMPs Studies on growth with equity (Geneva).
—; Asian Development Bank (ADB). 2014. ASEAN Community 2015: Managing integration for better jobs
and shared prosperity (Bangkok).
—; United Nations Development Programme (UNDP). 2012. Rethinking economic growth: Towards
productive and inclusive Arab societies (Beirut, ILO Regional Office).
International Monetary Fund (IMF). 2014a. People’s Republic of China, IMF Country Report No. 14/235
(Washington, DC). Available at: http://www.imf.org/external/pubs/ft/scr/2014/cr14235.pdf
[11 Jan. 2015].
—. 2014b. Regional Economic Outlook: Asia and the Pacific, Oct. (Washington, DC).
—. 2014c. Regional Economic Outlook: Middle East and Central Asia, Oct. (Washington, DC).
—. 2014d. World Economic Outlook: Legacies, clouds, uncertainties, Oct. (Washington, DC).
Jaimovich, N.; Siu, H. 2012. The trend is the cycle: Job polarization and jobless recoveries, NBER Working
Paper No. 18334 (Cambridge, MA, National Bureau of Economic Research).
Kapsos, S.; Bourmpoula, V. 2013. Employment and economic class in the developing world, ILO Research
Paper, No. 6 (Geneva, ILO). Available at: http://www.ilo.org/wcmsp5/groups/public/---dgreports/--
-inst/documents/publication/wcms_216451.pdf [7 Jan. 2015].
—; Silberman, A.; Bourmpoula, E. 2014. Why is female labour force declining so sharply in India?,
ILO Research Paper No. 10 (Geneva).
Kumhof, M.; Rancière, R. 2010. Inequality, leverage and crises. IMF Working Paper No. 10/268
(Washington, DC, International Monetary Fund).
Lustig, N.; Lopez-Calva, L.F.; Ortiz-Juarez, E. 2013. Deconstructing the decline in inequality in Latin
America, Policy Research Working Paper Series No. 6552 (Washington, DC, World Bank).
ManpowerGroup. 2013. 2013 Talent Shortage Survey: Research Results (Milwaukee, WI).
Mayer, G. 2014. The trend in long-term unemployment and characteristics of workers unemployed for two
years or more (Washington, DC, Congressional Research Service).
Michaels, G.; Natraj, A.; Van Reenen, J. 2010. “Has ICT polarized skill demand? Evidence from eleven
countries over twenty-five years”, in The Review of Economics and Statistics, Vol. 96, No. 1,
pp. 60–77.
Mishel, L.; Bivens, J.; Gould, E.; Shierholz, H. 2012. The State of Working America, 12th edition (Ithaca, NY,
ILR Press of Cornell University Press).
—; Schmitt, J.; Shierholz, H. 2014. “Wage inequality: A story of policy choices”, in New Labor Forum, pp. 1–6.
ContentsContents
100 World Employment and Social Outlook – Trends 2015
National Bureau of Statistics of China (NBS). 2014. Statistical communiqué of the People’s Republic of
China on the 2013 national economic and social development.
—. 2014. China Statistical Abstract, 2014 (Beijing).
Organisation for Economic Co-operation and Development (OECD). 2012. OECD Employment Outlook 2012
(Paris).
Ostry, J.; Berg, A.; Tsangarides, C. 2014. Redistribution, inequality, and growth, IMF Staff Discussion
Note 14/02 (Washington, DC, International Monetary Fund).
Perova, E.; Vakis, R. 2009. Welfare impacts of the “Juntos” program in Peru: Evidence from a
non‑experimental evaluation (Washington, DC, World Bank).
—; —. 2011. Más tiempo en el programa, mejores resultados: duración e impactos del programa JUNTOS
en el Perú (Washington, DC, World Bank).
Rajan, R. 2010. Fault lines: How hidden fractures still threaten the world economy (Princeton, NJ, Princeton
University Press).
Rodrik, D. 2013. The perils of premature deindustrialization, Project Syndicate, 11 Oct. Available at:
http://www.project-syndicate.org/commentary/dani-rodrikdeveloping-economies--missing-
manufacturing [11 Jan. 2015].
—. 2014. Are services the new manufactures? Project Syndicate, 13 Oct. Available at: http://www.project-
syndicate.org/commentary/are-services-the-new-manufactures-by-dani-rodrik-2014-10
[11 Jan. 2015].
Ruckelshaus, C.; Leberstein, S. 2014. Manufacturing low pay: Declining wages in the jobs that built
America’s middle class (New York, NY, National Employment Law Project).
Shimer, R. 2012. “Reassessing the ins and outs of unemployment”, in Review of Economic Dynamics,
Vol. 15, No. 2, pp. 127–148.
Solt, F. 2014. The Standardized World Income Inequality Database, Working Paper, SWIID Version 5.0, Oct.
Stiglitz, J. 2013. The price of inequality: How today’s divided society endangers our future (New York, NY,
W.W. Norton  Company).
Subramanian, A. 2014. Premature deindustrialization, 22 Apr. (Washington, DC, Center for Global Development).
Available at: http://www.cgdev.org/blog/premature-de-industrialization [11 Jan. 2015].
Teulings, C.; Hartog, J. 1998. Corporatism or competition? Labour contracts, institutions and wage structures
in international comparison (Cambridge, Cambridge University Press).
United Nations (UN). 2014. Draft outcome document of the third International Conference on Small Island
Developing States, transmitted to the third International Conference on Small Island Developing
States, Apia, Samoa, 1–4 Sep.
United Nations Conference on Trade and Development (UNCTAD). 2014. UNCTAD Statistics (New York).
United Nations Population Fund (UNFPA). 2014. State of World Population 2014 (New York).
Viegelahn, C. Forthcoming. Structural trends in the labour market: Headwinds or boosts to economic growth?
(Geneva, ILO).
Weinberg, B. 2002.  “New technologies, skills obsolescence, and skill complementarity”, in A. de Griep,
J. van Loo and K. Mayhew (eds): The Economics of Skills Obsolescence, Research in Labor
Economics, Vol. 21, pp. 101–118.
World Bank. 2013. Jobs for shared prosperity: Time for action in the Middle East and North Africa
(Washington, DC).
—. 2014a. Global Economic Prospects: Shifting priorities; building for the future, June (Washington, DC).
—. 2014b. The economic impact of the 2014 Ebola epidemic: Short and medium term estimates for Guinea,
Liberia, and Sierra Leone (Washington, DC).
—. 2014c. World Development Indicators 2014 (Washington, DC).
World Health Organization (WHO). 2014. Ebola response roadmap: Situation report (Geneva). Available at:
http://apps.who.int/ebolaweb/sitreps/20141231/20141231.pdf [11 Jan. 2015].
Zaccone, J. 2012. Has globalization destroyed the American middle class? (Lynbrook, NY, National Jobs for
All Coalition).
ContentsContents
I S B N 978-92-2-129259-3
9 7 8 9 2 2 1 2 9 2 5 9 3
The World Employment and Social Outlook – Trends 2015 provides
a global overview of recent trends in employment, unemployment, labour
force participation, productivity, as well as different dimensions of job
quality, such as vulnerable employment, informal jobs and working poverty.
The overview covers all countries in the world and describes patterns in the
main regions and sectors. In addition, the report examines income and social
developments and provides an indicator of social unrest.
The volume also presents projections for the period 2015–19 for employment,
unemployment and the labour force.
A key finding of this research is that the expansion of the world economy has
been too weak to close the significant employment and social gaps that have
emerged since the beginning of the global crisis in 2008. Around 201 million
people were unemployed in the world in 2014, and the projections are for
a further increase in global unemployment by 11 million people over the next
five years.
Income inequalities are widening as the job market is changing profoundly.
A growing number of jobs once performed by semi-skilled workers have
become automated.

Trends 2015

  • 1.
  • 2.
    world employment andsocial outlook ContentsContents
  • 3.
    Trends 2015 world employment andsocial outlook INTERNATIONAL LABOUR OFFICE  •  GENEVA ContentsContents
  • 4.
    World employment andsocial outlook: Trends 2015 / International Labour Office. – Geneva: ILO, 2015 ISBN  978-92-2-129259-3  (print) ISBN  978-92-2-129260-9 (web pdf) International Labour Office employment / unemployment / youth employment / youth unemployment / labour policy / economic recovery / regional development / Africa / Asia / Caribbean / developed countries / Europe / EU countries / Latin America / Middle East / Pacific 13.01.3 The designations employed in ILO publications, which are in conformity with United Nations practice, and the presentation of material therein do not imply the expression of any opinion whatsoever on the part of the International Labour Office concerning the legal status of any country, area or territory or of its authorities, or concerning the delimitation of its frontiers. The responsibility for opinions expressed in signed articles, studies and other contributions rests solely with their authors, and publication does not constitute an endorsement by the International Labour Office of the opinions expressed in them. Reference to names of firms and commercial products and processes does not imply their endorsement by the International Labour Office, and any failure to mention a particular firm, commercial product or process is not a sign of disapproval. ILO publications and digital products can be obtained through major booksellers and digital distribution platforms, or ordered directly from ilo@turpin-distribution.com. For more information, visit our website: www.ilo.org/publns or contact ilopubs@ilo.org. Copyright © International Labour Organization 2015 First published 2015 Publications of the International Labour Office enjoy copyright under Protocol 2 of the Universal Copyright Convention. Nevertheless, short excerpts from them may be reproduced without authorization, on condition that the source is indicated. For rights of reproduction or translation, application should be made to ILO Publications (Rights and Licensing), International Labour Office, CH-1211 Geneva 22, Switzerland, or by email: rights@ilo.org. The International Labour Office welcomes such applications. Libraries, institutions and other users registered with reproduction rights organizations may make copies in accordance with the licences issued to them for this purpose. Visit www.ifrro.org to find the reproduction rights organization in your country. ILO Cataloguing in Publication Data This publication was produced by the Document and Publications Production, Printing and Distribution Branch (PRODOC) of the ILO. Graphic and typographic design, manuscript preparation, copy editing, layout and composition, proofreading, printing, electronic publishing and distribution. PRODOC endeavours to use paper sourced from forests managed in an environmentally sustainable and socially responsible manner. Code: DTP-WEI-CORR-ATA-DISTR ContentsContents
  • 5.
    5Contents Acknowledgements  . .. . . . . . . . . . . . . . . . . . . . . . . . . . . . . . . . . . . . . . . . . . . . . . . . . . . 9 Summary: Renewed turbulence over the employment horizon  . . . . . 11 1. Global employment and social developments . . . . . . . . . . . . . . . . . . . . 15 Introduction . . . . . . . . . . . . . . . . . . . . . . . . . . . . . . . . . . . . . . . . . . . . . . . . . . . . . . . . . 15 A. Labour market trends  . . . . . . . . . . . . . . . . . . . . . . . . . . . . . . . . . . . . . . . . . . . . . 16 B. Social developments and trends  . . . . . . . . . . . . . . . . . . . . . . . . . . . . . . . . . . . 27 Appendix  . . . . . . . . . . . . . . . . . . . . . . . . . . . . . . . . . . . . . . . . . . . . . . . . . . . . . . . . . . 31 2. Regional developments: An uneven and uncertain recovery . . . . 33 Developed Economies and European Union . . . . . . . . . . . . . . . . . . . . . . . . . . . 33 Central and South-Eastern Europe (non-EU) and the CIS .. . . . . . . . . . . . . . . . 38 Latin America and the Caribbean  . . . . . . . . . . . . . . . . . . . . . . . . . . . . . . . . . . . . 41 East Asia . . . . . . . . . . . . . . . . . . . . . . . . . . . . . . . . . . . . . . . . . . . . . . . . . . . . . . . . . . . 44 South-East Asia and the Pacific . . . . . . . . . . . . . . . . . . . . . . . . . . . . . . . . . . . . . . . 46 South Asia  . . . . . . . . . . . . . . . . . . . . . . . . . . . . . . . . . . . . . . . . . . . . . . . . . . . . . . . . . 49 Middle East and North Africa  . . . . . . . . . . . . . . . . . . . . . . . . . . . . . . . . . . . . . . . . 51 Sub-Saharan Africa . . . . . . . . . . . . . . . . . . . . . . . . . . . . . . . . . . . . . . . . . . . . . . . . . 53 3. Medium-term challenges for jobs with equity   . . . . . . . . . . . . . . . . . . . . 57 Introduction . . . . . . . . . . . . . . . . . . . . . . . . . . . . . . . . . . . . . . . . . . . . . . . . . . . . . . . . . 57 A. Shrinking labour supply and population ageing   . . . . . . . . . . . . . . . . . . . . 57 B. Changes in occupational patterns  . . . . . . . . . . . . . . . . . . . . . . . . . . . . . . . . . 60 C. Income inequality and economic growth accelerations and slowdowns   . 64 Concluding remarks . . . . . . . . . . . . . . . . . . . . . . . . . . . . . . . . . . . . . . . . . . . . . . . . . 65 Appendix  . . . . . . . . . . . . . . . . . . . . . . . . . . . . . . . . . . . . . . . . . . . . . . . . . . . . . . . . . . 66 Annexes 1. Global and regional figures . . . . . . . . . . . . . . . . . . . . . . . . . . . . . . . . . . . . . . . 71 2. Labour market estimates and projections . . . . . . . . . . . . . . . . . . . . . . . . . . . . 90 3. Occupational and sectoral employment estimates and projections .. . . . 93 4. Real wage growth estimates and projection . . . . . . . . . . . . . . . . . . . . . . . . . 94 5. Regional groupings . . . . . . . . . . . . . . . . . . . . . . . . . . . . . . . . . . . . . . . . . . . . . . . 95 Bibliography  . . . . . . . . . . . . . . . . . . . . . . . . . . . . . . . . . . . . . . . . . . . . . . . . . . . . . . . . . . . . . 97 contents ContentsContents
  • 6.
    6 World Employmentand Social Outlook – Trends 2015 List of figures 1.1 Global growth and its components  . . . . . . . . . . . . . . . . . . . . . . . . . . . . . . . . . . . . . . 15 1.2 Global jobs gap, 2014–19 . . . . . . . . . . . . . . . . . . . . . . . . . . . . . . . . . . . . . . . . . . . . . 16 1.3 Global unemployment, 2014–19  . . . . . . . . . . . . . . . . . . . . . . . . . . . . . . . . . . . . . . . . 17 1.4 Differences between projected and observed unemployment, 2007–13 . . . . . . . . 18 1.5 Global labour force participation rate: Projections vs trend, 1990–2030 . . . . . . . 20 1.6 Change in youth unemployment, 2019 vs 2014 . . . . . . . . . . . . . . . . . . . . . . . . . . . . 21 1.7 Gender gaps in the labour market, 2014 vs 2019 . . . . . . . . . . . . . . . . . . . . . . . . . . 22 1.8 Sectoral employment growth, selected sectors . . . . . . . . . . . . . . . . . . . . . . . . . . . . . 23 1.9 Development of employment by occupation . . . . . . . . . . . . . . . . . . . . . . . . . . . . . . . 24 1.10 Growth and the productivity impact of lower labour market turnover . . . . . . . . . . 25 1.11 The impact of growth accelerations and slowdowns on changes in unemployment  . . . . . . . . . . . . . . . . . . . . . . . . . . . . . . . . . . . . . . . . . . . . . . . . . . . . . 26 1.12 Vulnerable employment as a share of total employment in developing economies, 2007–19 . . . . . . . . . . . . . . . . . . . . . . . . . . . . . . . . . . . . . . . . . . . . . . . . . . 27 1.13 Employment by economic class in developing countries, 1991–2019 . . . . . . . . . . 28 1.14 Income inequality in advanced and developing economies and regions . . . . . . . 28 1.15 Confidence in government, 2012 vs 2013 .. . . . . . . . . . . . . . . . . . . . . . . . . . . . . . . . 29 1.16 Social unrest and youth unemployment . . . . . . . . . . . . . . . . . . . . . . . . . . . . . . . . . . . 30 2.1 Reaction of wages to changes in unemployment, 1994–2019 . . . . . . . . . . . . . . . . 35 2.2 Unemployment rates by age in the EU-28, Q2 2014 . . . . . . . . . . . . . . . . . . . . . . . . 35 2.3 Unemployment rates in the Central and South-Eastern Europe and CIS region and selected countries within, 2008, 2009 and 2014  . . . . . . . . . . . . . . . . . . . . . . 40 2.4 GDP annual growth in LAC and advanced economies, 2003–15  . . . . . . . . . . . . . 41 2.5 Inequality levels remain high in comparative terms as measured by Gini index .. 43 2.6 Employment level in Malaysia by gender, 2010 and 2013   . . . . . . . . . . . . . . . . . . 48 2.7 Gender differences in labour force participation rates, selected countries  . . . . . . 50 3.1 Impact of labour supply characteristics on the probability of economic growth slowdowns and accelerations .. . . . . . . . . . . . . . . . . . . . . . . . . . . . . . . . . . . . . . . . . . 58 3.2 Correlations between type of occupation and income levels, developing economies, 1991–2013 .. . . . . . . . . . . . . . . . . . . . . . . . . . . . . . . . . . . . . 61 3.3 Impact of manufacturing employment changes on the probability of economic growth slowdowns and accelerations . . . . . . . . . . . . . . . . . . . . . . . . . 62 3.4 Share of workers in manufacturing employment when manufacturing employment was at its peak, 1992–2013 . . . . . . . . . . . . . . . . . . . . . . . . . . . . . . . . . 63 3.5 Impact of income inequality on the probability of economic growth slowdowns and accelerations .. . . . . . . . . . . . . . . . . . . . . . . . . . . . . . . . . . . . . . . . . . . . . . . . . . . . 64 A.1 Share of economic growth slowdowns and accelerations in total number of observations, by income per capita level . . . . . . . . . . . . . . . . . . . . . . . . . . . . . . . 67 ContentsContents
  • 7.
    7Contents List of tables 1.1 Unemployment developments, 2007–17  . . . . . . . . . . . . . . . . . . . . . . . . . . . . . . . . . . 19 1.2 Wage and productivity growth (107 countries; annual average), selected periods  . 25 1.3 Projection differences, 2013 vs 2014 .. . . . . . . . . . . . . . . . . . . . . . . . . . . . . . . . . . . . 31 2.1 Economic and social developments in Developed Economies and EU, 2009–19 . 34 2.2 Long-term unemployment and social indicators in the EU-27 . . . . . . . . . . . . . . . . . 36 2.3 Economic and social developments in Central and South-Eastern Europe (non-EU) and CIS, 2009–19 .. . . . . . . . . . . . . . . . . . . . . . . . . . . . . . . . . . . . . . . . . . . . . . . . . . . 39 2.4 Income inequality and poverty in selected countries of Central and South-Eastern Europe and CIS  . . . . . . . . . . . . . . . . . . . . . . . . . . . . . 40 2.5 Economic and social developments in Latin America and the Caribbean, 2009–19 . . . . . . . . . . . . . . . . . . . . . . . . . . . . . . . . . . . . . . . . . . 42 2.6 Economic and social developments in East Asia, 2009–19 .. . . . . . . . . . . . . . . . . . 45 2.7 Economic and social developments in South-East Asia and the Pacific, 2009–19 . 46 2.8 Economic and social developments in South Asia, 2009–19  . . . . . . . . . . . . . . . . . 50 2.9 Poverty headcount ratio and inequality, selected countries, latest available data  . 50 2.10 Economic and social developments in Middle East and North Africa, 2009–19 . 52 2.11 Economic and social developments in Sub-Saharan Africa, 2009–19 .. . . . . . . . . 55 A.1 Data sources for labour market variables  . . . . . . . . . . . . . . . . . . . . . . . . . . . . . . . . . 67 A.2 Determinants of economic growth slowdowns . . . . . . . . . . . . . . . . . . . . . . . . . . . . . 68 A.3 Determinants of economic growth accelerations .. . . . . . . . . . . . . . . . . . . . . . . . . . . 69 List of boxes 1.1 Changes to unemployment projections  . . . . . . . . . . . . . . . . . . . . . . . . . . . . . . . . . . . 18 1.2 Medium-term prospects for the global labour market .. . . . . . . . . . . . . . . . . . . . . . . 20 2.1 Competitiveness and wages in Europe  . . . . . . . . . . . . . . . . . . . . . . . . . . . . . . . . . . . 34 2.2 The case of Greece . . . . . . . . . . . . . . . . . . . . . . . . . . . . . . . . . . . . . . . . . . . . . . . . . . . 37 2.3 Geopolitical tensions are affecting economies in Central and South-Eastern Europe and the CIS  . . . . . . . . . . . . . . . . . . . . . . . . . . . . . . . . . . . . . . . . . . . . . . . . . . . 38 2.4 Social protection programmes in Latin America: The case of Peru . . . . . . . . . . . . . 43 2.5 China’s graduates: Not enough good jobs . . . . . . . . . . . . . . . . . . . . . . . . . . . . . . . . 45 2.6 Female employment in Malaysia . . . . . . . . . . . . . . . . . . . . . . . . . . . . . . . . . . . . . . . . 48 2.7 The labour market impact of the Syrian refugee crisis on Jordan and Lebanon . . . 53 2.8 Economic impact of the Ebola outbreak for the most affected countries and the wider region .. . . . . . . . . . . . . . . . . . . . . . . . . . . . . . . . . . . . . . . . . . . . . . . . . 54 3.1 The hollowing-out of medium-skilled jobs  . . . . . . . . . . . . . . . . . . . . . . . . . . . . . . . . . 60 3.2 Is premature de-industrialization a concern? .. . . . . . . . . . . . . . . . . . . . . . . . . . . . . . 62 ContentsContents
  • 8.
    9Acknowledgements Preparations for theWorld Employment and Social Outlook – Trends 2015 were led by the Job‑friendly Macroeconomic Policies team in the ILO Research Department, headed by Ekkehard Ernst. The project was supervised by Raymond Torres, Director of the Research Department and Moazam Mahmood, Deputy Director. The report was prepared by: Vladimir Andrianov, Valia Bourmpoula, Juan Chacaltana, Sukti Dasgupta, Marta Duda, Ekkehard Ernst, Salwa Haidar, Richard Horne, Phu Huynh, Aya Jafaar, Sameer Khatiwada, Kee Beom Kim, Stefan Kühn, Mary Kawar, Xinrong Liu, Makiko Matsumoto, Rossana Merola, Santo Milasi, Michael Mwasikakata, Veda Narasimhan, Alena Nesporova, Prakash Pathak, Clemente Pignatti, Damien Roche, Steven Tobin, Raymond Torres, Sher Verick and Christian Viegelahn. Specific mention should be given to Valia Bourmpoula for preparing the global and regional esti- mates on the basis of the dedicated econometric models; Veda Narasimhan for preparing the regional wage projections; Salwa Haidar for helpful research assistance; and Judy Rafferty for assistance with the publication process. The publication would not have been possible without the contributions of other members of the Job-friendly Macroeconomic Policies team, notably Philippe Blet and Anne Drougard. The team wishes to acknowledge the comments and suggestions provided by Sandra Polaski, Deputy Director-General for Policy and James Howard from Director-General’s Office. Comments on earlier drafts were also provided by ILO Regional and Country Offices as well as several Policy Departments, notably the Social Protection Department, the Sectoral Activities Department and the Conditions of Work and Equality Department. We would like to express our thanks to colleagues in the ILO Department of Communication and Public Information for their continued collaboration and support in diffusing the publication. The analysis provided in the World Employment and Social Outlook relies heavily on available data. The ILO Research Department takes this opportunity to thank all institutions involved in the collection and dissemination of labour market information, including national statistical agencies and the ILO Department of Statistics. Finally, the team also benefited from a careful review and helpful comments on an earlier versions of the report by the Research Department of the International Monetary Fund, the United Nations Department of Economic and Social Affairs and the World Bank’s Development Prospects Group. acknowledgements ContentsContents
  • 9.
    11Summary The world economycontinues to expand at rates well below the trends that preceded the onset of the global crisis in 2008 and is unable to close the significant employment and social gaps that have emerged. The challenge of bringing unemployment and underemployment back to pre-crisis levels now appears as daunting a task as ever, with considerable societal and economic risks associated with this situation. The global employment gap caused by the crisis continues to widen This report finds that the global employment outlook will deteriorate in the coming five years. Over 201 million people were unemployed in 2014 around the world, over 31 million more than before the start of the global crisis. And, global unemployment is expected to increase by 3 million in 2015 and by a further 8 million in the following four years. The global employment gap, which measures the number of jobs lost since the start of the crisis, currently stands at 61 million. If new labour market entrants over the next five years are taken into account, an additional 280 million jobs need to be created by 2019 to close the global employment gap caused by the crisis. Youth, especially young women, continue to be disproportionately affected by unemployment. Almost 74 million young people (aged 15–24) were looking for work in 2014. The youth un- employment rate is practically three times higher than is the case for their adult counterparts. The heightened youth unemployment situation is common to all regions and is occurring despite the trend improvement in educational attainment, thereby fuelling social discontent. The employment situation is improving in some advanced economies, while remaining difficult in much of Europe… There is a reversal across regions in the employment outlook. Job recovery is proceeding in advanced economies taken as a group – though with significant differences between countries. Unemployment is falling, sometimes retrieving pre-crisis rates, in Japan, the United States and some European countries. In southern Europe, unemployment is receding slowly, though from overly high rates. … and is deteriorating in emerging and developing economies By contrast, after a period of better performance compared to the global average, the situation is deteriorating in a number of middle-income and developing regions and economies, such as Latin America and the Caribbean, China, the Russian Federation and a number of Arab countries. The employment situation has not improved much in sub-Saharan Africa, despite better economic growth performance until recently. In most of these countries, underemployment and informal employment are expected to remain stubbornly high over the next five years. Summary renewed turbulence over the employment horizon ContentsContents
  • 10.
    12 World Employmentand Social Outlook – Trends 2015 The significant fall in oil prices that has continued in early 2015 will, if sustained, improve employment prospects somewhat in importing countries. However, this is unlikely to offset the impacts of a still fragile and uneven recovery – one that will worsen for oil exporters. As a consequence, the improvements in vulnerable employment have stalled in emerging and developing countries. The incidence of vulnerable employment is projected to remain broadly constant at around 45 per cent of total employment over the next two years, in stark contrast to the declines observed during the pre-crisis period. The number of workers in vulnerable employment has increased by 27 million since 2012, and currently stands at 1.44 billion worldwide. Sub- Saharan Africa and South Asia account for more than half of the world’s vulnerable employment, with three out of four workers in these regions in vulnerable employment. Likewise, progress in reducing working poverty has slowed. At the end of this decade, still one out of 14 workers is expected to live in extreme poverty conditions. Income inequalities have widened, delaying global economic and job recovery On average, in the countries for which data are available, the richest 10 per cent earn 30–40 per cent of total income. By contrast, the poorest 10 per cent earn around 2 per cent of total income. In several advanced economies, where inequalities historically have been much lower than in developing countries, income inequalities have worsened rapidly in the aftermath of the crisis and in some instances are approaching levels observed in some emerging economies. In emerging and developing economies, where overall inequalities have typically fallen, levels remain high and the pace of improvement has slowed considerably. Underpinning some of these developments is the decline in medium-skilled routine jobs in recent years. This has occurred in parallel to rising demand for jobs at both the lower and upper ends of the skills ladder. As a result, relatively educated workers that used to undertake these ­medium-skilled jobs are now increasingly forced to compete for lower-skilled occupations. These occupational changes have shaped employment patterns and have also contributed to the widening of income inequality recorded over the past two decades. Rising inequalities have also undermined trust in government, with a few exceptions. Confidence in government has been declining particularly rapidly in countries in the Middle East and North Africa region, but also in the advanced economies, East Asia and Latin America. Falls of such magnitude, in particular if they accompany stagnant or declining incomes, can contribute to social unrest. The report estimates that social unrest has gradually increased as joblessness persists. Social unrest tended to decline before the global crisis and has increased since then. Countries facing high or rapidly rising youth unemployment are especially vulnerable to social unrest. The employment and social outlook can be boosted This turbulent picture can be changed provided that the main underlying weaknesses are tackled. As highlighted in previous ILO analyses, aggregate demand and enterprise investment need to be bolstered, including through well-designed employment, incomes, enterprise and social policies. Credit systems should be reoriented to support the real economy, notably small enterprises. The weakness in the euro area needs to be addressed with conviction. And mounting inequalities must be addressed through carefully designed labour market and tax policy. There is also scope for addressing the persistent social vulnerabilities associated with a fragile job recovery, notably high youth unemployment, long-term unemployment and labour market exit, particularly among women. This means carrying out inclusive labour market reforms so as to support participation, promote job quality and update skills. ContentsContents
  • 11.
  • 12.
    151. Global employmentand social developments Introduction Six years after the start of the financial and economic crisis, the global economy has entered a phase of tepid economic growth (see figure 1.1). Global economic growth remains significantly below pre- crisis trends and is too slow to close output and employment gaps that opened due to the crisis. The slowdown in economic activity is especially pronounced in Central and South-Eastern Europe and the CIS, East Asia, South-East Asia and the Pacific, Latin America and the Caribbean and North Africa. Economic growth has accelerated somewhat in some advanced economies and in South Asia, Middle East and Sub-Saharan Africa – but not enough to offset the slowing of activity in other regions. These trends have intensified existing vulnerabilities, while complicating the task of bringing un- employment and underemployment even back to pre-crisis levels in most countries. According to IMF projections, global economic growth will accelerate slightly over the coming two years thanks in part to lower oil prices and improved financial conditions in some advanced economies. But even if these projections materialize, it is unlikely, based on current policies, that the existing employment and social gaps will be closed significantly. So far, the current stage of global recovery is supported by accelerating growth in a few Developed Economies, South Asia and Sub-Saharan Africa, but it remains fragile due to continued lack of aggregate demand as well as structural vulnerabilities related to geopolitical risks, disorderly adjustment of financial markets, continued stagnation in the euro area, mounting inequality and slowing labour force growth. This report assesses the employment and social impacts of the recent global slowdown and examines longer term socio-economic consequences associated with the prolonged period of economic turbulence that started in 2008. In this chapter, key labour market and social trends are reviewed and projections for the next five years presented. Regional developments show marked differences as regards to the impact of the crisis and their implications for sustained employment growth (Chapter 2). The recent slowdown is also compounding longer-term trends and vulnerabil- ities – such as population ageing and changing occupational patterns and skill needs. Chapter 3 takes a closer look at these interactions. Note: The figure shows global economic growth (solid line) as well as the contributions of different demand components to global economic growth. The decom- position is based on data from 120 countries. Effects from external balance result from less than full country coverage. Source: Economist Intelligence Unit (EIU), November 2014. –3.0 –1.5 0 1.5 3.0 4.5 Percent 2005 2006 2007 2008 2009 2010 2011 2012 2013 2014 Private consumption Government consumption Gross fixed investment External balance % change in real GDP 3.6 4.1 3.9 1.4 –2.1 4.1 2.8 2.2 2.3 2.5 1.1 Figure Global growth and its components (per cent per annum) global employment and social developments ContentsContents
  • 13.
    16 World Employmentand Social Outlook – Trends 2015 A. Labour market trends Over 61 million jobs are needed to close the crisis-related jobs gap… The global economy has failed to recover the output levels of pre-crisis trends and employment creation is still not sufficient to close the jobs gap that opened up with the crisis. Indeed, there were more than 61 million fewer jobs in 2014 than would have been expected had the crisis not struck (figure 1.2). This shortfall in jobs is also reflected in lower labour force participation rates, as many people have dropped out of the labour market, although the drop in participation rate has stabilized recently. Global employment grew at an average annual rate of 1.7 per cent between 1991 and 2007. However, since the outbreak of the crisis, employment growth has slowed to 1.2 per cent per annum between 2007 and 2014. On current trends, unemployment will continue to rise as the labour force expands. Going forward, job creation is expected to remain at this lower growth rate over the medium term, causing a widening of the global jobs gap to around 82 million jobs in 2019. If new labour market entrants are taken into account, 280 million jobs will need to be created over the coming five years to close the crisis-related global jobs gap and to absorb the increase in the labour force. … and the total number of jobseekers is 201 million today, over 1 million more than a year ago… Global unemployment stood at 201.3 million in 2014, with 1.2 million additional unemployed com- pared with the previous year and about 31 million more compared with 2007 (see figure 1.3, panel A; Box 1.1 discusses changes in unemployment projections with respect to those published in ILO, 2014a). In 2014, close to 5.9 per cent of the labour force was without a job, with wide variations across countries (see table 1.1). In particular countries in North Africa and Sub-Saharan Africa and the Middle East continue to suffer from high unemployment rates, in some cases up to 30 per cent of the labour force (see figure 1.3, panel B). Southern European countries have also not yet experi- enced significant declines in their unemployment rates, despite a modest pick-up in job creation observed in recent months. On the other hand, Asian countries – in particular in South-East Asia and the Pacific – experience relatively low unemployment rates, but often at the cost of high informal employment rates, which can in some countries reach nearly 85 per cent of total employment (see ILO, 2012). Among the developed economies, unemployment fell significantly in the United Kingdom and the United States with other countries in the European Union experiencing smaller decreases. In Latin America and the Caribbean, several countries are facing growing unemployment, as the slowing global economy has started to bring down previously high job-creation rates. Note: The figure shows the evolution of global employment and its current forecasts until 2019 (solid and orange line) in comparison with employment growth as expected prior to the crisis in 2008 (green dashed line). Source: ILO, Trends Econometric Models, October 2014. 2500 2750 3000 3250 3500 Globalemployment(millions) 2001 2002 2003 2004 2005 2006 2007 2008 2009 2010 2011 2012 2013 2014 2015 2016 2017 2018 2019 Pre-crisis trend Estimated/Forecast 61 million 80 million 1.2 Figure Global jobs gap, 2014–19 ContentsContents
  • 14.
    171. Global employmentand social developments Unemployment rates are expected to decline gradually in developed economies, particularly in the EU (see table 1.1). For example, countries in southern Europe that still suffer from very high unemployment rates are likely to see at least some improvements. In contrast, some emerging G20 countries are expected to experience a slight uptick as more and more workers move from rural areas (where typically very low unemployment rates prevail) to urban areas. In East Asia in particular, the unemployment rate is expected to creep up to about 5 per cent by 2017, half a percentage point higher than in 2013. At the global level, rates are expected to remain constant over the next two years, reflecting that most other emerging regions outside the G20 will ex- perience stable unemployment rates. There will be no relief among countries in the Middle East and North Africa, which continue to be affected by the highest unemployment rates worldwide. Sub-Saharan Africa – despite its relatively good growth performance and despite its recovery being less affected by the difficulties of the global economy – will not experience a significant decline in its unemployment rate. Note: Panel A presents global estimates and projections for unemployment for 2014–19. Global unemployment estimates are based on a sample of 178 countries. Panel B shows estimated unemployment rates (in per cent of the labour force) for individual countries for 2014 (no estimates available for countries shaded in white). Darker colours indicate higher unemployment rates. Source: ILO, Trends Econometric Models, October 2014. 198 202 206 210 214 Panel B. Cross-country variations in unemployment rates (percentages) Panel A. Global unemployment developments 0 3 4 5 6 7 8 10 12 17 28 Unemployment(thousands) 2014 2015 2016 2017 2018 2019 194 1.3 Figure Global unemployment, 2014–19 ContentsContents
  • 15.
    18 World Employmentand Social Outlook – Trends 2015 Changes to unemployment projections Unemployment projections and near-term estimates are subject to regular revisions and updates. These revisions and updates partly reflect the changing economic circum- stances, which can alter economic growth projections –in some cases to a significant extent.* The availability of new data and labour market information can also lead to major updates and revisions in the projections. Revisions and updates have also been released since the start of the global crisis, though not as many as could have been expected, given the turbulent economic situ- ation (figure 1.4). Large variations between projected and actual unemployment rates have been observed during 2009 and 2010 – on average, the forecasts were too opti- mistic. In developed economies, these forecast errors have been particularly large, with more than 75 per cent of un- employment rates – more than 1 percentage point – below realized values for both years. After 2010, the differences between projected and actual unemployment are signifi- cantly reduced. For example, for 2013 the forecasts were too pessimistic, but only by a small margin. *  See the Appendix for a technical discussion on forecasts and revisions to this year’s unemployment projections. 1.1 Box 0 –3.0 –1.5 1.5 3.0 4.5 Panel A. Globally ToooptimisticToopessimistic 2007 2008 2009 2010 2011 2012 2013 0 –3.0 –1.5 1.5 3.0 6.0 4.5 Panel B. Developed economies ToooptimisticToopessimistic 2007 2008 2009 2010 2011 2012 2013 1.4 Figure Differences between projected and observed unemployment, 2007–13 (percentage points) Note: The charts show surprises in unemployment projections for all 178 countries (panel A) and for developed economies only (panel B) between 2007 and 2013. Unemployment surprises are measured as the difference between actual and projected unemployment rates in percentage points. Positive values indicate too optimistic unemployment forecasts, negative values too pessimistic unemployment forecasts. The box-whisker representations indicate the range in which 75 per cent of the surprises fall as well as the 50 per cent of the surprises (within the box). Source: ILO, Trends Econometric Models, 2007–14. ContentsContents
  • 16.
    191. Global employmentand social developments … and depressing participation rates Labour force participation rates have been falling over recent decades but stabilized at the global level at about 63.5 per cent in 2013. Nevertheless, the labour force participation rate is still 0.7 per- centage points lower than in 2007, reflecting a loss of more than 37 million potential workers from the global labour force. Moreover, long-run trends point to further declines, with participation rates falling significantly below 63 per cent of the global working-age population by 2030 (see box 1.2). Such decreased labour force participation lowers the potential growth of affected economies (see Chapter 3). Falling participation rates are a reflection of both changing demographics and discouragement effects due to the persistence of the crisis. In Developed Economies and the EU, falling participation rates among young people are related to the continued weak prospects for young people to find jobs. Some of these trends are likely to reverse should faster growth be achieved in the medium term. On the other hand, in emerging economies, especially in South Asia, participation rates have been falling as a result of increasing education and reduced female participation rates due to income effects. These trends are likely to be longer lasting. Unemployment developments, 2007–17 (percentages) Country/region 2007 2013 2014 2015 2016 2017 World 5.5 6.0 5.9 5.9 5.9 5.9 G20 Economies 5.0 5.7 5.6 5.6 5.6 5.6 G20 Advanced Economies 5.7 8.4 7.7 7.4 7.2 7.0 G20 Emerging Economies 4.8 4.9 5.0 5.1 5.1 5.2 Developed Economies and the European Union             5.8 8.5 7.8 7.5 7.3 7.1 Australia 4.4 5.7 6.0 5.9 5.7 5.6 Canada 6.0 7.1 6.9 6.7 6.6 6.6 Japan 3.9 4.0 3.7 3.6 3.6 3.7 United States 4.7 7.4 6.2 5.9 5.5 5.2 European Union 7.2 10.9 10.2 9.9 9.7 9.5 France 8.0 10.4 9.9 10.0 10.0 9.9 Germany 8.6 5.3 5.0 4.7 4.9 5.0 Italy 6.1 12.2 12.5 12.6 12.5 12.3 United Kingdom 5.4 7.5 6.3 5.9 5.7 5.5 Central and South-Eastern Europe and CIS 8.2 7.8 7.7 7.8 7.8 7.8 Russian Federation 6.0 5.5 5.1 5.3 5.4 5.4 Turkey 10.3 9.7 9.2 9.2 8.9 9.0 Middle East 10.2 10.9 11.0 11.0 10.9 10.8 North Africa 11.4 12.4 12.5 12.5 12.5 12.5 Sub-Saharan Africa 7.8 7.7 7.7 7.7 7.7 7.7 South Africa 22.3 24.6 25.1 25.0 24.9 24.8 Latin America and the Caribbean 6.9 6.3 6.6 6.8 6.9 6.8 Brazil 8.1 6.5 6.8 7.1 7.3 7.3 Mexico 3.4 4.9 4.9 4.8 4.5 4.3 East Asia 3.8 4.5 4.6 4.8 4.9 4.9 Republic of Korea 3.2 3.1 3.5 3.5 3.5 3.5 South-East Asia and the Pacific 5.5 4.3 4.3 4.3 4.2 4.2 Indonesia 9.1 6.2 6.2 6.1 5.9 5.8 South Asia 4.0 3.9 3.9 3.9 4.0 4.0 Note: The table shows unemployment rate estimates and projections at the global and regional levels as well as for selected G20 countries. Source: ILO, Trends Econometric Models, October 2014. 1.1 Table ContentsContents
  • 17.
    20 World Employmentand Social Outlook – Trends 2015 Medium-term prospects for the global labour market Global participation rates The global labour force participation rate has stabilized somewhat after a sudden and significant fall following the onset of the crisis (figure 1.5). In some countries and regions the prolonged depression on the labour market has increased the number of discouraged workers and – in some cases – permanently reduced the labour force participation rate. In this regard, the current stabil- ization of the labour force participation rates suggests that this dynamic has slowed down at the global level. The increases in the participation rate are mainly linked to rising male participation, as men are currently making up some lost ground relative to pre-crisis levels. As a consequence, global labour force growth is expected to pick up slightly, to around 1.4 per cent in 2014, before resuming its downward trend. Although small, this accel- eration in labour force growth will put further pressure on global labour markets as employment growth is not expected to accelerate to the same extent. In particular, it will continue putting downward pressure on wages and incomes in an environment already characterized by sluggish labour income growth. Ageing populations The ageing of the population in many countries will cause the growth of the global labour force to decelerate, unless it is offset through immigration. Several larger advanced economies are already experiencing a fall in their labour force. This decline in population dynamics will have long lasting implications for global growth, as a reduction in any factor of production with normally slow growth if all else remains unchanged. In particular, slower population growth can affect economic activity through two main channels: lower investment growth and less job creation. Both factors lower growth directly but will also weigh on productivity growth (see also discussion below). On the upside, reduced pressure on labour markets due to slower growth in the labour force might help reverse the trends of a falling wage share. So far, there have been no signs of wage inflation, but individual countries might experience labour shortages soon as population ageing accelerates (see The Conference Board, 2014). These can be welcome trends to the extent that they might help to slow or reverse increases in inequality observed over recent decades, which, in turn, can help support growth accelerations, as indicated by the analysis in Chapter 3. 1.2 Box Note: The figure shows the evolution of the global labour force participation rate and its current forecasts until 2030 (orange line) in comparison with employment growth as expected prior to the crisis in 2008 (green line). Working-age population comprises people aged 15 years and above. Source: ILO, Trends Econometric Models, October 2014. 65 62 63 67 Labourforceparticipationrate (inpercentofworking-agepopulation) 1990 1994 1998 2002 2006 2010 2014p 2018p 2022p 2026p 2030p Pre-crisis trend Global labour force participation rate 1.5 Figure Global labour force participation rate: Projections vs trend, 1990–2030 ContentsContents
  • 18.
    211. Global employmentand social developments Youth unemployment remains a concern globally… Young people (aged 15–24) continue to be disproportionately hit by the crisis. The youth un- employment rate reached 13.0 per cent in 2014, which is almost three times higher than the unemployment rate for adults. Although new youth cohorts entering the labour market are smaller than their previous counterparts – especially in certain regions, such as East Asia and Latin America – it remains difficult for young people to find jobs in most countries. These trends persist despite considerable improvements in average educational attainment of youth cohorts. The share of youth in the labour force with tertiary education has increased since 2007 in 26 out of 30 countries for which data are available. Nonetheless, unemployment rates among young workers with tertiary education have also risen since the onset of the crisis in 16 out of 18 countries (ILO, 2013a). Many countries are projected to see a substantial increase in youth unemployment, in particular those in which youth unemployment rates are currently below the global average. The global youth unemployment rate is expected to increase to 13.1 per cent in 2015 and then remain unchanged through 2018. The largest increases in 2015 will be observed in East Asia and the Middle East, with an expected further increase over the following years (see figure 1.6). In contrast, older persons have fared relatively well during the crisis and their employment rates have remained stable, even in those countries that have been hit hard. Unlike previous downturns, when older workers often were pushed into early retirement, enterprises this time around decided to hold on to their most experienced workers. However, there is evidence that for those older workers who did lose their jobs, it is increasingly difficult to obtain new employment (Mayer, 2014). … while gender gaps in the labour market persist The beginning of the crisis saw a moderate closing of the gender unemployment gap, mainly because job losses were concentrated in male-dominated industries. However, the subsequent recovery in employment also mostly occurred in sectors where predominantly men are employed (e.g. construc- tion), reopening the gender gap. Overall, women continue to suffer from higher rates of unemployment and lower rates of employment, are less likely to participate in the labour force and face higher risks of vulnerable employment, i.e. being self-employed or a contributing family worker (see figure 1.7). In addition to the discrimination suffered by women, these gender gaps also represent a substantial loss in income and economic development. For those countries and regions with the largest gaps, income losses of up to 30 per cent of GDP per capita are incurred in comparison to a situation where gender gaps in employment and participation would be lowered to the world average (ILO, 2014a). Note: The chart shows the projected change in the youth unemployment rates between 2014 and 2019 (in percentage points) for individual countries (no estimates available for countries shaded in white). Darker colours indicate worsening of youth unemployment rates. Source: ILO, Trends Econometric Models, October 2014. −17 −3 −1 −0.5 −0.2 0 0.5 1 2 8 1.6 Figure Change in youth unemployment, 2019 vs 2014 (percentage points) ContentsContents
  • 19.
    22 World Employmentand Social Outlook – Trends 2015 Note: The charts show differences in unemployment, employment, labour force participation and vulnerable employment rates between men and women in the world and by region for 2014 and 2019. Source: ILO, Trends Econometric Models, October 2014. 2 4 6 8 10 12 –2 14 Percentagepoints Middle East North Africa Latin America and the Caribbean Sub-Saharan Africa South Asia WORLD South-East Asia and the Pacific Developed Economies and European Union East AsiaCentral and South-Eastern Europe (non-EU) and CIS Panel A. Unemployment gap –45 –30 –15 –60 Percentagepoints Panel B. Employment gap Percentagepoints Sub-Saharan Africa Developed Economies and European Union East Asia Central and South-Eastern Europe (non-EU) and CIS South-East Asia and the Pacific Latin America and the Caribbean WORLD South Asia Middle EastNorth Africa Panel C. Labour force participation gap 4 8 12 16 20 –4 24 Percentagepoints North Africa South-East Asia and the Pacific Sub-Saharan Africa South Asia Middle East East Asia WORLD Latin America and the Caribbean Developed Economies and European Union Central and South-Eastern Europe (non-EU) and CIS Panel D. Vulnerable employment gap Sub-Saharan Africa East Asia Developed Economies and European Union Central and South-Eastern Europe (non-EU) and CIS South-East Asia and the Pacific WORLD Latin America and the Caribbean North Africa Middle EastSouth Asia –45 –30 –15 –60 0 0 0 0 2014 2019 2014 2019 2014 2019 2014 2019 1.7 Figure Gender gaps in the labour market, 2014 vs 2019 ContentsContents
  • 20.
    231. Global employmentand social developments Job creation in the coming years will be mainly in the service sector… The bulk of new jobs are being created in private sector services, which will employ more than a third of the global workforce over the next five years (see figure 1.8). Public services in health care, education and administration will also see smaller increases, still reaching more than 12 per cent of total employment. In contrast, industrial employment is expected to stabilize globally at slightly below 22 per cent of total employment, mainly driven by a continuous rise in employment in construction whereas manufacturing industries continue to lose jobs. The advanced economies still account for the largest share of manufacturing jobs across the globe, but current trends will bring their employment share to below 12 per cent by the end of 2019. Some emerging coun- tries have also seen a fall in their share of manufacturing employment, despite the fact that their manufacturing industries have not yet reached levels similar to those in advanced economies. In general, industrial employment is not likely to contribute strongly to employment recovery, despite its important role in structural transformation particularly in the emerging economies. Rather, ser- vice sector employment will remain the most dynamic area of job creation over the next five years. … with growing incidence of high-skilled occupations Low-skilled occupations and non-routine manual jobs still make up more than 45 per cent of total employment worldwide (see figure 1.9, panel A), with medium-skill routine jobs accounting for a share of around 37 per cent.1 At the same time, high-skilled non-routine cognitive jobs have been increasing steadily, making up more than 18 per cent of total employment. These trends are set to continue, although with significant regional variations (see figure 1.9, panel B). Medium-skill jobs are declining in advanced economies, partly replaced by low-skilled occupations, while they remain stable as a share of the global economy. The share of high-skilled occupations varies widely, ranging from less than 10 per cent in Sub-Saharan Africa to almost 40 per cent in devel- oped economies. The decline of medium-skilled jobs in advanced economies may be one factor contributing to rising inequality in developed economies, the so called “­hollowing-out” of middle income jobs. Chapter 3 discusses in more detail the consequences of these shifts in occupational and sectoral employment patterns. 1   The distinction of occupations into non-routine manual, non-routine cognitive and routine occupations follows the classification introduced by Autor et al. (2003) and Jaimovich and Siu (2012) to designate occupations that are easily substituted by capital through the process of computerization and robotization. Note: p: projection. The figure shows annual employment growth for selected sectors in 2013 and projected annual employment growth for 2019. Source: ILO, Trends Econometric Models, October 2014. 1 2 3 –1 4 Percent Agriculture, forestry, hunting and fishing Manufacturing Construction Real estate, business and administrative activities Public administration and defence; compulsory social security Health and social work activities Education 2014–2019p2010–2013 0 1.8 Figure Sectoral employment growth, selected sectors (percentages) ContentsContents
  • 21.
    24 World Employmentand Social Outlook – Trends 2015 Note: p: projections. Panel A shows trends since 2000 of occupational employment shares at the global level, as well as projections until 2019. Panel B shows the change (in percentage points) in the occupational employment share by type of occupation over the period 2000–13 at the global level and by region (in percentage points) Source: ILO, Trends Econometric Models, October 2014. 28 36 44 12 20 52 Percentoftotalemployment Panel A –3 3 –9 –6 6 Changesinemploymentshares (percentagepoints) Panel B WORLD Developed Economies and European Union Central and South-Eastern Europe (non-EU) East Asia South-East Asia and the Pacific South Asia Latin America and the Caribbean Middle East North Africa Sub- Saharan Africa 2000 2001 2002 2003 2004 2005 2006 2007 2008 2009 2010 2011 2012 2013 2014p 2015p 2016p 2017p 2018p 2019p Non-routine cognitive occupations Non-routine cognitive occupations Routine occupations Routine occupations Non-routine manual occupations Non-routine manual occupations 0 1.9 Figure Development of employment by occupation Wage growth has remained subdued… Global wage growth has not recovered to pre-crisis rates and has slowed in the past year. In the current environment, employment creation has not added pressure on employers to raise wages in most countries. In a few countries, wages have declined rapidly (e.g. Greece, Spain and the United Kingdom). Wage growth continued a longer-term trend of trailing behind productivity increases in most advanced economies, except during 2009, allowing companies to recover losses in profit- ability through lower wage increases. The combination of slow employment and wage growth has contributed to a long-term decline in the labour income share in most countries (see ILO, 2014b). This limits households’ disposable income and thus subtracts from private aggregate demand, reinforcing the current cycle of slow economic growth in many countries and potentially contributing to deflationary pressures, notably in Europe and Japan. ContentsContents
  • 22.
    251. Global employmentand social developments … and productivity growth has also slowed in many countries while investment rates have fallen A trend observed over the past few decades is that the rate of output and productivity growth has been decelerating, both in advanced economies and, more recently, in developing countries (see figure 1.10, panel A). One of the factors that may have contributed to this slowdown recently is slower labour market turnover, a reduction in the reallocation of jobs across firms and industries.2 The significant fall in job creation rates during the crisis and the still incomplete recovery might have affected productivity growth, in particular when comparing to the pre-crisis period (see figure 1.10, panel B). The higher elasticity of productivity growth with respect to labour market turnover after the crisis indicates that the large fall in labour market turnover observed since 2009 can be associated with a negative effect on productivity growth. In the past, job reallocation has been shown to play an important role in the restructuring of the economy after a shock, helping to move resources to more efficient uses (Davis and Haltiwanger, 2014). To the extent that job creation has not recovered, less restructuring toward more productive employment is a consequence. In addition, the large shock created by the crisis might have reduced the share of profitable (“efficient”) matches, leading to excess (“inefficient”) restructuring because of the size of the crisis.3 On the other hand, as indicated above, current technological shifts are leading to a stronger expansion of high-skilled occupations, which typically stems from lower labour market turnover. In this respect, the observed fall in labour market turnover might indicate that restructuring is on its way, but that it has not yet fully played out in the productivity numbers as the impact of a larger skilled labour force is yet to materialize. Hence, for the time being the adverse effects of slower labour market turnover dominate. Furthermore, productivity growth has suffered significantly from the drop in investment that occurred since the onset of the crisis, despite the recovery of profitability. Real investment growth and job creation rates are tightly linked, as both expanding capacity and replacing existing machines 2   Labour market turnover is measured as the sum of job creation and job destruction relative to the total labour force. 3  See Teulings and Hartog (1998) for a theoretical presentation of that argument. Wage and productivity growth (107 countries; annual average in per cent), selected periods 2000–08 2008–09 2009–13 Wage growth 2.3 1.9 2.0 Productivity growth 2.5 –0.6 2.6 Note: For a detailed list of countries covered by the aggregate figures and sources of differences in the estimates in comparison with earlier publications (ILO, 2014b), please refer to Annex 4. Source: ILO, Global Wage database; ILO Research Department, own calculations. 1.2 Table Note: Panel A shows long-term economic growth averages for developing and developed economies between 1950 and 2014. Panel B shows the coefficient estimates of the effect of labour market turnover on labour productivity growth in a panel estimation for 21 OECD countries between 1955 and 2014. Labour market turnover is defined as the sum of unemployment outflows and inflows over the total labour force. Labour market turnover contributes significantly to productivity growth in the years after the crisis but only very little during the pre-crisis years. Source: ILO, KILM; OECD, Economic Outlook Database; Penn World Tables, 2014; own calculations. 2 3 4 5 6 0 7 Percent 1 2 3 4 5 6 –1 7 0 1 1950–60 1960–70 1970–80 1980–90 1990–2000 2000–10 2010–14 Developed economies Developing economies Total period After 2009 Before 2009 Panel A. Economic growth per capita (long-term averages, 1950–2014) Panel B. Labour market turnover and its impact on productivity growth (1955–2014) 1.10 Figure Growth and the productivity impact of lower labour market turnover ContentsContents
  • 23.
    26 World Employmentand Social Outlook – Trends 2015 with new ones open possibilities for new jobs. In addition to faltering aggregate demand and uncer- tainty over future sources of demand growth, a recovery in private investment has also been held back by limited availability of credit (particularly for small and medium enterprises, especially in Europe), and increased uncertainty over cost of inputs (such as oil), the magnitude and direction of price and exchange rate changes and other conditions which limit the capacity of employers to identify new profitable areas of expansion of their output and workforce. The current slowdown in investment is also likely to have longer-lasting adverse effects on both productivity and employment. Future unemployment is also likely to be affected by the turbulence of the crisis and slow recovery Changes in future unemployment rates are affected by previous episodes of growth accelera- tions and slowdowns, although the link is weaker in developing countries compared to developed countries (see figure 1.11).4 In the former, growth is often sensitive to movements in commodity prices that do not translate fully into changes in labour market performance. Economic growth slowdowns have a larger impact on unemployment than growth accelerations. In other words, growth slowdowns tend to be very harmful for unemployment, whereas growth accelerations reduce unemployment to a more limited extent. The medium-term consequences of recent labour market trends for economic growth are discussed in more detail in Chapter 3. 4   This confirms findings on the Okun’s coefficient in recent literature (Ball et al., 2013). Note: The chart shows the changes in the total (youth) unemployment rate over the seven years that follow a growth slowdown (panel A) or acceleration (panel B) year. The size of the columns is based on a simple OLS panel regression that estimates the equation D7_UR = β0 + β1slw + β2acc, where slw and acc are dummy variables that respectively mark growth slowdown and acceleration years. D7_UR is the change in the total (youth) unemployment rate over the seven years that follow that year. The size of the estimated coefficient b1 (b2) is shown in panel A (B). Source: ILO; own calculations. 4 6 2 8 Percentagepoints Panel A. Growth slowdowns –4 –2 –8 –6 Percentagepoints Panel B. Growth accelerations World Developed countries Change in total unemployment rate Developing countries World Developed countries Developing countries Change in youth unemployment rate Change in total unemployment rate Change in youth unemployment rate 0 0 World Developed countries Developing countries World Developed countries Developing countries 1.11 Figure The impact of growth accelerations and slowdowns on changes in unemployment ContentsContents
  • 24.
    271. Global employmentand social developments B. Social developments and trends Vulnerable employment is falling slightly… Vulnerable employment – the share of own-account work and contributing family employment, categories of work typically subject to high levels of precariousness – has continued a modest decline in most regions, with more significant progress in Asian regions and the Middle East (see figure 1.12). Nevertheless, almost half of the world’s employed population are still working in vulnerable conditions, pre-dominantly women, and are thus prevented from accessing basic necessities and decent work. South Asia and Sub-Saharan Africa account for most of the vulner- able employment globally – for both, it stood at over 75 per cent in 2013 (projected to decline only slightly by 2019). East Asia is the region that is likely to continue to make the most progress in reducing vulnerable employment, from 49.5 per cent in 2007 to 38.1 per cent in 2019. Source: ILO, Trends Econometric Models, October 2014. 60 0 30 90 WORLDDeveloped Economies and European Union Central and South- Eastern Europe (non-EU) and CIS East Asia South-East Asia and the Pacific South AsiaLatin America and the Caribbean Middle East North Africa Sub-Saharan Africa J J J J J J J J J J2007 2013 2019p K K K K K K K K K K Percent 1.12 Figure Vulnerable employment as a share of total employment in developing economies, 2007–19 (percentages) … while the middle class continues to grow in developing countries and regions… This reduction in vulnerable employment has been one important factor in lifting more workers and households out of poverty and into middle-class status (see figure 1.13). In emerging and developing countries, the middle class now makes up more than 34 per cent of total employment. Another 12 per cent of all employees have reached an upper-middle income status in these coun- tries, benefiting from similar consumption baskets as middle-class workers in advanced economies. Despite the moderation in global growth, this reduction in working poverty is expected to continue over the medium term, although at slower rates, further boosting the size of the global middle class. Despite the rising number of employees in the middle class or the upper-middle class in developing countries, their share still remains too limited to significantly boost global aggregate demand and demand for many of the tradable goods produced in advanced economies. ContentsContents
  • 25.
    28 World Employmentand Social Outlook – Trends 2015 Note: For panel A, index: 2000=100. Data were restricted to G7 countries as the only country group for which continuous before and after-tax Gini coefficients were available. For panel B, unweighted averages across countries for 2011 or latest available year were used for the regional averages. Source: ILO Research Department calculations based on the OECD and World Bank Poverty Database. 103 105 101 107 Panel A. Evolution of the average Gini coefficient in G7 economies, 2000–11 20 30 10 Panel B. Income share distribution: Richest 10 per cent vs poorest 10 per cent by region, 2011 or latest available year 40 99 Central and South-Eastern Europe and CIS Middle East and North Africa East Asia, South East Asia and the Pacific South AsiaDeveloped Economies Latin America and the Caribbean 2000 2001 2002 2003 2004 2005 2006 2007 2008 2009 2010 2011 Gini (before taxes and transfers) Gini (disposable income) K K KK KK K Income share held by highest 10 per cent Income share held by lowest 10 per cent Sub-Saharan Africa 0 1.14 Figure Income inequality in advanced and developing economies and regions Note: The chart shows employment shares by economic class for developing countries, including forecasts up to 2019. Economic classes are defined by per capita per day consumption levels in US$ 2005 PPP. A consumption level above US$13 per capita per day is equivalent to advanced economies’ middle-class status. Source: Kapsos and Bourmpoula, 2013; ILO, Trends Econometric Models, October 2014. 50 75 0 25 100 1991 1993 1995 1997 1999 2001 2003 2005 2007 2009 2011 2013 2015p 2017p 2019p Extremely poor (less than US$1.25, PPP) Moderately poor (between US$1.25 and US$2, PPP) Near poor (between US$2 and US$4, PPP) Developing middle class (between US$4 and US$13, PPP) Developed middle class and above (above US$13, PPP) 1.13 Figure Employment by economic class in developing countries, 1991–2019 ContentsContents
  • 26.
    291. Global employmentand social developments … but income inequality is on the rise… Despite reductions in working poverty and vulnerable employment in the developing world, income inequality continued to deepen in most developed and developing countries. In several advanced economies, where inequalities historically have been much lower than in developing countries, income inequalities have worsened rapidly in the aftermath of the crisis (see figure 1.14, panel A). Indeed, several advanced economies are seeing income inequality levels approaching those observed in many emerging economies, whereas some of the latter have made progress in reducing their high levels of inequalities. Along with the fall in the labour income share described above, personal income inequality has also worsened further. Importantly, both market income inequality and disposable income inequality (after taxes and transfers) have increased over the past decade. As market income inequality increases, the burden placed on tax and transfer systems becomes larger. Even advanced economies with relatively ambitious tax and transfer policies have failed in some cases to limit the rise in income inequalities. In the advanced economies almost 25 per cent of total income went to the richest 10 per cent in society in 2011 (see figure 1.14, panel B). As larger shares of labour income went to top earners, investment and job creation did not increase, as the incomes of the middle and lower deciles stag- nated or declined in most countries and aggregate demand suffered. As Chapter 3 demonstrates, this rise in income inequality can be linked to long-term stagnation in growth rates in advanced economies and a lower incidence of growth spurts among developing countries, reducing the potential for catch-up. … undermining trust in government and fuelling the risk of social unrest Rising inequalities have undermined trust in government, with a few exceptions (see figure 1.15). Confidence in government has been declining particularly rapidly in countries in the Middle East and North Africa region, but also in the advanced economies, East Asia and Latin America. Falls of such magnitude, in particular if they accompany stagnant or declining incomes, can contribute to social unrest, as several countries in the Middle East have demonstrated, with knock-on effects on social conditions, growth and employment dynamics. Social unrest at the global level declined during the 1990s and 2000s – in line with the global unemployment rate – up to the crisis in 2009, when it shot up and is now almost 10 per cent higher than before the crisis (see figure 1.16). The situation is most pronounced in the Middle East and North Africa, but has also been increasing in non-EU Central and Eastern Europe and CIS countries, and to a lesser degree in South Asia. Note: The question that was asked to the survey respondents: “In this country, do you have confidence in your national government?” The chart shows the percentage of respondents that said they do have confidence in their national government. Source: ILO calculations based on Gallup World Poll data, 2014. –4.5 4.5 –9.0 9.0 Central and South-Eastern Europe and CIS Middle East and North Africa East Asia, South East Asia and the Pacific South Asia Developed Economies Latin America and the Caribbean Sub-Saharan Africa –13.5 Percent 0 1.15 Figure Confidence in government, 2012 vs 2013 (percentages) ContentsContents
  • 27.
    30 World Employmentand Social Outlook – Trends 2015 Notes: Panel A: The chart shows the level of social unrest at the global and regional level; higher values of the demeaned level of social unrest divided by its standard deviation are marked in red, lower values in green. Social unrest is calculated as the number of protests as a percentage of the total number of events. Global (WORLD) and regional aggregates for DEV = Developed Economies and European Union; CEES = Central and Eastern Europe (non-EU) and CIS; EA = East Asia; SEAP = South-East Asia and the Pacific; SA = South Asia; LAC = Latin America and the Caribbean; MENA = Middle East and North Africa; SSA = Sub-Saharan Africa. Panel B: The chart shows the level of social unrest across the world depending on the level of male youth unemployment. Low, medium and high levels of male youth unemployment are being identified by terciles of male youth unemployment across countries over the period 1991 to 2013. Source: BBVA, 2014; GDELT Event database (http://gdeltproject.org/); ILO, Trends Econometric Models, October 2014; own calculations. 0.8 0.4 1.2 0 Socialunrest Low Medium High Panel B. Male youth unemployment and unrest, 1991–2013Panel A. Social unrest across the world CEES SSA DEV EA LAC MENA SA SEAP WORLD 1979 1984 1989 1994 1999 2004 2009 2014 Average level of youth unemployment −2 0 2 4 1.16 Figure Social unrest and youth unemployment Social unrest is particularly acute in countries and regions were male youth unemployment is high or rising rapidly whereas no such relationship exists when looking at female youth unemployment (see figure 1.16, panel B). Young people are often the most demonstrative about their economic and social situation and problems such as inequality, low wages and high joblessness. Indeed, social unrest is particularly high in those countries where youth unemployment is widespread or has been increasing quickly. These tendencies are compounded in countries where edu- cated young people cannot find satisfactory employment opportunities – as is the case in many Middle Eastern and North African countries. Similar developments have been observed recently in European countries where youth unemployment shot up to very high levels with the onset of the crisis. Given the current global economic and social trends, these developments are unlikely to reverse quickly as governments find it difficult to mobilize economic resources to address the sources of social discontent. ContentsContents
  • 28.
    311. Global employmentand social developments Projection differences, 2013 vs 2014   2008 2009 2010 2011 2012 2013 2014 2015 2016 2017 2018 2019 Unemployment (millions) Oct. 2013 177.0 197.9 195.2 193.9 196.9 201.8 206.0 208.8 211.0 213.1 215.2 Oct. 2014 178.6 199.0 196.6 195.4 197.4 200.1 201.3 204.4 206.7 208.8 210.8 212.3 Unemployment rate (per cent) Oct. 2013 5.6 6.2 6.1 6.0 6.0 6.0 6.1 6.1 6.1 6.1 6.0   Oct. 2014 5.7 6.3 6.1 6.0 6.0 6.0 5.9 5.9 5.9 5.9 5.9 5.9 Source: ILO Trends Econometric Models, October 2014 and October 2013; ILO Research Department calculations. 1.3 Table Appendix Changes to the estimates and projections, 2013 vs 2014 As in previous years, global and regional unemployment levels and rates have been revised to take into account new information as well as revisions in economic growth projections. Unemployment rate input data: Revisions in the historical unemployment data come either from revisions made by their original sources or from the fact that sometimes data from national labour force surveys are available with a substantial lag (oftentimes the lag can be up to one or two years, or even more in some rare cases). Overall, there were 120 new observations in Trends Econometric Models (TEM) October 2014 as compared with the TEM October 2013; 24 of these new data refer to the period 2009–12, 38 refer to 2013 and 58 refer to 2014. For example, there were four more observations for Guinea (i.e. 2009–12), three more observations for Kyrgyzstan (i.e. 2011–13) and two more observations for Suriname (i.e. 2009–10). The year 2013 in the TEM October 2013 was a preliminary estimate for 61 countries for which some quarters were available. In the most recent model run (TEM October 2014), all quarters are available for 2013. Moreover, the estimates for nine countries (i.e. Algeria, Bahamas, Belize, Guadeloupe, Libya, Martinique, Namibia, Saudi Arabia and West Bank and Gaza Strip) were revised upwards by more than 1 percentage point as new data became available or in two cases (i.e. Saudi Arabia and West Bank and Gaza Strip) old data were revised. GDP growth rates: Between the IMF World Economic Outlook (WEO) October 2013 and the WEO October 2014 updates, the estimate for global GDP growth rate in 2013 was revised upwards by 0.4 percentage points and for 2014 and 2015 it was revised downwards by 0.3 and 0.1 percentage points, respectively. For all the years after 2015, the global GDP growth rate forecast was not revised. These changes in the revisions of GDP lead to revisions in the estimated relationship between unemployment rate and the GDP growth rates. However, based on the magnitude of the above revisions the revisions of the updated projections of the unemployment rate are small. In total, the baseline projection of the global unemployment rate was revised downwards by 0.2 per- centage points for the period 2014–18 (see table 1.3). Some 23 and 13 per cent of the revision in the global unemployment rate in 2012 and 2013, respectively, is caused by GDP growth rate revisions and 77 per cent and 87 per cent of the revision is caused by the changes in the un- employment input data. For 2014, the revision in the global unemployment rate was solely due to data revision. ContentsContents
  • 29.
  • 30.
    332. Regional developments:An uneven and uncertain recovery Developed Economies and European Union Revived economic growth in some developed economies is being offset by another slowdown in Europe and Japan Growth is expected to strengthen in several developed countries, namely Australia, Canada, New Zealand and the United States. In the United States, on the heels of robust third-quarter growth in 2014, the International Monetary Fund (IMF) projects growth to reach over 3 per cent in 2015, the highest value since 2006. This reflects the considerable improvement in economic fundamentals during 2014, as energy prices fell, household debt contracted, the housing market improved and firms began to invest again. Spillover effects from the recovery in the United States are benefiting Canada’s exports and invest- ments; as a result, its economy is expected to expand by 2.4 per cent in 2015.1 Positive exports and a stronger construction sector are also boosting GDP growth in New Zealand, which, at 3.6 per cent in 2014, remains the fastest-growing economy among developed countries. In contrast, Australian output is increasingly driven by internal demand, offsetting the decline in the extractives sector, which has been affected by falling commodity prices; it is projected to increase by nearly 3 per cent in 2015. In comparison, the European Union as a whole is growing only at a moderate pace (1.3 per cent in the second quarter of 2014 among the EU-28), and is largely being driven by above-average output growth in some eastern and northern EU countries outside the euro area.2 In the euro area, the recovery remains fragile at best. The modest economic growth seen during the second half of 2013 and early 2014 is fading, with large euro-area countries driving the slowdown: in the second quarter of 2014, output growth reached 1.3 per cent in Germany (down from 2.2 per cent in Q1 2014) and 0.1 per cent in France (down from 1 per cent in Q1 2014). Difficulties in the euro area have been exacerbated by fiscal consolidation policies, which have suppressed internal demand without, in most cases, counterbalancing increases in exports. So far, wage moderation strategies, which have been at the core of policy-making in many euro-area countries in the aftermath of the crisis, have had very limited effect in boosting competitiveness and jobs (see box 2.1). Growth in Japan is expected to have reached 0.9 per cent in 2014, down from 1.5 per cent in 2013. Stronger internal demand, including from government efforts to induce above-inflation wage increases, and improved industrial confidence should help to offset the slowdown in exports, as well as the negative impact of fiscal consolidation plans for 2015. However, public debt reduction remains a priority in the medium and long term, while expansionary monetary policy should con- tinue until inflation reaches the established target of 2 per cent. 1   This outlook is likely to be negatively affected by the fall in oil prices that took place in 2014. 2   Annual GDP growth in the second quarter of 2014 was over 3 per cent in the Czech Republic, Hungary, Lithuania, Poland and the United Kingdom. regional developments: an uneven and uncertain recovery ContentsContents
  • 31.
    34 World Employmentand Social Outlook – Trends 2015 Joblessness is falling in developed economies, but this is not yielding wage gains Throughout 2014 unemployment rates continued their downward trend in most of the developed countries, with the exception of Australia. Despite the fall in joblessness, however, wage growth remained weak and wage increases continue to lag behind productivity growth (table 2.1). The modest expected improvements in wage growth in the coming years will only gradually help to close the current gap between wage growth and productivity growth (ILO, 2014b). Besides the muted recovery in employment, the sluggish wage growth stems from a reduction in the bargaining power of workers to negotiate stronger wage increases (see also box 2.1). Indeed, when comparing wage curve estimates before and after the crisis, wage growth appears to react less strongly to changes in the unemployment rate after 2009 (figure 2.1). This reflects not only the relatively weaker bargaining position but also other factors triggered by the prolonged slump in employment, including the fact many jobseekers have accepted temporary or part-time positions, often at lower wages. Competitiveness and wages in Europe An early policy response to the crisis in Europe, par- ticularly in the hard-hit southern European countries which often turned to European and international insti- tutions for support, was to reduce employment protec- tion legislation, weaken or decentralize wage bargaining and reduce minimum wages as a way to increase competitiveness. For instance, in Spain, real wages have contracted in almost all sectors since 2011; positive wage growth has been registered only in the extractive and electricity industries and marginally in the arts and entertainment sector. Wage contraction in Spain has been particularly marked in the public sector: between 2011 and 2013, real wages decreased by 4.2 per cent in health care, 2.7 per cent in education and 2.3 per cent in public administration. Moreover, a number of key economic sectors – including wholesale and retail trade, pro- fessional and scientific activities, and transport and storage – regis­tered average real wage reductions of around 1.5 per cent. Wage contraction has been even more pervasive in Greece, where nominal wages for the entire economy fell, on average, by 5.6 per cent in 2011, 6.9 per cent in 2012 and 8 per cent in 2013. Wage contraction has helped reduce some of the cost competitive differentials within the euro area – as exemplified by converging trends in unit labour cost. However, this has not always translated into improved external competitiveness (trade) and internal reallocation towards more productive sectors. Instead, in some coun- tries, exports have not yet picked up and are still con- centrated in low-value-added sectors (Greece); while in others where exports have recovered (Spain), the growth of firms is currently challenged by weak internal demand, tight credit conditions and strict product market regu- lation. Indeed, evidence suggests that competitiveness imbalances in the euro area are not simply related to cost competitiveness gaps, but are connected with structural weaknesses of the macroeconomic environment. This includes ineffective economic governance, a weak busi- ness environment, scarce investment in research and development, underdeveloped public infrastructures and low skills levels among the working-age population. Source: ILO (2014c, 2014d); EC and ILO (2014). 2.1 Box Economic and social developments in Developed Economies and EU, 2009–19 (percentages) 2009 2012 2013 2014 2015 2016 2017 2018 2019 Labour force participation rate 60.4 60.0 59.9 59.8 59.8 59.7 59.7 59.6 59.5 Unemployment rate (total) 8.4 8.6 8.5 7.8 7.5 7.3 7.1 6.9 6.8 Youth unemployment rate 17.4 18.0 17.7 16.7 16.3 15.8 15.5 15.2 15.0 Employment growth –2.2 0.5 0.4 1.2 0.6 0.5 0.5 0.4 0.4 Youth employment growth –7.5 –1.1 –0.2 0.9 0.1 0.1 0.0 –0.1 –0.1 Real wage growth 1.0 0.2 0.2 0.5 1.4 1.5 1.8 1.8 1.7 Productivity growth –1.5 0.8 0.8 0.6 1.6 1.8 1.8 1.7 1.7 Note: Regional wage and productivity growth includes estimates and projections for 29 out of 36 countries. For a detailed list of countries covered by the aggregate figures and sources of differences in the estimates in comparison with earlier publications (ILO, 2014b), please refer to Annex 4. Source: ILO, Trends Econometric Models, October 2014; ILO, Global Wage database, December 2014; ILO Research Department. 2.1 Table ContentsContents
  • 32.
    352. Regional developments:An uneven and uncertain recovery Unemployment, especially among youth, remains a challenge in Europe Reflecting the weak economic conditions in Europe, unemployment rates fell gradually throughout 2014. However, young Europeans continued to be confronted with exceptionally high unemployment rates. In the EU-28, adults faced an unemployment rate of 9 per cent in the second quarter of 2014, whereas young people faced a jobless rate of 22 per cent (see figure 2.2). This translates into a ratio of youth-to-adult unemployment rates close to 2.5 for EU-28. The ratio was close to 4 or even higher in a number of countries, notably the United Kingdom (3.5), Italy (3.9) and Romania (4.4). Conversely, some countries recorded a youth-to-adult unemployment rates ratio slightly lower than 2, such as Austria, Germany and the Netherlands. At the same time, adult unemployment rates also showed large inter-country differences. For instance, in the second quarter of 2014, adult unemployment rates were lower than 5 per cent in Austria, the United Kingdom and Germany, compared with around 25 per cent in Greece and Spain. In the same period, differences in youth unemployment rates were even larger, ranging from around 8 per cent in Austria and Germany to over 40 per cent in Italy and 52 per cent in Greece and Spain. Note: The chart shows the time-varying coefficient, μt, of the elasticity of real wage growth with respect to changes in unemployment between 1994 and 2019, including forecast changes beyond 2014, for the Developed Economies and EU region. The shaded areas represent the confidence interval. Estimates have been established using P-splines with the estimation equation: wt = w i =1 4 wt i + u + µt( ) i = 0 4 ut i + t where wt: (regional) real wage growth, Δut: change in the (regional) unemployment rate and βw , βu : the (constant) elasticities of real wage growth with respect to past wage growth and changes in unemployment. Source: ILO, Global Wage Database and Trends Econometric Models, October 2014. 2 0 4 –2 20001996 2005 2010 2015 2019 Coefficientestimate 2.1 Figure Reaction of wages to changes in unemployment, 1994–2019 Note: The diagonal line represents a youth to adult unemployment ratio of 2:1. Source: ILO Research Department based on Eurostat. 25 45 15 55 5 Age15–24 Age 25+ 35 0 7 2114 28 J J J J J J J J JJ J JJ J JJ J J J J J J J J J J J J J European Union (28 countries) Belgium Bulgaria Czech Republic Denmark Germany Estonia Ireland Greece Spain France Croatia Italy Cyprus Latvia Lithuania Luxembourg Hungary Malta Netherlands Austria Poland Portugal Romania Slovenia Slovakia FinlandSweden United Kingdom 2.2 Figure Unemployment rates by age in the EU-28, Q2 2014 (percentages) ContentsContents
  • 33.
    36 World Employmentand Social Outlook – Trends 2015 By sex, the EU-28 exhibited a slightly higher unemployment rate for female youth at 10.4 per cent, compared to 10.2 per cent for males. This difference was most marked in countries such as Croatia, Czech Republic and Greece, where the female unemployment rate could be nearly 1.5 times the male equivalent. Meanwhile, in countries such as Ireland, Latvia and Lithuania, females had a lower unemployment rate than males, by as low as 0.7 times the male rate. Policy responses to these challenges remain timid and there is merit in addressing this severe labour market urgently. At the beginning of 2014, the European Commission launched a youth guarantee scheme to tackle youth unemployment in Europe. In many cases, however, there have been delays in its implementation. Moreover, funding remains inadequate, as only €3 billion of fresh funds are being deployed over a three-year period, less than 0.05 per cent of European GDP.3 Additional resources to tackle the problem of youth unemployment are needed, including measures to simplify funding procedures and accelerate programme implementation. Moreover, countries need to bear in mind the lessons learned from other similar programmes, notably by ensuring there is: (i) a good balance between active and passive policies, combined with personalized public employment service; and (ii) greater availability of resources for public employment services, so they are in a position to operationalize the youth guarantee scheme. Long-term unemployment and discouragement exist alongside increased risks of poverty and social exclusion The persistence of weak economic and labour market conditions in many countries has caused an unprecedented increase in the duration of unemployment. In the second quarter of 2014, long-term unemployment4 in the EU-27 was at 50 per cent (table 2.1), up from 38.5 per cent in the same quarter of 2008 and 47 per cent one year earlier. The highest shares were observed in Greece (74.4 per cent), followed by Italy (62.7 per cent) and Portugal (62.4 per cent). In contrast, long-term unemployment was lower than 20 per cent in countries such as Finland and Sweden, which have a tradition of providing active labour market policies aimed at the long-term unemployed. High and increasing levels of long-term unemployment are of particular concern. First, as the share of long-term unemployed increases, skills are being eroded and social exclusion rises, which in turn further reduces the likelihood of the long-term unemployed re-entering the labour market. Second, as the average duration of long-term unemployment spells is increasing in many countries, a large share of the long-term unemployed is no longer covered by any kind of income support or social protection. This has contributed to the observed rise in poverty and vulner­ ability across Europe in recent years (see table 2.2). In a number of countries undergoing fiscal consolidation, notably Greece, this has been exacerbated by significant cuts to social spending, which have constrained the coverage of the social protection system (see box 2.2). As a result, 16.6 per cent of the EU-27 population was at risk of poverty in 2013. Figures are even more dramatic among the unemployed: the risk of poverty was close to 47 per cent among this group. 3   http://europa.eu/rapid/press-release_MEMO-14-571_en.htm. 4   The long-term unemployment rate is calculated as the share of individuals unemployed for one year or more out of total unemployed individuals. Long-term unemployment and social indicators in the EU-27 (percentages)   2008 Latest Long-term unemployment 38.5 50.0 Population at risk of poverty 16.6 16.6 Unemployed at risk of poverty 44.8 46.6 At risk of poverty and social exclusion 23.8 24.4 Note: Figures here are restricted to EU-27 given that some of the data are limited to 2013. All labour market fig- ures refer to the population aged 15 and above. Long-term unemployment refers to the share of those unemployed for over one year out of total unemployed individuals. Figures for long-term unemployment refer to Q2 2008 and Q2 2014. Latest figures for poverty rates refer to 2013. Source: ILO Research Department based on Eurostat. 2.2 Table ContentsContents
  • 34.
    372. Regional developments:An uneven and uncertain recovery If the broader indicator of risk of poverty and social exclusion is considered, more than 24 per cent of the EU-27 population were attributed such status in 2013.5 The highest rates for risk of poverty and social exclusion were observed in Bulgaria (48.1 per cent), Romania (40 per cent) and Greece (35.7 per cent). In contrast, rates lower than 20 per cent were registered for Austria, Denmark and the Netherlands. Outside Europe, despite recently improved labour market conditions, discouragement has increased as a reaction to the prolonged labour market slump.6 In the United States, discouraged persons are estimated to have nearly doubled as a ratio of the labour force, from 0.3 per cent in 2008 to just under 0.6 per cent in 2013. There was also an increase in Australia, from 0.5 per cent to 0.7 per cent over the same period.7 In Japan, the discouragement rate initially increased, but by 2013 it had returned to its pre-crisis level of 0.8 per cent. Discouragement is particularly concerning when it affects youth (aged 15–24), when prolonged absence from the labour market can result in social alienation and lasting damage to employment prospects. While youth unemployment levels are typically lower in developed countries outside the EU, they remain elevated compared with the adult rates. For instance, in 2013 youth were 2.6 times more likely to be unemployed than their adult counterparts in the United States, 1.8 times in Japan, 2.3 times in Canada, and substantially higher in New Zealand, at 3.6 times more likely. Part of the reason for this is that job creation rates are failing to keep pace with population growth. 5   This indicator corresponds to the sum of persons who are at risk of poverty or severely materially deprived or living in households with very low work intensity. Material deprivation covers indicators relating to economic strain and durables. Severely materially deprived persons have living conditions severely constrained by a lack of resources and they experience at least four out of the nine deprivation items considered by Eurostat. 6   In some instances, the unemployment rate has fallen due to lower participation rates. 7   OECD Employment Database, accessed on 6 November 2014. The case of Greece Between 2007 and 2009, social protection expenditure grew by almost 8 per cent per year, mostly driven by spending on sickness care and old-age care – which increased by 27 per cent and 20 per cent, respectively, over this period. In 2010 a number of changes to the social protection system were introduced which focused on reducing benefit amounts or adjusting eligibility criteria. The result was steep cuts between 2010 and 2011 – notably, sickness- and old-age-related spending was cut by 21 per cent and 17 per cent, respectively. Major changes to the various benefits include the following: (i) Unemployment benefits: In 2012, the monthly un- employment benefit was set at €360 for full-time employees, down from the previous €454 per month.1 The total number of days for which a worker can claim unemployment benefit over a period of four years was reduced to 450 from 1 January 2013 and to 400 from 1 January 2014.2 (ii) Pensions: Pension payments were reduced succes- sively through various pieces of legislation during the crisis and Law No. 3847/2010 abolished the 13th and 14th monthly pension payments of former public employees3 and replaced them with more restricted vacation allowances, which were later abolished in 2013.4 In November 2011, Act No. 4024/2011 reduced the monthly main pension exceeding €1,000 for public sector pensioners under 55 years of age by 40 per cent, and by 20 per cent for those aged 55 and above with pensions exceeding €1,200. 1 The amount is increased by 10 per cent for each dependent person, and the benefit period ranges from 5 months to 12 months, depending on days worked during the control period. 2 Law 3996/2011 and Law 4203/2013, respectively.  3 Invalidity pensions, social pensions and farmers’ basic pensions were exempted.  4 The 13th and 14th monthly instalments of invalidity pensions, social pensions and farmers’ basic pensions were also abolished at this time. Source: ILO (2014c). 2.2 Box ContentsContents
  • 35.
    38 World Employmentand Social Outlook – Trends 2015 Central and South-Eastern Europe (non-EU) and the CIS Political turmoil and falling energy prices are leading to a growth slowdown GDP growth was relatively robust following the onset of the crisis, averaging 4.2 per cent per annum from 2009 to 2013 – benefitting in part from higher energy and commodity prices. This was despite lower than expected domestic demand, which has remained subdued as a result of significant weaknesses within the private sector, persistent high rates of unemployment, as well as tight credit conditions of local banks (burdened by high levels of non-performing loans) for the enterprise sector.8 This has contributed to the recent slowing in Central and South-Eastern Europe and the CIS’s output growth since 2012, from 5.6 per cent in 2011 to 2.6 per cent in 2013. Moreover, growth is expected to continue to decline in 2015 due to falling oil prices, leading to an economic slowdown in the Russian Federation. Central and South-Eastern Europe and the CIS are highly susceptible to economic conditions in the Russian Federation. In 2012, for instance, the Russian Federation directly accounted for just over half of the region’s GDP as well as being a major trading partner for many of the region’s countries. As such, economic outcomes in the region depend on a number of key developments, including energy prices, monetary policy in the United States, economic conditions in the European Union and political upheaval in Ukraine (box 2.3). Together these developments are having spillover effects on financing conditions, trade and remittances: • Costs and access to financing: The risk of higher interest rates in the future coupled with higher global rates stemming from the tapering of quantitative easing in the United States, threaten to dampen growth. Most Central and South-Eastern European countries as well as Kazakhstan are highly dependent on external funding (foreign direct investment, cross-border lending and portfolio investment) and their dependence has increased further since the beginning of the financial crisis. This high dependence on external funding exposes borrowers to risks of external shocks. In addition, public finances may be constrained where governments are reliant on external financing. 8   Turkey stood out with strong domestic demand, which accelerated economic growth to 4 per cent in 2013. Geopolitical tensions are affecting economies in Central and South-Eastern Europe and the CIS Geopolitical tensions arising from developments in Ukraine have reverberated across the region. Economic sanctions imposed on the Russian Federation by the EU, the United States and several other countries were met by counter-sanctions banning imports from those econ- omies, with effects on investment and trade for both the direct parties to the sanctions and for many of Russia’s CEES/CIS trading partners. In Ukraine, the loan agreement with the IMF signed in April 2014 helped to avert the threat of a public debt default. The national currency (hryvnya) was devalued by 40 per cent in February 2014, but the contraction of exports following the disruption of trade links with Ukraine’s main trading partner, the Russian Federation, and a sharp decline in industrial production due to the conflict in eastern Ukraine (one of the key indus- trial bases of the country) has caused the value of the hryvnya to erode further. Currency depreciation and the abolition of energy subsidies have led to inflationary pressures. The Ukrainian National Bank has reacted by lifting the key interest rate, which is having an additional negative effect on the enterprise sector. Moreover, the falling budget revenues in combination with mounting military spending are deepening the budget deficit. Source: ILO Research Department based on World Bank (2014a). 2.3 Box ContentsContents
  • 36.
    392. Regional developments:An uneven and uncertain recovery • Trade: The slowdown in the European Union and weak demand from the Russian Federation have hurt export growth, notably in CIS countries, where trade links with the latter are consider- able. Central and South-Eastern Europe are highly dependent on oil and gas from the Russian Federation. On the other hand, the embargo imposed by the Russian Federation on food imports from the United States and the EU could stimulate exports of food not only from Belarus and Kazakhstan, with whom the Russian Federation has a customs union, but also from Armenia, Azerbaijan, Kyrgyzstan, Serbia and Turkey, and thus provide an additional boost to their GDP. • Declining remittances: Remittances constitute a significant source of income in the CIS coun- tries and for Armenia, Moldova, Kyrgyzstan and Tajikistan any substantial decline in remit- tances would have dramatic implications (remittances contribute 52 per cent to GDP growth in Tajikistan and 31 per cent in Kyrgyzstan). Economic conditions in the Russian Federation and a deep recession in Ukraine are likely to have resulted in a fall in remittances in 2014, with a negative impact on household consumption, economic growth and social development in the countries of migration origin. Improvements in the labour market may stall as a result of these forces Over the period 2009 to 2014, the employment-to-population ratio rose more than 2 percentage points, from 53.1 per cent to 55.3 per cent, on the back of a rising labour force participation rate (see table 2.3). Employment expanded in the Russian Federation despite slowing growth: in 2014 the Russian Federation accounted for 43.5 per cent of all employed persons in Central and South- Eastern Europe and the CIS, but it only accounted for 18.2 per cent of the increase in the region’s total employment between 2009 and 2014. At the same time, the unemployment rate continued its downward trajectory, and is anticipated to have reached 7.7 per cent in 2014, i.e. 0.4 percentage points lower than in 2008 (see figure 2.3). Unemployment is expected to rise again in 2015, owing largely to an expected increase in the un- employment rate in Ukraine from 7.7 per cent in 2014 to 7.8 per cent in 2015. Moreover, a number of countries in the region, particularly in the Balkans, continue to have very high unemployment rates, including Serbia at 22.2 per cent in 2014, The Former Yugoslav Republic of Macedonia and Bosnia and Herzegovina both at 27.9 per cent. Concerns persist regarding the high incidence of informal employment and, to a lesser extent, vulnerable employment. In fact, nearly 32 million workers were in vulnerable employment in 2012. The presence of these precarious forms of employment combined with ageing populations in the region are likely to contribute to sluggish productivity growth in the medium to long term, reducing its ability to catch up with advanced economies. It is also affecting, as the following section high- lights, the incidence of working poverty. Economic and social developments in Central and South-Eastern Europe (non-EU) and CIS, 2009–19 (percentages) 2009 2012 2013 2014 2015 2016 2017 2018 2019 Labour force participation rate 59.0 59.7 59.8 59.9 60.0 59.9 59.9 59.7 59.6 Unemployment rate (total) 9.9 8.0 7.8 7.7 7.8 7.8 7.8 7.8 7.8 Youth unemployment rate 20.0 17.4 16.8 16.8 16.9 16.9 17.1 17.1 17.1 Employment growth –1.3 1.1 0.6 0.4 0.1 0.1 –0.1 –0.1 –0.1 Youth employment growth –5.0 –4.6 –2.3 –3.2 –3.4 –3.0 –2.9 –2.5 –1.9 Real wage growth –2.3 8.1 5.1 1.5 1.7 2.7 3.7 4.1 4.2 Productivity growth –5.1 1.9 2.0 0.6 1.7 2.6 3.0 3.2 3.3 Note: Regional wage and productivity growth includes estimates and projections for 16 out of 19 countries. For a detailed list of countries covered by the aggregate figures and sources of differences in the estimates in comparison with earlier publications (ILO, 2014b), please refer to Annex 4. Source: ILO, Trends Econometric Models, October 2014; ILO, Global Wage database, December 2014; ILO Research Department. 2.3 Table ContentsContents
  • 37.
    40 World Employmentand Social Outlook – Trends 2015 Social conditions and equity remain a challenge After the widespread decline in income inequality observed during the first half of the 2000s, progress in this regard has slowed and since the onset of the crisis income inequality – as meas- ured by the Gini index – has increased in six of the nine countries with available information (see table 2.4). This is true among countries with already high levels of income inequality, such as Georgia, Russian Federation and Turkey. Yet, these countries are, surprisingly, the ones that have been more successful in reducing poverty. For instance, the share of the population living below the national poverty line has fallen by almost 6 percentage points in Turkey and Georgia and by 3 percentage points in the Russian Federation. In contrast, poverty rates increased in Armenia, Kyrgyzstan and Ukraine, which have displayed relatively stable levels of inequality since 2007. In Kyrgyzstan, according to international poverty line measures, at the US$1.25-a-day level (PPP) and US$2-a-day level (PPP), the share of the population below both these thresholds increased between 2008 and 2012; for Armenia, over the same period, the share in extreme poverty ($1.25 a day) increased while the share in moderate poverty ($2 a day) decreased. This suggests that policies in Armenia may have failed to reach the very poorest. Only a few countries managed to simultaneously reduce both income inequality and poverty. Effective and sustainable policies to tackle the risks of poverty, inequality, social exclusion and marginalization remain key challenges across the region. One of the pressing social issues in the Source: ILO Research Department based on Trends Econometric Models, October 2014. 18 9 36 Unemploymentrate(percent) 27 Ukraine Russian Federation Kazakhstan Tajikistan FYR Macedonia Bosnia and Herzegovina 2008 2009 2014p Central and South-Eastern Europe and CIS 0 2.3 Figure Unemployment rates in the Central and South-Eastern Europe and CIS region and selected countries within, 2008, 2009 and 2014 (percentages) Income inequality and poverty in selected countries of Central and South-Eastern Europe and CIS Country Gini index Poverty rate (per cent) 2007 2012 or latest 2007 2012 or latest Armenia 29.8 30.3 27.6 32.1 Belarus 28.7 26.4 7.7 6.3 Georgia 40.6 42.1 20.1 14.8 Kazakhstan 29.6 28.5 12.7 2.9 Kyrgyzstan 33.4 33.4 35.0 38.0 Russian Federation 39.2 39.7 13.3 10.7 Turkey 38.4 40.1 8.4 2.3 Ukraine 29.6 24.6 7.1 9.1 Armenia 29.8 30.3 27.6 32.1 Source: World Bank, World Development Indicators database (accessed in October 2014). 2.4 Table ContentsContents
  • 38.
    412. Regional developments:An uneven and uncertain recovery region is the humanitarian crisis stemming from political and military conflicts as well as the internal and external displacement of persons. The latest UN reports estimate that as a result of the conflict in eastern Ukraine roughly 260,000 people are seeking refuge in other parts of the country, while Ukrainian refugees in the Russian Federation are estimated at 820,000. Meanwhile, Turkey has absorbed up to 1.6 million refugees from the crisis in Syria, severely straining humanitarian, housing and employment responses. Latin America and the Caribbean After a decade of strong growth, GDP growth is slowing to levels comparable to those of advanced economies Between 2003 and 2012, GDP in Latin America and the Caribbean (LAC) grew at an annual average rate of 3.7 per cent. The growth phase was driven by (i) strong demand for the region’s minerals and agricultural exports and an associated rise in international commodity prices; (ii) the availability of capital flows; and (iii) increase in domestic demand (IMF, 2014d). During this period, growth in LAC outpaced that in advanced economies by over 2 full percentage points (figure 2.4). Following the region’s initial uptick after the crisis, when annual GDP growth reached 6 per cent in 2010, the pace of growth has slowed and has gradually converged with rates prevailing in advanced economies. For 2014 (and 2015), GDP growth in LAC is forecast to be below that of advanced economies – for the first time since 2002. The recent slowdown is due to a number of factors, most notably weak global aggregate demand and falling commodity prices. Between 2011 and 2014, the prices of metals fell by more than 65 per cent (whereas between 2003 and 2011, prices increased more than four-fold).9 The decline in economic growth is also partially a reflection of low productivity growth, which has plagued the region for some time (1.5 per cent between 2003 and 2012 versus 2.0 per cent globally). The sluggish productivity gains stem from a number of structural issues, including still high rates of informal employment, inadequate investment in infrastructure, and an export base that is concentrated in primary sectors such as commodities and agricultural products (ILO, 2014e). 9   Based on IMF Metals Price Index. Figures for 2014 are provisional. Source: ILO Research Department based on IMF World Economic Outlook, October 2014. 4 8 –4 2003 2004 2005 2006 2008 2009 2010 2011 2012 2013 2014 2015 Advanced economies Latin America and the Caribbean 0 Forecast Percent 2.4 Figure GDP annual growth in LAC and advanced economies, 2003–15 (percentages) ContentsContents
  • 39.
    42 World Employmentand Social Outlook – Trends 2015 As a result, the pace of labour market and social improvements is slowing Thanks to the fast expansion of GDP and well-targeted policies in some countries, the un- employment rate in LAC has been falling at a rapid pace over the past decade – from 9.1 per cent in 2003 to 6.3 per cent in 2013 (see table 2.5). The urban unemployment rate declined at an even faster pace, going from 11 per cent in 2003 to 6.2 per cent in 2013 (ECLAC and ILO, 2014). Yet the pace of improvement is slowing: between 2013 and 2014 the unemployment rate rose by 0.3 percentage points – the first increase since the one of 2009. Moreover, the labour market outlook suggests that unemployment will stand at 6.8 per cent in 2015 and that it will remain near this level in the coming years. Male unemployment remains significantly lower than female unemployment – at 5.2 per cent and 7.8 per cent, respectively, in 2013 – although the gap has considerably narrowed since the beginning of the 2000s. Unemployment among youth has also declined considerably, i.e. from 17.5 per cent in 2003 to 13.3 per cent in 2013. Yet, this rate is 2.8 times the adult unemployment rate – a ratio higher than that registered in the EU (see above). In fact, youth are disproportionately over-represented in un- employment: young people represent more than 40 per cent of the total unemployed in the region, but they only represent 24 per cent of the working-age population. The youth unemployment rate will have slightly increased in 2015 – reaching 14.2 per cent. Moreover, youth are more likely to be in informal employment than adults – 56 per cent of young workers are employed in the informal economy compared with 46 per cent of adults (ILO, 2013b). Finally, youth suffer from gaps in the educational system as well as difficulties in school-to-work transitions.10 Informal employment persists, despite progress to formalize jobs, and represents one of the main challenges for labour markets in LAC. In 2013, 46.8 per cent of workers in LAC were informally employed, down from 52 per cent in 2005. Most of the informal employment is in the informal sector of the economy (30.5 per cent of total employment), while the remainder is composed of informal employment in the formal sector (11.4 per cent) and domestic workers (4.9 per cent) (ILO, 2014j). High levels of informal employment were registered in Peru (64.0 per cent), Mexico (53.8 per cent) and Ecuador (49.3 per cent), while the share of informal employment in Argentina is in line with the regional average (46.8 per cent), and relatively low levels of informality are found in Costa Rica (30.7 per cent), Uruguay (33.1 per cent) and Brazil (36.5 per cent). Inequality has decreased considerably in LAC during the past decade – the Gini index for the region declined a striking 5 points from 55 to 50 between 2002 and 2012. This was attributable in part to a reduction in the hourly wage gap between skilled and unskilled workers, a result of substantial increases in minimum wages in some countries, combined with significant and more progressive public transfers (Lustig et al., 2013). However, the pace of improvements has slowed in the past two years.11 Moreover, inequality levels remain higher than in other regions of the world. In particular, the median Gini index is 44.8 in LAC, compared with an average of 30.2 in developed countries, 42.1 in Sub-Saharan Africa and 36.7 in East Asia and the Pacific (figure 2.5). 10  See Bassi et al. (2012) for a detailed description of recent trends in youth performance within and outside the labour market. 11   Socio-Economic Database for Latin America and the Caribbean (CEDLAS and the World Bank). Economic and social developments in Latin America and the Caribbean, 2009–19 (percentages) 2009 2012 2013 2014 2015 2016 2017 2018 2019 Labour force participation rate 65.7 66.2 66.2 66.2 66.2 66.2 66.2 66.3 66.3 Unemployment rate (total) 7.5 6.3 6.3 6.6 6.8 6.9 6.8 6.8 6.8 Youth unemployment rate 15.5 13.5 13.3 13.8 14.2 14.2 14.1 14.0 14.0 Employment growth 0.7 2.5 1.7 1.4 1.7 1.7 1.6 1.5 1.5 Youth employment growth –3.5 1.6 0.7 –0.2 0.8 0.9 0.7 0.6 0.4 Note: Numbers on labour force and (un)employment might differ from estimates provided by ILO’s Panorama Laboral (ILO, 2014g) publication due to differences in methodology and coverage. Source: ILO, Trends Econometric Models, October 2014; ILO Research Department. 2.5 Table ContentsContents
  • 40.
    432. Regional developments:An uneven and uncertain recovery As a result of the overall improvements in labour market performance and the reduction in in- equality, poverty has fallen dramatically in LAC during the past decade. The share of the working poor in total employment – defined as those earning less than US$2 per day (PPP) – has decreased from 14.1 per cent in 2003 to 5.4 per cent in 2013. Meanwhile the share of the middle class – those earning more than US$13 per day (PPP) has increased from 17.8 per cent to 30.4 per cent during the same period. As a result, the income poverty headcount ratio of the entire population – thus Source: ILO Research Department based on Alvaredo and Gasparini (2013). Data refer to 2010. 45 55 65 25 35 H H J J H J J H H J J H H J J H H J J H H J J H Sub-Saharan Africa Latin America and the Caribbean Eastern Europe and Central Asia East Asia and the Pacific Middle East and North Africa South Asia Min Max Percentile 25 Percentile 75 2.5 Figure Inequality levels remain high in comparative terms as measured by Gini index Social protection programmes in Latin America: The case of Peru Peru has registered the largest progress in poverty reduc- tion in LAC during the past decade – its poverty rate dropped from 52.5 per cent to 23.7 per cent between 2003 and 2012. This reduction was mainly driven by economic growth and fiscal policies that were comple- mented by social protection programmes. An example of this is the National Programme for the Support of the Poorest (Juntos). Juntos is a conditional cash transfer (CCT) programme introduced in 2005 with the aim of reducing poverty by improving nutrition and access to health and education for vulnerable populations. The Government’s long-term objective was to promote human capital accumulation for future generations as a way of reducing the intergener­ ational transmission of poverty, while in the short term re- ducing poverty through cash transfers. The programme is aimed at children as well as expectant and nursing mothers; requirements for the programme include regular attendance at school and health checks. In 2008, the Government decided to give additional sup- port to the programme and to place it as a key element of its anti-poverty social policy. In collaboration with the World Bank, the programme has been closely monitored since then and its impact evaluated. It has been found that the programme has moderately reduced poverty and has had positive effects on income and consump- tion.1 Moreover, Juntos has improved access to health services, both for children and women, and increased school attendance. Finally, more recent studies have shown that the longer the duration of participation, the greater the impact of the programme.2 Evaluating programmes of this nature is critical in the quest of governments for programmes that work effec- tively. In Peru, availability of specific questions as part of the Peruvian National Household Survey (ENAHO) regarding the participation of households in the Juntos programme was a key element that made these evalu- ations possible. Additional efforts are, however, ne- cessary to shed light on the effects of the many other important social and labour market policies that exist in Peru and elsewhere in LAC. Conscious of this need, the ILO Research Department will be publishing a report on the effectiveness of active labour market policies in Latin America in the summer of 2015.3 1 Perova and Vakis (2009).  2 Perova and Vakis (2011).  3 ILO (forthcoming). 2.4 Box ContentsContents
  • 41.
    44 World Employmentand Social Outlook – Trends 2015 considering individuals of all age groups and both inside and outside the labour market – has decreased from 43.9 per cent in 2002 to 27.9 per cent in 2013. In absolute terms, this represents a decrease in the total number of poor people from 225 million to 164 million.12 However, these positive developments have also slowed: the share of working poor in the total employed population decreased in 2013, but by only 0.23 percentage points – compared with an average decrease of 0.79 percentage points per year in the previous decade. Given the weak macroeconomic outlook of the region, achieving further gains in poverty reduction will be an im- portant challenge. Moreover, wage growth continues to trail increases in productivity, leading to a fall in the labour income share, despite the good employment performance and the reduction in poverty. Unless addressed, this will limit the capacity of the region to generate stronger domestic demand to offset dependence on external demand for its commodity exports. The role of public policies will thus be crucial to redirect economic growth towards poverty alleviation and shared prosperity. Some countries in the region, including Argentina, Brazil and Uruguay, have compre- hensive social and labour market programmes that have obtained significant results in reducing poverty and inequality over the past decade. The example of the Juntos programme in Peru is discussed in box 2.4. East Asia Slower growth in China is affecting the region’s growth prospects Economic growth in China, the largest economy in the region, is estimated to have slowed to 7.4 per cent in 2014, compared with 7.7 per cent in 2013.13 Economic indicators in the third quarter of 2014 declined markedly, with growth in fixed-assets investment, industrial production and foreign direct investment into China weakening to levels not seen in recent years. In response, the People’s Bank of China lowered the benchmark loan and deposit interest rates in November 2014. The slowdown reflects, in part, continued weak external demand based on slow global economic growth, together with only limited success in the Government’s effort to rebalance the economy towards greater reliance on household consumption rather than investment and exports. The share of household consumption in GDP rose from 34.9 per cent in 2010 to 36.2 per cent in 2013. In addition, credit growth slowed as interest rates rose, although this is expected to bring credit growth to a more sustainable level. Further, curbs in public investment and infrastructure spending – also a significant force behind GDP growth over the past decade – have fallen, but should help reduce the fiscal deficit in the medium term. A major challenge for China’s outlook in the medium term lies in vulnerabilities of its real estate sector. Over the past decade, real estate investment (including construction) has made an increasing contribution to growth and employment, rising from around 5–6 per cent of GDP in 2000 to approximately 15 per cent in 2012, and accounting for around 14 per cent of all urban employment in 2012 (IMF, 2014b). Such trends are due to a combination of low interest rates, popular use of real estate as collateral for corporate borrowing, and its role as a significant source of funding for local governments. The real estate sector has started to decline in terms of investment activity, but there is a risk of an abrupt or disorderly decline, which would have negative conse- quences for both employment and output. Against the backdrop of the slowdown in China, the East Asian economy is projected to have grown by 6.8 per cent in 2014, with output slowing to 6.6 per cent in 2015. Countries bucking the trend include the Republic of Korea and Mongolia, where growth in 2014 is expected to have accelerated to 3.7 per cent and 9.1 per cent, respectively.14 12   Economic Commission for Latin America and the Caribbean database. 13   China GDP projections based on IMF (2014a). 14   Mongolia and Republic of Korea GDP projections based on IMF (2014b). ContentsContents
  • 42.
    452. Regional developments:An uneven and uncertain recovery New, educated entrants to the labour market are affected – exacerbating the demographic challenge The deceleration in growth in East Asia has led to a slow but steady rise in the unemployment rate (see table 2.6). As such, the unemployment rate is expected to have climbed from 4.2 per cent in 2010 to 4.6 per cent in 2014. During this period, the increase in the unemployment rate has been more pronounced among youth, increasing from 9.0 per cent in 2010 to 10.5 per cent in 2014, while that of adults is estimated to have risen from 3.2 per cent in 2010 to 3.7 per cent in 2014. This partly reflects the difficulties young people face in finding jobs that match their skills and expectations. In China, for example, the unemployment rate in 2013 was just above 4 per cent in urban areas, but was more than double among registered graduates in the same area (box 2.5). Birth rates continue to outpace mortality rates across the East Asian region (12.9 births to 7.3 deaths per 1,000 people), but at a lower rate than in 1990 (21.5 births to 6.8 deaths). This has resulted in a considerable slowdown in population growth: decreasing from 1.6 per cent per annum between 2000 and 2009 to 0.7 per cent per annum between 2010 and 2014. In China, for instance, the old-age dependency ratio – represented here as the ratio of those aged 65+ to every 100 members of the working-age population (15–64) – has increased from 8.9 in 1990 to 12.4 in 2013, and is anticipated to reach 23.8 by 2030. Elsewhere, such as in the Republic of Korea, the ratio is expected to increase from 16.8 in 2013 to 37.1 in 2030, and in Mongolia, from 5.5 to 10.6 over the same period. The extent to which these trends will put downward pressure on GDP growth depends in part on the accumulation of wealth achieved through the boom years. Relative to the global average of 51.5 per cent, the proportion of older women and men receiving an old-age pension is high in East Asia. In China and the Republic of Korea, around three in four older persons are pension beneficiaries, while in Mongolia coverage is universal. In early Economic and social developments in East Asia, 2009–19 (percentages) 2009 2012 2013 2014 2015 2016 2017 2018 2019 Labour force participation rate 70.7 70.6 70.8 70.8 70.9 70.8 70.7 70.5 70.3 Unemployment rate (total) 4.4 4.4 4.5 4.6 4.8 4.9 4.9 5.0 5.0 Youth unemployment rate 9.4 9.7 10.1 10.5 10.8 11.1 11.4 11.6 11.7 Employment growth 0.4 0.8 0.7 0.5 0.4 0.3 0.2 0.1 0.1 Youth employment growth –2.3 –3.9 –5.2 –5.7 –5.5 –5.1 –4.8 –4.3 –3.5 Real wage growth 7.5 7.7 7.1 6.9 6.9 6.9 6.8 6.8 6.7 Productivity growth 7.1 5.9 6.2 6.3 6.2 6.1 6.1 6.0 5.9 Note: Regional wage and productivity growth includes estimates and projections for 3 out of 7 countries. For a detailed list of countries covered by the aggregate figures and sources of differences in the estimates in comparison with earlier publications (ILO, 2014b), please refer to Annex 4. Source: ILO, Trends Econometric Models, October 2014; ILO, Global Wage database, December 2014; ILO Research Department. 2.6 Table China’s graduates: Not enough good jobs To expand higher education in the country, the Government of China increased the numbers of colleges and universities from 1,552 to 2,491 between 2003 and 2013. During the same period, the number of secondary vocational schools declined by 16.4 per cent (from 14,682 to 12,281). Moreover, 6.4 million college graduates entered the labour force in 2013, 3.4 times higher than in 2003 (NBS, 2014). According to the Chinese College Graduates’ Employment Annual Report 2014, China now faces the significant challenge of addressing unemployment among graduates, which stood at 8.6 per cent in 2013. For those new graduates who found jobs, the average wage was 3,250 yuan (about US$525, as of 2013) per month, which is roughly four-fifths of the urban average.1 Approximately 56 per cent of graduates in 2013 expressed dissatis- faction with their current jobs. One of main challenges for the country is, therefore, to utilize the potential of new graduates more productively in the economy. 1 Calculated based on NBS (2014) and assuming that US$100 = 619.32 yuan. Source: NBS (2014), Annual Report 2014, Blue Book of Employment, Social Sciences and Academic Press (China). 2.5 Box ContentsContents
  • 43.
    46 World Employmentand Social Outlook – Trends 2015 2014, China made further strides in strengthening its social security system by merging disparate schemes and announcing other measures to address issues of adequacy, equality, portability and sustainability. In the case of the Republic of Korea, addressing the impact of ageing entails promoting greater economic participation of women, for example through improved childcare and maternity leave benefits, as outlined in the recent policy initiative to achieve a 70 per cent employment rate. This would not only help counter concerns related to ageing, but also narrow labour market gender gaps. The region’s social outlook could be weighed down by high (and in some case rising) levels of income inequality. In China, for example, the Gini index increased from 32.4 in 1990 to 42.6 in 2002 and has changed very little since.15 Meanwhile, the share of total income held by the most wealthy 10 per cent of the population increased by 4.7 percentage points, from 25.3 per cent in 1990 to 30.0 per cent in 2009. Likewise, in Mongolia, the comparable income share rose 5.5 per- centage points, from 22.9 per cent in 1998 to 28.4 per cent in 2008, reflecting the growing uneven distribution of natural resource revenues. In this context, policy priorities in China have shifted to promote consumption and wages as critical aspects of reforms and rebalancing of growth. The Government has used minimum wage policies aggressively, with annual double digit increases over more than a decade. Other policies aim to accelerate urbanization to help close the rural–urban income and opportunity divide.16 South-East Asia and the Pacific Developments in the region’s large economies are weighing on regional GDP growth Economic growth in the South-East Asia and the Pacific region is forecast to have fallen below 5 per cent in 2014 – the lowest level since 2008. Growth in the region has been affected by develop- ments in Indonesia, the region’s largest economy, whose exports have remained weak since early 2013. Although the pace of decline has slowed in recent months, export growth has been negative, year-on-year, since February 2013. Both domestic policies to increase value added and spillovers from slower growth in China have taken a toll on Indonesia’s export growth. Economic growth in the South-East Asia and the Pacific region was also dampened by political developments in Thailand: annual GDP growth is expected to have fallen to 1.5 per cent in 2014 as political uncertainty in the country weighed on consumer and business sentiment as well as tourism.17 Similarly, while economic growth remains robust in the Philippines, in part due to gains in manufac- turing, the pace of growth is set to have slowed to 6.5 per cent in 2014, compared with 7.2 per cent 15   The latest available information from the World Bank (2014c) indicates that the Gini index in China stood at 42.1 in 2010. 16   For further discussion, see ADB (2014) and Buckley (2014). 17   GDP forecast based on Bank of Thailand. Economic and social developments in South-East Asia and the Pacific, 2009–19 (percentages) 2009 2012 2013 2014 2015 2016 2017 2018 2019 Labour force participation rate 70.3 70.4 70.4 70.4 70.4 70.3 70.2 70.1 70.0 Unemployment rate (total) 5.2 4.1 4.3 4.3 4.3 4.2 4.2 4.2 4.1 Youth unemployment rate 14.0 12.7 13.6 13.6 13.6 13.6 13.6 13.6 13.5 Employment growth 1.8 2.0 1.5 1.6 1.5 1.5 1.4 1.4 1.3 Youth employment growth –0.2 0.6 –0.7 0.3 0.0 –0.1 –0.2 –0.2 –0.1 Real wage growth 2.6 3.6 6.1 1.9 3.1 3.4 3.7 3.7 3.8 Productivity growth 0.0 4.0 3.4 2.8 3.7 3.7 3.9 4.0 4.0 Note: Regional wage and productivity growth includes estimates and projections for 7 out of 14 countries. For a detailed list of countries covered by the aggregate figures and sources of differences in the estimates in comparison with earlier publications (ILO, 2014b), please refer to Annex 4. Source: ILO, Trends Econometric Models, October 2014; ILO, Global Wage database, December 2014; ILO Research Department. 2.7 Table ContentsContents
  • 44.
    472. Regional developments:An uneven and uncertain recovery in 2013.18 On the upside, GDP growth in Fiji, Papua New Guinea and Timor-Leste is projected to have picked up in 2014, reaching 3.8 per cent, 9.0 per cent and 6.0 per cent, respectively.19 Sudden capital flow reversals remain a key concern in this region. Net flows in the ten member countries of the Association of Southeast Asian Nations (ASEAN) rebounded in the first half of 2014, but concerns linger on the possible rapid retrenchment of capital flows if global investors reassess policy rate differential and risk outlooks. For the moment, however, net foreign direct investment inflows in the ASEAN countries have remained relatively stable, even during the recent period of financial market turmoil. In addition to potential spillovers from monetary policy in advanced economies, especially the United States, the South-East Asia and the Pacific region is also confronted by potential spillovers from slowing growth and rebalancing in China, given the region’s increasing trade and investment linkages.20 Research indicates, for example, that each percentage point deceleration in China’s output growth could lower GDP growth in the median ASEAN-5 economy by 0.35 percentage points (IMF, 2014c).21 Employment growth has been steady, including for youth and women, but structural shifts will bring institutional challenges Between 2010 and 2014, overall employment grew on average by 1.8 per cent per annum. During that period, women’s employment grew at a slightly faster rate, i.e. 1.9 per cent, compared with 1.7 per cent for men. This was likely driven by the trend in a few countries, such as Indonesia, Malaysia and Viet Nam (see box 2.6), where women’s employment expanded primarily in labour-­ intensive manufacturing and trade-related services. In addition, women in vulnerable employment as a share of total female employment declined 1.7 percentage points in the same period, while vulnerable employment among men decreased by 1.0 percentage point.22 Job creation among youth has also been fairly robust, averaging 0.6 per cent per annum between 2010 and 2013, compared with the period 2000 to 2009, during which employment of young men and women fell by the same margin per annum. The overall employment dynamics continue to evolve: the share of agricultural employment con- tinues to decline and increased economic integration within the region will have important labour market and social consequences.23 With respect to the latter, in 2015 the ASEAN Economic Community (AEC) will become a single common market and production base.24 This is likely to spur greater trade and investment flows and accelerate structural change. But analysis of the impact on the labour market shows that the benefits of the AEC could be uneven (ILO and ADB, 2014). Labour demand in some sectors (and countries) may expand while in others it could decline. Without strong social protection measures and employment services in place, the social outlook for redundant workers and young graduates without the right skills could be daunting. In addition, strong and appropriate wage-setting institutions will be needed to avoid beggar-thy-neighbour strategies that could impede further progress in the areas of poverty reduction and inequality. Indeed, with a few exceptions, public investment in social protection in the region remains limited in comparison with the global average of 8.6 per cent and labour market institutions have not developed sufficiently. However, notable progress has been achieved recently in Cambodia and Viet Nam, for example, where existing weaknesses in wage-setting institutions have been addressed through new tripartite wage-setting mechanisms covering at least some sectors. 18   Manufacturing expanded by 10.2 per cent in the second quarter of 2014 compared with the same period in the previous year. 19   Growth in Fiji is forecast to have been the highest rate since 1999, as the build-up to democratic elections in September 2014 boosted economic confidence. 20   The combined share of ASEAN total trade with China rose from 4.4 per cent in 2000 to 13.1 per cent in 2012. See ILO and ADB (2014). 21   Other research finds that a 1.0 percentage point deceleration in China’s investment growth is associated with a decline in GDP growth of around 0.6 percentage points in Malaysia and the Republic of Korea, by around 0.4 percentage points in Thailand and by around 0.2 percentage points in the Philippines. See Ahuja and Nabar (2012). 22   However, despite notable gains in raising women’s profiles in the Southeast Asian labour market, employment in the region continues to be marked by gender differences. The gap in labour force participation rates between 2010 and 2014 remained steady at approximately 23 per- centage points and while 55.6 per cent of employed men were vulnerable, the rate was much higher for women, 62.6 per cent. 23   The share of employment in agriculture declined from 40.5 per cent in 2010 to 37.1 per cent in 2014 (though the decline in Thailand has modestly reversed, and in Samoa extremely low labour force participation rates can be largely attributed to the high significance and persistence of subsistence agriculture. In fact, in Thailand between 2010 and 2013, there was a slight increase in the share of agricultural employment (in the third quarter) from 42.4 per cent to 44.1 per cent for men and from 38.7 per cent to 39.3 per cent for women (ILO, 2014h). 24   The ten members of ASEAN are Brunei Darussalam, Cambodia, Indonesia, Lao People’s Democratic Republic, Malaysia, Myanmar, Philippines, Singapore, Thailand and Viet Nam. ContentsContents
  • 45.
    48 World Employmentand Social Outlook – Trends 2015 Finally, a critical driver weighing on the social outlook of South-East Asia and the Pacific is the impact of climate change and frequent natural disasters that destroy livelihoods and communities. For example, Samoa’s economy was devastated by Cyclone Evan in December 2012, which caused damage and losses estimated at 30 per cent of GDP (ILO, 2014i). In the Philippines, Typhoon Haiyan struck in November 2013 and impacted an estimated 5.9 million workers and their families (ILO, 2013c). In this context, reconstruction strategies that include social protection measures and emergency employment responses would help affected workers to more rapidly rebuild their lives, their families and their communities. Greater investment in disaster preparedness and risk reduction through stronger international cooperation will also help.25 25   For further discussion, see United Nations (2014). Female employment in Malaysia Between 2010 and 2013, the employment growth rate for female workers in Malaysia was higher than for their male counterparts (5.9 per cent compared with 2.2 per cent). However, job quality remains of concern given that almost half (around 46 per cent) of the jobs for women were created in vulnerable employment, compared with less than 10 per cent for men. In addition, the vast majority of additional female jobs were in the service sector (79.5 per cent), followed by the industrial sector (15.8 per cent) and agriculture (4.7 per cent). In contrast, male employment in agri- culture contracted by 3.9 per cent. The largest gains in male employment were in the service sector (59.4 per cent), followed by the industrial sector (44.4 per cent). 2.6 Box Note: Figures in parenthesis represent the percentage increase in the employment level over the period 2010–13. Source: ILOSTAT, Malaysian Labour Force Survey. 6 9 3 (thousands) Male Female 0 (9.1%) (17.6%) 2010 2013 2.6 Figure Employment level in Malaysia by gender, 2010 and 2013 ContentsContents
  • 46.
    492. Regional developments:An uneven and uncertain recovery South Asia Growth is recovering but challenges from global and domestic forces remain India, the region’s largest economy, experienced a sharp slowdown in 2012 and 2013, when growth dropped below 5 per cent, driven in particular by weak industrial output. Following this, the Indian economy grew slightly faster in 2014, reaching 5.4 per cent, reflecting an improvement in the growth rate of the services sector and a better monsoon than originally forecast. Bangladesh and Sri Lanka have been able to maintain robust economic growth rates in recent years. In Bangladesh’s case, the economy has grown at around 6 per cent for an extended period due to the strong growth in exports (driven by the garment industry) and consumption (fuelled by remittance inflows). The Sri Lankan economy has performed even better, with the GDP growth rate estimated at 7.0 per cent in 2014, on the heels of strong domestic demand and a rise in exports and tourism. The economies of Nepal and Pakistan have consistently grown below the regional average, with the former suffering in recent years from political tensions and the latter having been hit by inse- curity, political uncertainty and weak macroeconomic fundamentals. Growth in Afghanistan and the Maldives also slowed in 2014. Like other developing regions, South Asia faces uncertainty stemming from spillover effects of monetary policy in advanced economies and energy price disruptions. India, whose economy remains the main destination for foreign direct and institutional investment flows in the region, was particularly affected in 2013. During the country’s fiscal year 2013–14, foreign direct investment inflows reached US$36.0 billion and net foreign institutional investment (FII) flows in just the first three months of the same fiscal year amounted to US$12.5 billion.26 Thereafter there was a swift reversal of FII flows: between June and August 2013, net FII outflows amounted to US$15.4 billion, before short-term capital flows stabilized and returned by the end of 2013 due to measures taken by the Reserve Bank of India. Jobless growth underpinned by informal employment and working poverty South Asia faces a serious challenge of jobless growth, as average annual economic growth of 6.1 per cent from 2009 to 2014 corresponded to employment expansion of only 1.4 per cent per year for the same period (table 2.8). Moreover, much of the employment growth that occurred was in vulnerable and informal employment (IILS, 2013). For instance, vulnerable employment accounted for over three-quarters of all employment in 2014, with many of those in vulnerable employment working in subsistence agriculture and likely to be among the working poor. Moreover, the majority of women in South Asia are still heavily dependent on this sector, at 62.0 per cent in 2014, compared with 42.1 per cent for men. Most South Asian countries face a challenge of low labour force participation for women, with the exception of Nepal (see figure 2.7). Typically, low female participation in South Asia has been attributed to social norms associated with women burdened with household duties as well as relatively lower levels of female education. The process of structural transformation remains unfinished in South Asia. In 2014 agriculture accounted for 46.8 per cent of all employment in the region, compared with the global average of 29.1 per cent.27 While the share in agriculture has been declining, from 52.2 per cent in 2008, there is a scarcity of quality opportunities for those leaving rural areas and for the large number of young people entering the labour market. An additional 2.1 million youth will enter the labour force over the next five years, potentially aggravating already high youth unemployment, which is 4 times higher than that for adults. The unemployment rate is relatively low in South Asia, at 3.9 per cent in 2014 – lower than in all other regions – but this fails to reflect the quality of jobs. The share of those in employment who live below PPP US$1.25 per day (the international extreme poverty threshold) is estimated at 19.3 per 26   EXIM Bank, http://www.eximbankindia.in/sites/default/files/ind-eco.pdf. 27   There has been significant cross-country variation in employment in the manufacturing sector: from just 6.6 per cent in Nepal to 18.5 per cent in Sri Lanka. ContentsContents
  • 47.
    50 World Employmentand Social Outlook – Trends 2015 cent in 2014 – equivalent to 124 million people. Only Sub-Saharan Africa has a higher share. The same is true at the US$2-a-day level (PPP), which accounts for over half of the employed population (54.4 per cent in 2014), equivalent to 350 million people. Nonetheless, over the past decade, many countries in the region have also been able to reduce the extent of extreme poverty. This owes largely to the anti-poverty focus adopted in national devel- opment plans by countries including India, Bangladesh and Nepal, such as the rural employment guarantee in India and enhanced access to finance for the poor. The share of the population living on less than US$1.25 a day (PPP) fell from 58.6 per cent in 2000 to 43.3 per cent in 2010 in Bangladesh, while in Nepal it dropped from 53.1 per cent in 2003 to 23.7 per cent in 2010 (see table 2.9). Declines of a similar magnitude have been observed in India and Pakistan, where the share was 24.7 per cent and 12.7 per cent, respectively, in 2011. Bhutan, Maldives and Sri Lanka Economic and social developments in South Asia, 2009–19 (percentages) 2009 2012 2013 2014 2015 2016 2017 2018 2019 Labour force participation rate 57.8 56.1 56.1 56.2 56.2 56.3 56.3 56.3 56.3 Unemployment rate (total) 4.2 3.9 3.9 3.9 3.9 4.0 4.0 4.0 4.0 Youth unemployment rate 9.8 9.9 9.9 10.0 10.1 10.2 10.2 10.3 10.3 Employment growth 0.7 1.0 2.0 1.9 1.9 1.8 1.8 1.7 1.7 Youth employment growth –2.1 –1.8 0.6 0.4 0.3 0.3 0.3 0.2 0.1 Real wage growth 4.8 1.3 3.3 2.3 2.7 3.1 3.3 3.5 3.6 Productivity growth 6.8 3.8 3.2 3.6 4.2 4.4 4.6 4.8 4.8 Note: Regional wage and productivity growth includes estimates and projections for 5 out of 8 countries. For a detailed list of countries covered by the aggregate figures and sources of differences in the estimates in comparison with earlier publications (ILO, 2014b), please refer to Annex 4. Source: ILO, Trends Econometric Models, October 2014; ILO, Global Wage database, December 2014; ILO Research Department. 2.8 Table Source: ILO Research Department based on ILOSTAT and national sources. 25 100 Labourforceparticipationrate (percent) 75 Male Female Pakistan (2013) India (2011–12) Sri Lanka (2013) Bangladesh (2010) Nepal (2013) 50 68.9 21.5 31.2 35.6 36.0 77.579.8 75.5 82.5 85.6 0 2.7 Figure Gender differences in labour force participation rates, selected countries (percentages) Poverty headcount ratio and inequality, selected countries, latest available data Country Poverty headcount ratio at US$1.25 a day (PPP) (% of population) Poverty headcount ratio at US$2 a day (PPP) (% of population) Gini index Afghanistan – – 27.8 (2008) Bangladesh 43.3 76.5 32.1 (2010) Bhutan 1.7 15.5 38.7 (2012) India 24.7 60.5 33.9 (2010) Maldives 1.5 12.2 37.4 (2004) Nepal 23.7 55.9 32.8 (2010) Pakistan 12.7 50.6 29.6 (2011) Sri Lanka 4.1 23.9 36.4 (2010) Source: World Bank Poverty and Equity Databank and PovcalNet. 2.9 Table ContentsContents
  • 48.
    512. Regional developments:An uneven and uncertain recovery have almost eradicated extreme poverty during the past decade. However, these countries show the highest levels of income inequality in the region, which has remained relatively persistent over the past decade. This suggests that poverty alleviation does not automatically translate into a more equal distribution of the benefits of economic growth. The share of people living on less than US$2 a day (PPP) remains extremely high, at 60 per cent in India (2012) and over 50 per cent in Pakistan (2011) and Nepal (2010). The situation is even more dramatic in Bangladesh, where three out of four people lived on less than US$2 a day (PPP) in 2010. Middle East and North Africa Geopolitical uncertainty continues to hold back economic growth Difficult political transitions, security challenges and rising regional conflicts continue to weigh on the economic prospects of Middle East and North Africa (MENA). GDP growth in the region is expected to have remained tepid in 2014, at around 2.6 per cent, slightly above the 2.3 per cent registered in 2013. This represents a significant slowdown in regional economic progress, considering that annual growth had averaged 5.3 per cent between 2000 and 2012. In 2015, GDP growth should reach 3.8 per cent. However, projected economic growth will not be sufficient to reduce the persistently high unemployment rates. Domestic consumption, supported by large remittances and public subsides, will continue to drive growth among oil-importing economies, which are expected to grow on average by around 3 per cent in 2014 and 4 per cent in 2015. Below-average GDP growth in 2014 is expected in Egypt and Lebanon, while Morocco and Tunisia should have grown by 3.5 per cent and 2.8 per cent, respectively. Declining oil prices, conflicts and unstable security situations continue to weigh on the economic prospects of many countries in the region. While GDP growth in Gulf Cooperation Council (GCC) countries28 was sustained in 2014 – reaching 4.6 per cent in Saudi Arabia and 6.5 per cent in Qatar, this does not take into account the significant fall in the price of oil that took place in the second half of 2014.29 Even before oil’s price decline, capital outflows had been larger in those GCC countries with the weakest external positions, such as Bahrain and Oman.30 The fall in oil prices could thus lead to deterioration in their fiscal positions. Indeed, the share of non-oil revenues in total public revenues remains limited, ranging between 10 per cent and 20 per cent in five out of six GCC countries in 2013 – the exception was Qatar, where it stood at around 40 per cent. Moreover, lower prices will strain public finances for a number of countries, including Algeria, Bahrain, Iran, Iraq, Libya and Saudi Arabia, which may have considerable negative impli- cations for social spending (IMF, 2014d). As such, diversification into non-oil sectors may need to accelerate: in 2014, steady economic growth in GCC countries was already, in part, a reflection of economic diversification spurred by large amounts of private credit. Unemployment persists at high levels Labour markets in the MENA region have yet to recover from the political instability that surfaced in 2011 (see table 2.10). Indeed, in 2011 the unemployment rate rose to 11.6 per cent – from 10.8 per cent the previous year – and is expected to remain at 11.7 per cent through to 2015, with a youth unemployment rate remaining 3.7 times higher than the adult rate. As such, unemployment rates in the region continue to be the highest in the world, with the youth unemployment rate at a staggering 29.5 per cent in 2014 and expected to rise to 29.8 per cent in 2015. Making strides in reducing unemployment, especially among youth, is hampered by the size of the growing and comparatively 28   The GCC countries are Bahrain, Kuwait, Oman, Qatar, Saudi Arabia and the United Arab Emirates. 29   According to IMF (2014d), the future oil price may be uncertain, as there is a more than 30 per cent probability that the oil price will be above US$112 or below US$87 per barrel in the middle of 2015. Indeed, between June and December 2014, the IMF’s petroleum price index had fallen by nearly 90 per cent and as of 31 December 2014, the Brent Crude price of oil per barrel stood at US$55. 30   GCC economies have recently experienced net outflows of private capital, though this has been somewhat smaller than in other emerging economies (IMF, 2014d). ContentsContents
  • 49.
    52 World Employmentand Social Outlook – Trends 2015 young population. In 2014, 26.2 per cent of the working-age population was aged 15–24 years, compared with 22.4 per cent globally. Female participation in the labour force remains very low. The labour force participation rate for women in the region was 21.7 per cent in 2014, which is 53.5 percentage points lower than the rate for men (75.2 per cent). The gender gap in labour market performance extends beyond partici- pation. For instance, the female unemployment rate stood at 21.3 per cent in 2014, 2.3 times the male equivalent, and compares with a global female unemployment rate of 6.3 per cent. Moreover, 27.3 per cent of employed women in the MENA region are classified as “unpaid family workers”, compared with 18.2 per cent globally. The lack of employment opportunities has led to an increase in informality: the informal economy is estimated now to employ two-thirds of the labour force and produce one-third of GDP in non-GCC countries.31 ILO survey results show that the incidence of job informality among youth reaches above 50 per cent in Jordan and Tunisia, while it is over 90 per cent in Egypt and Occupied Palestinian Territories. Moreover, the informal economy is growing as a result of the deteriorating geopolitical situation in the region. Preliminary ILO estimates of the impact of Syrian refugees on local labour markets in Lebanon and Jordan show increasing informality alongside deteriorating wage levels and working conditions (box 2.7). Skills mismatch is another key structural challenge for the region. At present the public sector is often one of the largest employers of workers with higher-than-average educational attainment (World Bank, 2013). However, the ILO finds that for a number of countries, undereducation in employment was more prevalent than overeducation.32 Accordingly, improved education for youth, coupled with improved linkages between the government, educational institutes and the mar- ketplace, is needed to resolve the incidence of skills mismatch and to facilitate school-to-work transitions. Lack of inclusive development has caused persistent poverty and inequality The share of the population in extreme poverty – i.e. living on less than US$1.25 a day (PPP) – is rather low in the whole region, at around 7.4 per cent in 2012, though this was an increase from 4.1 per cent in 2010 (ESCWA, 2014). However when national poverty lines are considered, poverty incidence rises in many countries, reaching 25 per cent in Egypt, 18 per cent in Iraq and 15 per cent in Jordan and Tunisia. Moreover, around 23.4 per cent of Arab people were living below the national poverty line in 2012, up from 22.7 in 1990 (ESCWA and League of Arab States, 2013). In addition, income inequality – as measured by the Gini index – ranges from around 30 in Egypt and Iraq to more than 40 in Morocco. High levels of income inequality are primarily a result of the lack of adequate wage policies (minimum wages where they exist are low) and limited 31   This figure is based on the definition of the informal economy “as the share of all employment with no access to social security” (Angel-Urdinola and Tanabe, 2012). 32   ILO School to Work Transition Surveys found, for instance, that in Occupied Palestinian Territories, Tunisia, Egypt and Jordan, those considered undereducated for their employment accounted for 47.1 per cent, 31.8 per cent, 38.9 per cent and 43.0 per cent of the respondents, respectively, with overeducated accounting for 13.2 per cent, 6.4 per cent, 8.8 per cent and 9.4 per cent, respectively. Economic and social developments in Middle East and North Africa, 2009–19 (percentages) 2009 2012 2013 2014 2015 2016 2017 2018 2019 Labour force participation rate 48.0 48.8 49.2 49.4 49.6 49.7 49.8 49.9 50.0 Unemployment rate (total) 10.5 11.7 11.6 11.7 11.7 11.6 11.6 11.5 11.5 Youth unemployment rate 24.0 28.7 29.1 29.5 29.8 29.9 29.9 29.9 29.9 Employment growth 2.9 2.6 2.9 2.3 2.3 2.3 2.2 2.1 2.0 Youth employment growth –0.2 –1.9 –1.1 –1.6 –1.2 –0.8 –0.4 –0.2 0.0 Real wage growth –1.2 2.0 1.2 –0.5 –0.4 0.6 1.0 1.3 1.6 Productivity growth –0.5 1.2 –1.6 1.0 1.6 1.9 2.1 2.3 2.4 Note: Regional wage and productivity growth includes estimates and projections for 13 out of 19 countries. For a detailed list of countries covered by the aggregate figures and sources of differences in the estimates in comparison with earlier publications (ILO, 2014c), please refer to Annex 4. Source: ILO, Trends Econometric Models, October 2014; ILO, Global Wage database, December 2014; ILO Research Department. 2.10 Table ContentsContents
  • 50.
    532. Regional developments:An uneven and uncertain recovery social protection. In fact, the social protection system remains comparatively underdeveloped in the large majority of countries in the region. Social security systems usually cover public and private sector employees only, leaving self-employed, domestic and informal workers without any form of assistance. Indeed, the share of unemployed people covered by unemployment benefit was just above 2 per cent in the Middle East, against the world average of over 10 per cent (ILO, 2014m). Only Algeria, Bahrain, Egypt and Kuwait, and more recently Saudi Arabia, have made unemployment insurance schemes available to jobseekers. Some low- and middle-income countries in the region are also facing challenges in providing adequate health-care services. On average, public health insurance covers only one-third of the population, with large disparities in geographic coverage (ILO and UNDP, 2012). Public resources invested in health-care provision are particularly limited in the Middle East subregion, where they accounted for 2 per cent of GDP in 2013, against a world average of 2.8 per cent. Limited access to public services leads to increasing reliance on private health services, so putting further pressure on the incomes of vulnerable groups. Sub-Saharan Africa Strong economic growth rates are expected to continue despite increasing uncertainties in the outlook Sub-Saharan Africa continues to record strong growth rates, despite infrastructural weaknesses, institutional challenges and limited fiscal space. In 2015 and 2016, GDP growth is expected to reach 5.8 per cent and 6.0 per cent, respectively (IMF, 2014d). Over the longer term, the outlook is boosted by the region’s favourable population structure. Indeed, in 2014, Sub-Saharan Africa is estimated to have had the highest share of the population aged 10–24 of all regions, at approximately 32 per cent, compared with 27 per cent in Latin America and the Caribbean and 25 per cent in Asia and the Pacific (UNFPA, 2014). With declining fertility rates, this means that Sub-Saharan Africa is in the early stages of a demographic transition. Such a transition could prompt a “demographic dividend”, as the productive capacity of the working-age population surges with the additional labour supply. To reach this dividend, however, further invest- ment in human capital and infrastructure, improvements in governance and better social protection systems, in particular providing adequate health care is required to ensure sufficient productive opportunities are available for those entering the labour market. The labour market impact of the Syrian refugee crisis on Jordan and Lebanon By mid-2014 the number of Syrian refugees fleeing to the neighbouring countries of Jordan, Lebanon, Iraq and Turkey had reached almost 3 million. According to the UNHCR, this is the largest movement of refugees since the Second World War. In Lebanon almost one in every four people is a Syrian refugee. The massive inflow of displaced people has put considerable pressure on the already scarce natural resources and fragile public infrastructure. An ILO survey of 2,000 individuals found that Syrian refugees are confronted with dire working conditions. The average monthly income for a Syrian refugee in Lebanon is almost 40 per cent less than the minimum wage. Female Syrian refugees are particularly vulner- able, earning about 40 per cent less than their male counterparts. Informal work dominates Syrian refugee employment, with nine out of ten Syrian refugees employed without a formal contract and 56 per cent working on a seasonal, weekly or daily basis. The ILO assessment in Jordan found that Syrian refugees are likely to be gradually integrated into the job market, but the influx may give rise to greater incidence of irregular employment. Sources: ILO (2014j, 2014k). 2.7 Box ContentsContents
  • 51.
    54 World Employmentand Social Outlook – Trends 2015 However, a number of developments will pose challenges and uncertainties. This includes the human and economic costs of the Ebola virus (see box 2.8), as well as a potential reversal of inward capital flows based on changes in monetary conditions in advanced economies. The immediate effects would increase pressure on external reserves and exchange rates, prompting fiscal adjust- ments that could compromise investment commitments and social spending. The setbacks would weigh heavily on aggregate demand. The region remains heavily dependent on exports of primary commodities to a few emerging markets. Brazil, China and India collectively account for approximately 38.3 per cent of all Sub- Saharan African exports (equivalent to around 8.3 per cent of Sub-Saharan African GDP). Fuels, including oil and coal, make up a large share of exports to these countries, accounting for approx- imately 55.6 per cent of the region’s total export receipts in 2013, whilst non-fuel commodities, such as copper, platinum and gold, accounted for a further 24.8 per cent. Recent drops in commodity prices have already put strain on growth and public finances in countries of the region, most notably in its largest economy, Nigeria, where the fiscal break-even point is estimated to lie above US$100 per barrel of oil whereas as of 31 December the Brent Crude price per barrel stood at US$55, thus requiring significant budgetary adjustments and possible exchange rate depreciation. Meanwhile, the labour market still lacks sufficient productive opportunities Sub-Saharan Africa has the highest labour force participation rate of all regions, estimated at 70.9 per cent – compared with a global average of 63.5 per cent in 2014 (see table 2.11). In addition, un- employment at 7.7 per cent in 2014 is expected to remain stable through to 2018. In terms of youth, the youth unemployment rate is comparatively low in relation to the adult rate, with a youth-to-adult ratio of 1.9 – the lowest of all regions worldwide. Indeed, the youth unemployment rate was 11.8 per cent in 2014 – only East Asia and South Asia had lower rates, at 10.5 per cent and 10.0 per cent, respectively. Furthermore, the unemployment rate is also comparable across genders: the female unemployment rate, at 8.7 per cent, is only marginally higher than the rate for men (6.9 per cent). However, the quality of jobs is of considerable concern, with working poverty and vulnerable employment the highest across all regions. In particular, nearly eight out of ten employed per- sons in Sub-Saharan Africa were in vulnerable forms of employment. Accordingly, the vulner- able employment rate – the share of own-account workers and unpaid family workers in total employment – was estimated at 76.6 per cent in 2014, significantly higher than the global average of 45.3 per cent, and followed closely by South Asia at 75.6 per cent. Female vulnerable employment (typically unpaid family work) was considerably higher than the rate for males, at 84.3 per cent compared with 70.1 per cent for males in 2014. Economic impact of the Ebola outbreak for the most affected countries and the wider region The Ebola virus in West Africa has had a significant toll on the countries most affected, namely Guinea, Liberia and Sierra Leone. By the end of 2014, estimates by the World Health Organization put the human cost at around 8,000 people (WHO, 2014). In addition, the economic costs continue to mount: tourism receipts have plum- meted, fiscal budgets have become stretched and indus- tries such as mining, manufacturing and agriculture are constrained. The World Bank estimates the economic cost to Liberia – the most affected country – to be equiv- alent to a drop of 3.4 percentage points of GDP in 2014 (World Bank, 2014b). For the wider region, the cost of doing business has risen as risk aversion has affected neighbouring countries and movement of workers and business is restricted. As such, the World Bank estimates the economic cost to the three core-affected countries to be around US$359 million in 2014, and expected to be between US$97 million and US$809 million in 2015 in terms of forgone GDP. The social impact is also likely to be long lasting, with higher migration flows, increased poverty incidence and reduced labour market opportunities (World Bank, 2014b). 2.8 Box ContentsContents
  • 52.
    552. Regional developments:An uneven and uncertain recovery Despite progress, inequality and poverty remain endemic Gross National Income (GNI) per capita grew by 15.5 per cent per annum between 2000 and 2012. However, this still equated to a GNI per capita of only US$1,390 in 2012, the lowest across all regions.33 By comparison, GNI per capita was estimated for South Asia at US$1,661 in 2012, South-East Asia at US$3,825 and East Asia at US$6,844. There was significant variation within Sub-Saharan Africa: Eastern Africa exhibited the lowest GNI per capita, at US$622, followed by Western Africa, at US$1,160. The incidence of extreme poverty – measured at the US$1.25-a-day level (PPP) – was recorded at 46.8 per cent in 2011 (latest year with data available) according to the World Bank, down from 56.6 per cent in 1990 and 57.1 per cent in 2002.34 This compares with 24.5 per cent in South Asia (the second highest in 2011) and 7.9 per cent in East Asia and the Pacific (the third highest in 2011). Progress has lagged behind in comparison with other regions, in particular East Asia and the Pacific. Estimates by the African Development Bank Group find that inequality has increased in Africa since the 1980s, but fallen slightly since the 1990s (African Development Bank Group, 2012). The levels of inequality are found to be inversely proportional to GNI per capita, suggesting that the wealthiest benefit disproportionately from output growth. 33   UNCTAD statistics. 34   World Bank PovCalnet (the online tool for poverty measurement developed by the Development Research Group of the World Bank. Available at: http://iresearch.worldbank.org/PovcalNet/index.htm. Economic and social developments in Sub-Saharan Africa, 2009–19 (percentages) 2009 2012 2013 2014 2015 2016 2017 2018 2019 Labour force participation rate 70.4 70.6 70.8 70.9 71.0 71.1 71.2 71.2 71.3 Unemployment rate (total) 7.9 7.9 7.7 7.7 7.7 7.7 7.7 7.7 7.6 Youth unemployment rate 12.5 12.3 11.8 11.8 11.8 11.8 11.8 11.8 11.8 Employment growth 2.8 3.1 3.3 3.1 3.1 3.1 3.1 3.0 3.0 Youth employment growth 2.2 2.7 3.3 2.7 2.7 2.7 2.7 2.7 2.6 Real wage growth 3.2 2.5 0.4 0.3 0.7 1.1 1.4 1.4 1.4 Productivity growth –1.5 0.8 0.4 1.0 1.3 1.7 1.6 1.5 1.5 Note: Regional wage and productivity growth includes estimates and projections for 15 out of 45 countries. For a detailed list of countries covered by the aggregate figures and sources of differences in the estimates in comparison with earlier publications (ILO, 2014b), please refer to Annex 4. Source: ILO, Trends Econometric Models, October 2014; ILO, Global Wage database, December 2014; ILO Research Department. 2.11 Table ContentsContents
  • 53.
  • 54.
    573. Medium-term challengesfor jobs with equity Introduction As shown in Chapter 1, the economic recovery is facing significant challenges and there is concern that the continued weakness of global economic activity may lead to a further widening of the global jobs gap – currently standing at 61 million – caused by the crisis. Behind these trends, important structural factors are shaping the world of work in a profound manner. The purpose of this chapter is to shed light on several of these structural factors and their relation to trends in economic growth. These include: the slowdown in labour supply growth, which is partly associated with population ageing in many parts of the world (section A); major shifts in the demand for different skills (section B); and persistent income inequalities (section C). In order to analyse how these structural factors may shape employment outcomes in the medium term, the chapter identifies periods of growth acceleration and growth slowdown and examines how structural factors interact with such periods.1 From the methodological point of view, growth accelerations and slowdowns are detected by comparing per capita growth rates over extended periods of time.2 A. Shrinking labour supply and population ageing As discussed in Chapter 1, global labour markets are on the brink of a significant slowdown in the growth of labour supply (see box 1.2). Comparing projected average annual labour force growth until 2030 with the growth rates observed over the past two and a half decades, the largest slowdowns are projected to occur in the Middle East and North Africa and in Latin America and the Caribbean. Sub-Saharan Africa is the only region where labour supply will continue to rise as rapidly as before. Globally, the slowdown of annual labour force growth amounts to almost half a percentage point. The share of the economically most active prime-age population in total popu- lation currently stands at 40.8 per cent, having steadily increased from 38.8 per cent in 2000.3 However, this share is projected to reach a peak of 41.0 per cent in 2017 before embarking on a protracted downward trend, reaching 39.7 per cent in 2030. At the same time, the number of older persons continues to rise in almost all regions. The global labour force is estimated to become older by around one and a half months every year. In line with 1   The reason for focusing on growth accelerations and slowdowns is that these dynamics are directly related to changes in unemployment, as illustrated in Chapter 1 (figure 1.11). 2   Comparisons are made with respect to per capita growth over the previous seven years with per-capita growth over the following seven years. A growth acceleration occurs if growth rates increase by at least 2 percentage points to above 3.5 per cent. On the other hand, a country is suffering from a growth slowdown if growth decelerates by more than 2 percentage points, coming down from above 3.5 per cent. These turning point years then mark persistent accelerations and slowdowns of economic growth over the medium term. 3   The prime-age population is defined as population aged 25–54. medium-term challenges for jobs with equity ContentsContents
  • 55.
    58 World Employmentand Social Outlook – Trends 2015 Note: The figure shows the impact of labour supply characteristics on the likelihood of economic growth slowdowns (panel A) and accelerations (panel B). The data points shown correspond to standardized coefficients (orange columns for point estimates and green dots for the upper and lower bounds of the 90 per cent confidence interval), estimated with a pooled probit model described in the Appendix to this chapter. If the confidence interval comprises only values above (below) 0, the variable on the horizontal axis has a significantly positive (negative) impact on the likelihood that an economic growth slowdown (panel A) or acceleration (panel B) will occur. Source: ILO Research Department estimates. 0.15 0.30 –0.15 Standardizedcoefficientestimate –0.30 Panel A. Slowdowns Change in average labour force age Average labour force age Female labour force participation rate Share of prime-age population J J J J J J J J 0 0.30 0.45 0.60 0.75 Standardizedcoefficientestimate –0.15 Panel B. Accelerations Change in average labour force age Average labour force age Female labour force participation rate Share of prime-age population 0.15 J J J J J J J J 0 3.1 Figure Impact of labour supply characteristics on the probability of economic growth slowdowns and accelerations these figures, the share of older workers aged 55 or above in the global labour force expanded from 10.5 per cent in 1990 to a hitherto unseen 14.3 per cent in 2014. By 2030, the number of older workers in the labour force is projected to increase by a further 270 million to almost 750 million workers, which will then correspond to more than 18 per cent of the total labour force. Increased female labour force participation has the potential to offset both shrinking labour supply and labour force ageing. A rise in female labour force participation rates has been observed in many regions, even though female labour force participation at the global level has been on a decline, standing at 50.3 per cent in 2014 compared with 51.9 per cent in 2000. This overall decline has been driven by East Asia and South Asia as well as some developed economies (e.g. the United States) whereas female labour force participation rates have increased in all other regions.4 4   Trends in South Asia are primarily shaped by India, which has seen a rapid decline in female participation rates, partly driven by increased educational attendance and higher household incomes (Kapsos et al., 2014). ContentsContents
  • 56.
    593. Medium-term challengesfor jobs with equity Shrinking prime-age population affects economic growth… Economies with a lower incidence of prime-age population are less likely to experience economic growth accelerations (see figure 3.1), as this typically entails a contraction in the size of the work- force. This can lead to labour shortages and thus constrain economic growth unless older workers remain in the workforce for longer periods. Moreover, for some vacancies, employers might find it more difficult to make a suitable match, forgoing increases in output (ManpowerGroup, 2013). Conversely, an increase in the incidence of prime-age population tends to support economic growth. Medium-term growth prospects are affected by both the average age and the process of ageing of the labour force, albeit in opposite directions. A fast-ageing labour force leads to a higher inci- dence of economic growth slowdowns (figure 3.1). However, economies that have a labour force that is older on average are, if anything, more likely to experience growth accelerations. In other words, rather than the age of the labour force, it is the ageing of the labour force that makes an economy more vulnerable to economic growth slowdowns. Among possible explanations for these differing effects is that economies in which the labour force is rapidly ageing may experience skills mismatches and may have to adapt the workplace to the needs of older workers, which may entail costs. On the other hand, the estimated positive impact of an older workforce might be explained by more effective technology adoption, as older workers’ greater experience may help them to judge more accurately whether a new technology will be beneficial to work processes. In general, older workers may also be more inclined to adopt new technologies, given that techno- logical progress often operates in their favour, allowing them to replace physically demanding tasks with cognitive tasks, for which they may be better equipped than less experienced younger workers (Weinberg, 2002; Gordo and Skirbekk, 2013). Measures such as the promotion of team- work between different generations can also enhance the productivity of enterprises (Göbel and Zwick, forthcoming). Older workers’ participation in the labour force can be encouraged through policies that remove tax and other penalties for work by those receiving pensions and address the effect of future pension accumulation. … while higher female participation is beneficial to economic growth Economies with high female labour force participation rates experience economic growth slow- downs less often, indicating a higher resilience to adverse economic shocks (figure 3.1). With more women in the labour market, an economy makes greater use of its productive potential. Moreover, female labour force participation also presents a powerful anti-poverty device.5 Policies that encourage female labour force participation are, therefore, likely to make economies less vulnerable to economic growth slowdowns. Such policies include measures that facilitate women’s participation by allowing parents to balance work and family responsibilities, such as avail- ability of more flexible working-time arrangements, maternity and parental leave and the provision of affordable childcare facilities. They also include policies that encourage women to join the labour force by improving women’s pay through measures such as minimum wage increases to tackle the over-representation of women in low-wage jobs and anti-discrimination policies that are actively enforced. Other policy areas include tax policy to eliminate tax penalties for the second earner in a household as well as supportive educational policies to improve career options and progression for women. 5   If household incomes are based on the labour incomes from paid work of more than one household member, the risk that households lose all their labour income and slip into poverty as a consequence of an adverse macroeconomic shock is lessened, in particular if different household members work in sectors and occupations that are asymmetrically affected by economic downturns. This in turn lowers the likelihood of adverse household consumption shocks leading to growth slowdowns. ContentsContents
  • 57.
    60 World Employmentand Social Outlook – Trends 2015 B. Changes in occupational patterns As discussed in Chapter 1, the share of low-skilled non-routine manual jobs has declined at the global level, while the share of high-skilled non-routine cognitive jobs has increased. The incidence of traditional occupations (such as shoemaker, blacksmith and carpenter) has been gradually declining in developed economies, while new occupations such as software engineer, business consultant and product marketing manager are emerging. Importantly, medium-skilled routine jobs have slowly but steadily been disappearing over the recent years (see box 3.1).6 These occupational changes have not only shaped employment patterns, but they may have also contributed to the widening of income inequality recorded over the past couple of decades. Earnings data for developed economies illustrate that non-routine cognitive jobs pay considerably higher wages, on average, than routine and non-routine manual occupations.7 An increase in the number of jobs at both the lower and upper ends of the skills ladder at the expense of 6   The classification of jobs into routine, non-routine cognitive and non-routine manual occupations follows Autor et al. (2003) and Jaimovich and Siu (2012) and is based on the International Standard Classifications of Occupations (ISCO). 7   This ranking of occupations in terms of earnings holds, for example, in the European Union and in the United States. In the EU-28, average hourly earnings in non-routine cognitive occupations are €19.36 while routine and non-routine manual occupations respectively pay €10.66 and €10.13 (Eurostat, 2010). In the United States, non-routine cognitive occupations pay on average US$33.81, while earnings in routine and non-routine manual occupations are respectively US$18.78 and US$14.93 (BLS, 2013). The hollowing-out of medium-skilled jobs Technological progress is often cited as the main cause of the hollowing-out of medium-skilled jobs in developed countries. New technologies – such as information and communication technologies (ICT) – have been replacing routine tasks (Autor et al., 2003; Goos and Manning, 2007), which are repetitive tasks characteristic of many medium-skilled cognitive and production activities such as bookkeeping and clerical work. New technologies have raised relative demand for non-routine tasks that depend on high skill levels, such as lawyers, and manual tasks that require little in the way of formal education, such as janitors and security personnel (Autor, 2010). In addition, countries with faster upgrading of ICT such as Finland, the Netherlands, the United Kingdom and the United States also saw the most rapid increase in high- skilled workers and replacement of medium-skilled jobs (Michaels et al., 2010). However, this rapid technological progress does not necessarily reduce the overall demand for labour. It simply shifts the demand to different types of work, including new occupations that might not have existed before (Brynjolfsson and McAfee, 2014). Globalization has also been cited as a cause of job polarization to higher and lower skilled occupations, with possible effects on inequality. Freer international trade has raised the relative cost of production in developed economies by eliminating many tariff wedges. Lower labour cost in developing countries and falling transpor- tation costs make overseas production a more favour- able option. This has led to offshoring of certain parts of the production process, contributing to changes in the employment structure and to the fall in many medi- um-skilled manufacturing jobs in advanced economies. Moreover, this process has led to changing income levels for workers across the occupation and skill spectrum. Although the manufacturing sector has recovered in some advanced economies in the past few years, the jobs that are returning are more often temporary and with lower pay. Former medium-skilled workers who are able to secure new employment often find themselves earning significantly less than before (Ruckelshaus and Leberstein, 2014). Outsourcing also puts direct pressure on the wages of workers in manufacturing, as foreign competition pushes down the price of goods and forces employers to cut cost (Bivens, 2008). Finally, some of those with higher education attainment and skills enjoy higher earnings for jobs in science, engineering and management (Zaccone, 2012), although some college‑educated workers also face wage stagnation in some advanced economies. Policy choices by governments have also been consid- ered as possible causes of changing conditions of work for different types of occupations. This includes trade policies, industry deregulation, minimum wage policies and policies that weaken collective bargaining and union representation (Mishel et al., 2014). Their role is also dis- cussed in the context of widening income gaps, espe- cially the wage disparity between medium-skilled and high-skilled jobs (idem, 2012). 3.1 Box ContentsContents
  • 58.
    613. Medium-term challengesfor jobs with equity medium-skilled routine jobs hence contributes to a rise in income inequality (this is the case even if wages remain unchanged). This finding is in line with the trends in inequality that have been observed in some of the larger advanced economies. In developing countries, changes in living standards and occupational employment shifts are closely associated with each other (see figure 3.2). A larger share of high-skilled non-routine cognitive occupations and, to a lesser extent, of medium-skilled routine jobs can be associated with a lower working poverty rate and a larger middle class. Conversely, a larger share of low-skilled non-routine manual occupations is, on average, associated with a higher prevalence of poverty among workers and a smaller middle class. Hence, in many developing countries, the trends in the occupational employment structure that were discussed in Chapter 1 are likely to have triggered some of the observed improvements in workers’ living conditions, shifting many workers into a prospering and rapidly increasing middle class. The number of routine jobs has decreased not only in advanced economies, but also in a number of developing economies for which data are available (e.g. Malaysia, South Africa and Thailand). A large number of these occupations (e.g. machine operators or assemblers) are in the manufac- turing sector. This has raised some concerns, given that jobs in manufacturing can potentially help workers to escape poverty (see ILO, 2013d; box 3.2). Non-routine cognitive occupations in cities might not be easily accessible to workers without sufficient formal education. These trends are likely to result in higher inequality, since they further raise the barriers preventing poor workers from moving up the economic and social ladder. Addressing these mismatches remains one of the key development challenges in the medium term. Note: This chart shows cross-country-time correlations between shares of employment by occupation and estimated shares of employment by economic class in an unbalanced panel of 667 observations, covering the period 1991–2013. A positive (negative) correlation indicates that a higher share of the considered occupation in total employment is associated with a higher (lower) incidence of employment in the economic class under consideration. All correlations are statistically significant at the 1 per cent level. Source: ILO Research Department calculations based on ILO, Trends Econometric Models, October 2014; Kapsos and Bourmpoula (2013). 0.35 0.70 –0.35 –0.70 0 Non-routine manual occupations Routine occupations Non-routine cognitive occupations Extremely poor Moderately poor Near poor Developing middle class Developed middle class and above J J J J J J J J J J J J J J J 3.2 Figure Correlations between type of occupation and income levels, developing economies, 1991–2013 ContentsContents
  • 59.
    62 World Employmentand Social Outlook – Trends 2015 Is premature de-industrialization a concern? In the history of economic development, manufacturing has often played a key role in job creation, attracting rural agricultural workers into cities, where they were able to earn considerably higher wages. This process of structural transformation has helped many countries move up the income ladder, from low-income to mid- dle-income status, underlining the importance of manu- facturing for economic development (see ILO, 2014l). Export sectors, which are often exposed to more compe- tition, may require enterprises to continuously improve productivity, which can also have a positive impact on economic growth. Relating changes in manufacturing employment shares to medium-term changes in eco- nomic growth suggests that faster declines in the manu- facturing employment share make economies more vulnerable to adverse shocks and cause slowdowns of economic growth (see figure 3.3). Some observers therefore expressed some concern about the phenomenon of premature de-­industrialization of developing countries that has recently been identi- fied (Rodrik, 2013; Subramanian, 2014; Felipe et al., 2014). Countries seem to start de-industrializing earlier on their path of economic development and peak levels of manufacturing output and employment are consid- erably lower than in the past (figure 3.4). With earlier de-­industrialization, low-income countries that currently aim to catch up might face more difficulties in replicating earlier successes in economic development. 3.2 Box Note: The figure shows the impact of manufacturing employment changes on the likelihood of economic growth slowdowns (panel A) and accelerations (panel B). The data points shown correspond to standardized coefficients (orange columns for point estimates and green dots for the upper and lower bounds of the 90 per cent confidence interval), estimated with a pooled probit model described in the Appendix to this chapter. If the confidence interval comprises only values above (below) 0, the variable on the horizontal axis has a significantly positive (negative) impact on the likelihood that an economic growth slowdown (panel A) or acceleration (panel B) will occur. Source: ILO Research Department estimates. Panel A. Slowdowns Panel B. Accelerations –0.06 0 –0.18 Standardizedcoefficientestimate –0.24 –0.12 0 0.08 Standardizedcoefficientestimate –0.16 –0.08 J J J J J J J J Share of manufacturing employment (annual change) Share of manufacturing employment (3-year change) Share of manufacturing employment (annual change) Share of manufacturing employment (3-year change) 3.3 Figure Impact of manufacturing employment changes on the probability of economic growth slowdowns and accelerations ContentsContents
  • 60.
    633. Medium-term challengesfor jobs with equity Is premature de-industrialization a concern? (cont.) A consensus has not yet been established regarding the main driving forces and consequences of prema- ture de-industrialization. One potential explanation is the changing nature of trade, which is now based on complex global supply chains, where most of the value added is generated through the marketing, engineering or design of products rather than the actual manufac- turing process, which leaves less rents to be absorbed by manufacturers. Moreover, rising incomes may have created changes in demand, shifting demand from manufacturing goods to services. However, the extent to which services can take over the role of manufacturing and facilitate the convergence of developing to developed countries is still under scrutiny (Ghani and O’Connell, 2014). A more pessimistic view emphasizes the partial non-tradability of services and the limitations of product- ivity gains in their production (Rodrik, 2014), suggesting that the preservation of manufacturing employment is likely to be an important ingredient for economic devel- opment of low-income countries in the future. Note: This chart shows (i) when different countries are at their peak manufacturing employment share, and (ii) what level this share reaches in that peak year. The chart identifies peak years on the basis of a database that includes estimates and projections of the manufacturing employment share for 1991–2019. It illustrates that, more recently, employment peaks in manufacturing are lower than they used to be in the past. Source: ILO Research Department calculations based on ILO, Trends Econometric Models, October 2014. 20 25 10 5 15 1993 1994 1995 1996 1997 1998 1999 2000 2001 2002 2003 2004 2005 2006 2007 2008 2009 2010 2011 2012 Argentina Bangladesh Bhutan Botswana Chile China Costa Rica Cuba El Salvador Ghana Honduras India Indonesia Madagascar Mexico Nicaragua Pakistan Panama Paraguay Peru Philippines Senegal Sri Lanka Thailand Venezuela J J J J J J J J J J J JJ J J J J J J J J J J J J 20131992 Percentoftotalemployment 3.4 Figure Share of workers in manufacturing employment when manufacturing employment was at its peak, 1992–2013 (percentages) ContentsContents
  • 61.
    64 World Employmentand Social Outlook – Trends 2015 C. Income inequality and economic growth accelerations and slowdowns Income inequalities may have contributed to the ongoing global economic weakening Recent evidence points to a link between income inequality and less persistent economic growth, as described in Chapter 1. Some studies show that lower income inequality is associated with a higher persistence of economic growth or, put differently, longer growth spells (Berg and Ostry, 2011; Ostry et al., 2014). Tackling excessive income inequality can therefore be an important policy response to rekindle economic growth and foster long-term development. Moreover, lower inequality can boost aggregate demand by shifting income to those that have a high propensity to consume, which in turn has the potential to increase economic growth (OECD, 2012; Stiglitz, 2013; Cingano, 2014).8 Lower inequality can also enhance socio-political cohesion, and it may increase support for growth-friendly policies and reduce business uncertainty (Alesina and Perrotti, 1996). 8   Higher inequalities may also hamper economic growth in the longer term. For instance, economies where a large share of the population has no access to credit markets may suffer from under-investment in education and health, which can adversely affect long-term economic growth (Galor and Zeira, 1993; Cingano, 2014). Finally, higher income inequality tends to fuel the rising rates of household leverage that make economies vulnerable to financial crises (Rajan, 2010; Kumhof and Rancière, 2010). Note: The figure shows the impact of inequality (measured with the Gini index that lies between 0 and 100 and increases with rising inequality) on the likelihood of economic growth slowdowns (panel A) and accelerations (panel B). The data points shown correspond to coefficients (orange columns for point estimates and green dots for the upper and lower bounds of the 90 per cent confidence interval), estimated with a pooled probit model described in the Appendix to this chapter. Where applicable, the multiple imputation nature of the inequality data are taken into account in the estimation procedure. If the confidence interval comprises only values above (below) 0, the variable on the horizontal axis has a significantly pos- itive (negative) impact on the likelihood that an economic growth slowdown (panel A) or acceleration (panel B) will occur. Source: ILO Research Department estimates. 0.06 Gini, consumption (World Bank WDI) Gini, net income (SWIID; Solt, 2014) Gini, market income (SWIID; Solt, 2014) 0.02 0.04 –0.02 Coefficientestimate –0.04 Panel A. Slowdowns J J J J J J Gini, consumption (World Bank WDI) Gini, net income (SWIID; Solt, 2014) Gini, market income (SWIID; Solt, 2014) 0.03 Coefficientestimate 0.09 Panel B. Accelerations J J J J J J 0 0 3.5 Figure Impact of income inequality on the probability of economic growth slowdowns and accelerations ContentsContents
  • 62.
    653. Medium-term challengesfor jobs with equity Further analysis presented in this chapter sheds light on how inequalities may contribute to explaining the fragile and uneven economic recovery presently underway. The findings, as illus- trated in figure 3.5, provide evidence on the role of inequality in slowdowns and accelerations of economic growth. The evidence suggests that higher inequality tends to be related with a higher risk of an economic slowdown – this is at least the case when considering inequality of market incomes (i.e. incomes before taxes and transfers). In contrast, lowering inequality may help to coun- teract the economic slowdown currently observed in many economies. A reduction in inequality indeed appears to provide the necessary prerequisites for economies to experience accelerations of economic growth. Since growth slowdowns can be associated with higher unemployment rates and growth accelerations with less unemployment, as shown in Chapter 1, less inequality is also likely to be beneficial to the labour market, preventing a further widening of the jobs gap that has opened up since the onset of the crisis. Concluding remarks This chapter demonstrates the importance of recent developments regarding global trends in labour markets and income inequality for medium-term perspectives of growth and employment. In par- ticular, the chapter presents new evidence on how population ageing, changes in occupational skill demand and increases in personal income inequality have weighed on global economic growth. Therefore, policies to address these changes need to be incorporated into overall strategies to strengthen growth. Previous ILO analyses have examined how this can be achieved, through a com- bination of macroeconomic policies, employment and wage policies (ILO, 2013d, 2014a, 2014b). ContentsContents
  • 63.
    66 World Employmentand Social Outlook – Trends 2015 Appendix Data description and methodology: The relationship between labour market characteristics and economic growth slowdowns and accelerations This chapter relates labour market characteristics to economic growth slowdowns and accelera- tions on the basis of pooled probit regressions. The two alternative dependent variables in these regressions are dummy variables, constructed on the basis of data on GDP per capita growth for 1950–2011 from Penn World Tables 8.0. These dummy variables have a value of 1 in years that can be identified as growth slowdown years or, alternatively, as growth acceleration years, and are 0 otherwise. To identify such slowdowns and accelerations of economic growth, this chapter follows closely the methodology of Eichengreen et al. (2012 and 2013) and defines year t as a growth slowdown year if the following two conditions are fulfilled: gt,t–7 ≥ 0.035 gt,t–7 – gt,t+7 ≥ 0.02 where gt,t–7 is the average annual GDP per capita growth rate between t–7 and t, and gt,t+7 is the average annual GDP per capita growth rate between t and t+7.9 Symmetrically, growth acceleration years are identified similarly as in Hausman et al. (2005), imposing that: gt,t+7 ≥ 0.035 gt,t+7 – gt,t–7 ≥ 0.02 In words, years are identified as growth slowdown (acceleration) years if average per capita growth in the past (coming) seven years was above 3.5 per cent and, in addition, by more than 2 per- centage points higher than average growth in the coming (past) seven years.10 The comparison of the past seven years with the coming seven years takes a medium-term perspective and is likely to avoid an identification of slowdowns and accelerations merely on the basis of business cycle movements. The following two equations are estimated: Pr (SLWt = 1) = Φ (α + βΧt + γ Lt  ) Pr (ACCt = 1) = Φ (α + βΧt + γ Lt  ) where SLWt (ACCt) is the slowdown (acceleration) dummy variable (constructed on the basis of data on economic growth between t – 7 and t + 7). Φ(.) is the normal cumulative distribution function, Χt is a vector of control variables and Lt is a vector of variables measuring a selection of structural labour market characteristics or changes thereof. Control variables are chosen in line with Eichengreen et al. (2012 and 2013). Since the probabilities of a country experiencing an economic growth slowdown or an acceleration are likely to depend non-linearly on the level of economic development (figure A.1), regressions control for GDP per capita and its square. Moreover, regression control for the ratio (and its square) of a country’s GDP per capita to the leading countries’ GDP per capita. Finally, pre-slowdown (pre-acceleration) economic growth is included as a control variable. All these variables are taken from or constructed on the basis of Penn World Tables 8.0. Data on structural labour market characteristics or changes thereof, focused on in this chapter, are from various sources (table A.1). Tables A.2 and A.3 show the full regression results presented in this chapter. There are alternative ways of defining economic growth slowdowns and accelerations (Aiyar et al., 2013; Eichengreen et al., 2012 and 2013). For a series of robustness checks and more extensive results, please see Viegelahn (forthcoming). 9   This implies that growth slowdowns and accelerations are not defined in the seven years at the end of our sample, which drop out of the analysis. 10   Eichengreen et al. (2012 and 2013), in addition, impose that GDP per capita (in 2005 constant PPP US$) should be larger than 10,000, since they intend to identify only middle-income growth traps. ContentsContents
  • 64.
    673. Medium-term challengesfor jobs with equity Note: GDP per capita is in constant 2005 US$ (chained PPP). Source: ILO Research Department calculations. 12 16 4 Panel A. Slowdowns 8 12 16 4 Panel B. Accelerations 8 0–2000 2–4000 4–6000 6–8000 8–10000 10–12000 12–14000 14000 0–2000 2–4000 4–6000 6–8000 8–10000 10–12000 12–14000 14000 0 0 A.1 Figure Share of economic growth slowdowns and accelerations in total number of observations, by income per capita level (percentages) Data sources for labour market variables Variable Data source Prime-age population share UN, World Population Prospects, the 2012 Revision Average labour force age* ILO Research Department calculations based on ILO, EAPEP Database, October 2014 Female labour force participation ILO, EAPEP Database, October 2014 Manufacturing employment share ILO, Trends Econometric Models, October 2014 Gini (World Bank) World Bank, World Development Indicators Gini net (Solt database) Standardized World Income Inequality Database (Solt, 2014) Gini market (Solt database) Standardized World Income Inequality Database (Solt, 2014) *  To calculate a proxy for the average labour force age, labour force aged 65+ is assumed to have an average age of 67.5. Labour force in five-year age group intervals is assumed to have an average age that corresponds to the centre of the five-year interval. A.1 Table ContentsContents
  • 65.
    68 World Employmentand Social Outlook – Trends 2015 Determinants of economic growth slowdowns Dependent variable: SLW (slowdown) (1) Labour supply (2) Sector (3) Sector (4) Income inequality (5) Income inequality (6) Income inequality GDP per capita 0.036 (0.050) –0.111 (0.072) –0.070 (0.085) –0.534* (0.308) 0.077*** (0.029) 0.071*** (0.027) (GDP per capita)^2 –0.000 (0.000) 0.002** (0.001) 0.002 (0.001) 0.028** (0.013) –0.001 (0.001) –0.001 (0.000) Ratio 3.541 (0.077) 12.001*** (4.502) 9.808* (5.550) 68.352*** (24.713) –1.641 (1.538) –1.556 (1.506) Ratio^2 –3.525 (2.788) –12.026*** (4.383) –11.575** (5.361) –200.69*** (74.678) 0.655 (1.516) 0.681 (1.501) Pre-slowdown growth 0.785*** (2.201) 0.609*** (0.055) 0.614*** (0.061) 0.474*** (0.067) 0.515*** (0.024) 0.525*** (0.025) Annual change in average labour force age 0.959** (0.489) Labour force age 0.057 (0.047) Female labour force participation –0.035*** (0.010) Prime-age population share –0.006 (0.030) Manufacturing employment share (annual change) –0.261** (0.121) Manufacturing employment share (change over 3 years) –0.131* (0.076) Gini, consumption (World Bank, WDI) –0.002 (0.022) Gini, net income (SWIID; Solt, 2014) 0.007 (0.007) Gini, market income (SWIID; Solt, 2014) 0.013* (0.007) Pseudo R2 0.57 0.50 0.49 0.53 – – Number of observations 1069 798 638 320 2837 2836 Note: Pooled probit coefficient estimates. Standard errors are reported in brackets. Ratio refers to the ratio of a country’s GDP per capita to the leading country’s GDP per capita. */**/*** denotes significance at the 10/5/1 per cent level. A.2 Table ContentsContents
  • 66.
    693. Medium-term challengesfor jobs with equity Determinants of economic growth accelerations Dependent variable: ACC (acceleration) (1) Labour supply (2) Sector (3) Sector (4) Income inequality (5) Income inequality (6) Income inequality GDP per capita –0.224*** (0.039) 0.023 (0.060) –0.035 (0.069) 0.431** (0.205) –0.134*** (0.027) –0.113*** (0.026) (GDP per capita)^2 0.003*** (0.001) –0.001 (0.001) –0.000 (0.001) –0.031*** (0.011) 0.002** (0.001) 0.001* (0.001) Ratio 7.243*** (2.544) 2.516 (3.363) 6.643 (4.048) –14.042 (10.944) 8.143*** (1.532) 7.794*** (1.507) Ratio^2 –10.601*** (2.881) –7.104* (4.002) –10.711** (4.853) 58.144* (30.656) –11.516*** (2.254) –10.838*** (2.207) Pre-acceleration growth –0.144*** (0.024) –0.150*** (0.029) –0.120*** (0.035) –0.101*** (0.025) –0.083*** (0.011) –0.085*** (0.011) Annual change in average labour force age –0.214 (0.276) Labour force age 0.050* (0.030) Female labour force participation 0.002 (0.005) Prime-age population share 0.143*** (0.020) Manufacturing employment share (annual change) 0.009 (0.075) Manufacturing employment share (change over 3 years) –0.058 (0.049) Gini, consumption (World Bank, WDI) –0.061*** (0.012) Gini, net income (SWIID; Solt, 2014) –0.018*** (0.004) Gini, market income (SWIID; Solt, 2014) –0.018*** (0.004) Pseudo R2 0.24 0.14 0.12 0.15 – – Number of observations 1069 798 638 320 2837 2836 Note: Pooled probit coefficient estimates. Standard errors are reported in brackets. Ratio refers to the ratio of a country’s GDP per capita to the leading country’s GDP per capita. */**/*** denotes significance at the 10/5/1 per cent level. A.3 Table ContentsContents
  • 67.
  • 68.
    71Annex 1. Globaland regional figures Annexes World, pp. 72–73 Developed Economies and European Union, pp. 74–75 Central and South-Eastern Europe (non EU) and CIS, pp. 76–77 East Asia, pp. 78–79 South-East Asia and the Pacific, pp. 80–81 South Asia, pp. 82–83 Latin America and the Caribbean, pp. 84–85 Middle East and North Africa, pp. 86–87 Sub-Saharan Africa, pp. 88–89 In the Employment-growth-by-sector charts the sectors are classified according to ISIC 2008, rev.4: A = Agriculture, forestry, hunting and fishing B = Mining and quarrying C = Manufacturing D and E = Utilities (electricity, gas, etc.) F = Construction G = Wholesale and retail trades, repair of motor vehicles, motorcycles and personal and household goods I = Accommodation and restaurants H and J = Transport, storage and communication K = Financial activities P = Education Q = Health and social work activities O = Public administration and defence, compulsory social security L, M and N = Real estate, business and administrative activities Others 1 Global and regional figures ContentsContents
  • 69.
    72 World Employmentand Social Outlook – Trends 2015 Annexes 1 Global and regional figures World 50 100 150 200 250 20 01 20 00 20 02 20 03 20 04 20 05 20 06 20 07 20 08 20 09 20 10 20 11 20 12 20 13 20 14 20 15 20 16 20 17 20 18 20 19 Total unemployment (millions) 63.5 64.5 65.5 20 01 20 00 20 02 20 03 20 04 20 05 20 06 20 07 20 08 20 09 20 10 20 11 20 12 20 13 20 14 20 15 20 16 20 17 20 18 20 19 Labour force participation rate (%) 1000 2000 3000 4000 20 01 20 00 20 02 20 03 20 04 20 05 20 06 20 07 20 08 20 09 20 10 20 11 20 12 20 13 20 14 20 15 20 16 20 17 20 18 20 19 Total employment (millions) 15 30 45 60 20 01 20 00 20 02 20 03 20 04 20 05 20 06 20 07 20 08 20 09 20 10 20 11 20 12 20 13 20 14 20 01 20 00 20 02 20 03 20 04 20 05 20 06 20 07 20 08 20 09 20 10 20 11 20 12 20 13 20 14 Employment by occupation – Type of task (%) 5.4 5.8 6.2 6.6 20 01 20 00 20 02 20 03 20 04 20 05 20 06 20 07 20 08 20 09 20 10 20 11 20 12 20 13 20 14 20 15 20 16 20 17 20 18 20 19 Total unemployment rate (%) 8.0 12.0 16.0 20 01 20 00 20 02 20 03 20 04 20 05 20 06 20 07 20 08 20 09 20 10 20 11 20 12 20 13 20 14 20 15 20 16 20 17 20 18 20 19 Youth unemployment rate (%) 59.5 60.5 61.5 20 01 20 00 20 02 20 03 20 04 20 05 20 06 20 07 20 08 20 09 20 10 20 11 20 12 20 13 20 14 20 15 20 16 20 17 20 18 20 19 Total employment-to-population ratio (%) 20 40 60 80 Employment by occupation – Skill level (%) Non-routine cognitive occupations Routine occupations Non-routine manual occupations Low skills Medium skills High skills 0 62.5 0 0 5.0 4.0 58.5 0 Estimate Projections Lower and upper boundPoint projection Estimate Projections Lower and upper boundPoint projection Projection Estimate Projections Lower and upper boundPoint projection Estimate Projections Lower bound Point projection Upper bound Estimate Projections Lower bound Point projection Upper bound ContentsContents
  • 70.
    73Annex 1. Globaland regional figures Annexes World Global and regional figures 1 20 01 20 00 20 02 20 03 20 04 20 05 20 06 20 07 20 08 20 09 20 10 20 11 20 12 20 13 Working poor (millions) – US$2/day Working poor as a share of total employment (%) Developing middle class US$4–13/day (millions) Developing middle class as a share of total employment (%) 1 2 3 4 20 01 20 00 20 02 20 03 20 04 20 05 20 06 20 07 20 08 20 09 20 10 20 11 20 12 Real wage growth (%) –25.2 –24.8 –24.4 –24.0 20 01 20 00 20 02 20 03 20 04 20 05 20 06 20 07 20 08 20 09 20 10 20 11 20 12 20 13 20 14 20 15 20 16 20 17 20 18 20 19 Gender gap: difference between male and female employment-to-population ratios (percentage points) 0.35 0.70 1.05 1.40 Social unrest (in percent of all events) (%) 0 1 2 3 4 20 13 5 20 01 20 00 20 02 20 03 20 04 20 05 20 06 20 07 20 08 20 09 20 10 20 11 20 12 20 13 20 14 20 15 20 16 20 17 20 18 20 19 Productivity growth (%) 20 01 20 00 20 02 20 03 20 04 20 05 20 06 20 07 20 08 20 09 20 10 20 11 20 12 20 13 20 14 20 15 20 16 20 17 20 18 20 19 Employment growth by sector (%) 20 14 280 10 560 20 840 30 1120 40 1400 50 20 01 20 00 20 02 20 03 20 04 20 05 20 06 20 07 20 08 20 09 20 10 20 11 20 12 20 13 Vulnerable employment (millions) Share of vulnerable employment (%) 20 14 1340 1360 1380 1400 1420 1460 1440 1480 43.5 47.0 50.5 54.0 40.0 20 01 20 00 20 02 20 03 20 04 20 05 20 06 20 07 20 08 20 09 20 10 20 11 20 12 20 13 20 14 A B C DE F G I HJ K P Q O L, M N Others 0 5 10 0 –25.6 0 –1 0 0 1320 20 01 20 00 20 02 20 03 20 04 20 05 20 06 20 07 20 08 20 09 20 10 20 11 20 12 20 13 20 14 200 7 400 14 600 21 800 28 1000 35 0 0 Working poor US$2/day Working poor as a share of total employment Projection Projection Vulnerable employment Share of vulnerable employment Projection Projection Developing middle class US$4–13/day Developing middle class as a share of total employment Projection Projection Projection Projection Projection ContentsContents
  • 71.
    74 World Employmentand Social Outlook – Trends 2015 Annexes 1 Global and regional figures Developed Economies and European Union 10 20 30 40 50 20 01 20 00 20 02 20 03 20 04 20 05 20 06 20 07 20 08 20 09 20 10 20 11 20 12 20 13 20 14 20 15 20 16 20 17 20 18 20 19 Total unemployment (millions) 59.2 59.6 60.0 60.4 60.8 20 01 20 00 20 02 20 03 20 04 20 05 20 06 20 07 20 08 20 09 20 10 20 11 20 12 20 13 20 14 20 15 20 16 20 17 20 18 20 19 Labour force participation rate (%) 450 480 510 20 01 20 00 20 02 20 03 20 04 20 05 20 06 20 07 20 08 20 09 20 10 20 11 20 12 20 13 20 14 20 15 20 16 20 17 20 18 20 19 Total employment (millions) 15 30 45 20 01 20 00 20 02 20 03 20 04 20 05 20 06 20 07 20 08 20 09 20 10 20 11 20 12 20 13 20 14 20 01 20 00 20 02 20 03 20 04 20 05 20 06 20 07 20 08 20 09 20 10 20 11 20 12 20 13 20 14 Employment by occupation – Type of task (%) 6 7 8 9 20 01 20 00 20 02 20 03 20 04 20 05 20 06 20 07 20 08 20 09 20 10 20 11 20 12 20 13 20 14 20 15 20 16 20 17 20 18 20 19 Total unemployment rate (%) 13 16 19 20 01 20 00 20 02 20 03 20 04 20 05 20 06 20 07 20 08 20 09 20 10 20 11 20 12 20 13 20 14 20 15 20 16 20 17 20 18 20 19 Youth unemployment rate (%) 54.5 55.5 56.5 57.5 20 01 20 00 20 02 20 03 20 04 20 05 20 06 20 07 20 08 20 09 20 10 20 11 20 12 20 13 20 14 20 15 20 16 20 17 20 18 20 19 Total employment-to-population ratio (%) 15 30 45 60 Employment by occupation – Skill level (%) 0 58.8 420 0 5 10 53.5 0 Estimate Projections Lower and upper boundPoint projection Estimate Projections Lower and upper boundPoint projection Estimate Projections Lower and upper boundPoint projection Estimate Projections Lower bound Point projection Upper bound Estimate Projections Lower bound Point projection Upper bound Non-routine cognitive occupations Routine occupations Non-routine manual occupations Low skills Medium skills High skills Projection ContentsContents
  • 72.
    75Annex 1. Globaland regional figures Annexes 1 Developed Economies and European Union Global and regional figures –1 0 1 2 3 4 5 20 01 20 00 20 02 20 03 20 04 20 05 20 06 20 07 20 08 20 09 20 10 20 11 20 12 20 13 20 14 20 15 20 16 20 17 20 18 20 19 Real wage growth (%) –16 –12 –8 20 01 20 00 20 02 20 03 20 04 20 05 20 06 20 07 20 08 20 09 20 10 20 11 20 12 20 13 20 14 20 15 20 16 20 17 20 18 20 19 Gender gap: difference between male and female employment-to-population ratios (percentage points) 0.3 0.6 0.9 1.2 Social unrest (in percent of all events) (%) –1 0 1 2 3 20 01 20 00 20 02 20 03 20 04 20 05 20 06 20 07 20 08 20 09 20 10 20 11 20 12 20 13 20 14 20 15 20 16 20 17 20 18 20 19 Productivity growth (%) 20 01 20 00 20 02 20 03 20 04 20 05 20 06 20 07 20 08 20 09 20 10 20 11 20 12 20 13 20 14 20 15 20 16 20 17 20 18 20 19 Employment growth by sector (%) 20 01 20 00 20 02 20 03 20 04 20 05 20 06 20 07 20 08 20 09 20 10 20 11 20 12 20 13 Vulnerable employment (millions) Share of vulnerable employment (%) 20 14 45 46 47 48 49 50 51 8.9 9.3 9.7 10.1 10.5 11.3 10.9 8.5 20 01 20 00 20 02 20 03 20 04 20 05 20 06 20 07 20 08 20 09 20 10 20 11 20 12 20 13 20 14 A B C DE F G I HJ K P Q O L, M N Others –2 –2 –20 0 20 –20 044 Estimate Projections Lower and upper boundPoint projection Vulnerable employment Share of vulnerable employment Projection Projection Projection Projection Projection ContentsContents
  • 73.
    76 World Employmentand Social Outlook – Trends 2015 Annexes 1 Global and regional figures Central and South-Eastern Europe (non EU) and CIS 5 10 15 20 20 01 20 00 20 02 20 03 20 04 20 05 20 06 20 07 20 08 20 09 20 10 20 11 20 12 20 13 20 14 20 15 20 16 20 17 20 18 20 19 Total unemployment (millions) 57.5 58.5 59.5 60.5 20 01 20 00 20 02 20 03 20 04 20 05 20 06 20 07 20 08 20 09 20 10 20 11 20 12 20 13 20 14 20 15 20 16 20 17 20 18 20 19 Labour force participation rate (%) 140 150 160 170 20 01 20 00 20 02 20 03 20 04 20 05 20 06 20 07 20 08 20 09 20 10 20 11 20 12 20 13 20 14 20 15 20 16 20 17 20 18 20 19 Total employment (millions) 10 20 30 40 50 20 01 20 00 20 02 20 03 20 04 20 05 20 06 20 07 20 08 20 09 20 10 20 11 20 12 20 13 20 14 20 01 20 00 20 02 20 03 20 04 20 05 20 06 20 07 20 08 20 09 20 10 20 11 20 12 20 13 20 14 Employment by occupation – Type of task (%) 7 8 9 10 11 20 01 20 00 20 02 20 03 20 04 20 05 20 06 20 07 20 08 20 09 20 10 20 11 20 12 20 13 20 14 20 15 20 16 20 17 20 18 20 19 Total unemployment rate (%) 17 19 21 20 01 20 00 20 02 20 03 20 04 20 05 20 06 20 07 20 08 20 09 20 10 20 11 20 12 20 13 20 14 20 15 20 16 20 17 20 18 20 19 Youth unemployment rate (%) 15 30 45 60 20 01 20 00 20 02 20 03 20 04 20 05 20 06 20 07 20 08 20 09 20 10 20 11 20 12 20 13 20 14 20 15 20 16 20 17 20 18 20 19 Total employment-to-population ratio (%) 20 40 60 80 Employment by occupation – Skill level (%) 0 56.5 130 0 6 15 0 0 Estimate Projections Lower and upper boundPoint projection Estimate Projections Lower and upper boundPoint projection Estimate Projections Lower and upper boundPoint projection Estimate Projections Lower bound Point projection Upper bound Estimate Projections Lower bound Point projection Upper bound Non-routine cognitive occupations Routine occupations Non-routine manual occupations Low skills Medium skills High skills Projection ContentsContents
  • 74.
    77Annex 1. Globaland regional figures Annexes 1 Central and South-Eastern Europe (non EU) and CIS Global and regional figures 20 01 20 00 20 02 20 03 20 04 20 05 20 06 20 07 20 08 20 09 20 10 20 11 20 12 20 13 Working poor (millions) – US$2/day Working poor as a share of total employment (%) Developing middle class US$4–13/day (millions) Developing middle class as a share of total employment (%) 0 5 10 15 20 20 01 20 00 20 02 20 03 20 04 20 05 20 06 20 07 20 08 20 09 20 10 20 11 20 12 20 13 20 14 20 15 20 16 20 17 20 18 20 19 Real wage growth (%) –18.5 –17.5 20 01 20 00 20 02 20 03 20 04 20 05 20 06 20 07 20 08 20 09 20 10 20 11 20 12 20 13 20 14 20 15 20 16 20 17 20 18 20 19 Gender gap: difference between male and female employment-to-population ratios (percentage points) 0.6 1.2 1.8 Social unrest (in percent of all events) (%) –3 0 3 6 20 01 20 00 20 02 20 03 20 04 20 05 20 06 20 07 20 08 20 09 20 10 20 11 20 12 20 13 20 14 20 15 20 16 20 17 20 18 20 19 Productivity growth (%) 20 01 20 00 20 02 20 03 20 04 20 05 20 06 20 07 20 08 20 09 20 10 20 11 20 12 20 13 20 14 20 15 20 16 20 17 20 18 20 19 Employment growth by sector (%) 20 14 3 2 6 4 9 6 12 8 15 10 18 12 20 01 20 00 20 02 20 03 20 04 20 05 20 06 20 07 20 08 20 09 20 10 20 11 20 12 20 13 Vulnerable employment (millions) Share of vulnerable employment (%) 20 14 30 31 32 33 18.5 20.0 21.5 23.0 17.0 20 01 20 00 20 02 20 03 20 04 20 05 20 06 20 07 20 08 20 09 20 10 20 11 20 12 20 13 20 14 A B C DE F G I HJ K P Q O L, M N Others –16.5 20 01 20 00 20 02 20 03 20 04 20 05 20 06 20 07 20 08 20 09 20 10 20 11 20 12 20 13 20 14 79 54 84 56 89 58 94 60 74 52 9 –5 –19.5 0 –6 0 0 29 Estimate Projections Lower and upper boundPoint projection Working poor US$2/day Working poor as a share of total employment Projection Projection Vulnerable employment Share of vulnerable employment Projection Projection 0 20–20 40 Developing middle class US$4–13/day Developing middle class as a share of total employment Projection Projection Projection Projection Projection ContentsContents
  • 75.
    78 World Employmentand Social Outlook – Trends 2015 Annexes 1 Global and regional figures East Asia 10 20 30 40 50 20 01 20 00 20 02 20 03 20 04 20 05 20 06 20 07 20 08 20 09 20 10 20 11 20 12 20 13 20 14 20 15 20 16 20 17 20 18 20 19 Total unemployment (millions) 69 71 73 75 77 20 01 20 00 20 02 20 03 20 04 20 05 20 06 20 07 20 08 20 09 20 10 20 11 20 12 20 13 20 14 20 15 20 16 20 17 20 18 20 19 Labour force participation rate (%) 140 150 160 170 20 01 20 00 20 02 20 03 20 04 20 05 20 06 20 07 20 08 20 09 20 10 20 11 20 12 20 13 20 14 20 15 20 16 20 17 20 18 20 19 Total employment (millions) 20 40 60 80 20 01 20 00 20 02 20 03 20 04 20 05 20 06 20 07 20 08 20 09 20 10 20 11 20 12 20 13 20 14 20 01 20 00 20 02 20 03 20 04 20 05 20 06 20 07 20 08 20 09 20 10 20 11 20 12 20 13 20 14 Employment by occupation – Type of task (%) 3.5 4.0 4.5 5.0 5.5 20 01 20 00 20 02 20 03 20 04 20 05 20 06 20 07 20 08 20 09 20 10 20 11 20 12 20 13 20 14 20 15 20 16 20 17 20 18 20 19 Total unemployment rate (%) 9 11 13 20 01 20 00 20 02 20 03 20 04 20 05 20 06 20 07 20 08 20 09 20 10 20 11 20 12 20 13 20 14 20 15 20 16 20 17 20 18 20 19 Youth unemployment rate (%) 66 68 70 72 74 20 01 20 00 20 02 20 03 20 04 20 05 20 06 20 07 20 08 20 09 20 10 20 11 20 12 20 13 20 14 20 15 20 16 20 17 20 18 20 19 Total employment-to-population ratio (%) 25 50 75 100 Employment by occupation – Skill level (%) 64 0 67 130 0 3.0 7 0 Estimate Projections Lower and upper boundPoint projection Estimate Projections Lower and upper boundPoint projection Estimate Projections Lower and upper boundPoint projection Estimate Projections Lower bound Point projection Upper bound Estimate Projections Lower bound Point projection Upper bound Non-routine cognitive occupations Routine occupations Non-routine manual occupations Low skills Medium skills High skills Projection ContentsContents
  • 76.
    79Annex 1. Globaland regional figures Annexes 1 East Asia Global and regional figures 20 01 20 00 20 02 20 03 20 04 20 05 20 06 20 07 20 08 20 09 20 10 20 11 20 12 20 13 Working poor (millions) – US$2/day Working poor as a share of total employment (%) Developing middle class US$4–13/day (millions) Developing middle class as a share of total employment (%) 3 6 9 12 20 01 20 00 20 02 20 03 20 04 20 05 20 06 20 07 20 08 20 09 20 10 20 11 20 12 20 13 20 14 20 15 20 16 20 17 20 18 20 19 Real wage growth (%) –13 –12 20 01 20 00 20 02 20 03 20 04 20 05 20 06 20 07 20 08 20 09 20 10 20 11 20 12 20 13 20 14 20 15 20 16 20 17 20 18 20 19 Gender gap: difference between male and female employment-to-population ratios (percentage points) 0.6 1.2 1.8 Social unrest (in percent of all events) (%) 3 6 9 20 01 20 00 20 02 20 03 20 04 20 05 20 06 20 07 20 08 20 09 20 10 20 11 20 12 20 13 20 14 20 15 20 16 20 17 20 18 20 19 Productivity growth (%) 20 01 20 00 20 02 20 03 20 04 20 05 20 06 20 07 20 08 20 09 20 10 20 11 20 12 20 13 20 14 20 15 20 16 20 17 20 18 20 19 Employment growth by sector (%) 20 14 90 12 180 24 270 36 360 48 450 60 20 01 20 00 20 02 20 03 20 04 20 05 20 06 20 07 20 08 20 09 20 10 20 11 20 12 20 13 Vulnerable employment (millions) Share of vulnerable employment (%) 20 14 90 180 270 360 450 12 24 60 48 36 0 20 01 20 00 20 02 20 03 20 04 20 05 20 06 20 07 20 08 20 09 20 10 20 11 20 12 20 13 20 14 A B C DE F G I HJ K P Q O Others 12 –11 20 01 20 00 20 02 20 03 20 04 20 05 20 06 20 07 20 08 20 09 20 10 20 11 20 12 20 13 20 14 90 12 180 24 270 36 360 48 450 60 0 0 0 –14 0 0 0 0 0 Estimate Projections Lower and upper boundPoint projection Working poor US$2/day Working poor as a share of total employment Projection Projection Vulnerable employment Share of vulnerable employment Projection Projection 0 5 10–5 15 Developing middle class US$4–13/day Developing middle class as a share of total employment Projection Projection Projection Projection Projection L, M N ContentsContents
  • 77.
    80 World Employmentand Social Outlook – Trends 2015 1 Global and regional figures South-East Asia and the Pacific 5 10 15 20 20 01 20 00 20 02 20 03 20 04 20 05 20 06 20 07 20 08 20 09 20 10 20 11 20 12 20 13 20 14 20 15 20 16 20 17 20 18 20 19 Total unemployment (millions) 70.0 70.4 70.8 20 01 20 00 20 02 20 03 20 04 20 05 20 06 20 07 20 08 20 09 20 10 20 11 20 12 20 13 20 14 20 15 20 16 20 17 20 18 20 19 Labour force participation rate (%) 100 200 300 400 20 01 20 00 20 02 20 03 20 04 20 05 20 06 20 07 20 08 20 09 20 10 20 11 20 12 20 13 20 14 20 15 20 16 20 17 20 18 20 19 Total employment (millions) 15 30 45 60 20 01 20 00 20 02 20 03 20 04 20 05 20 06 20 07 20 08 20 09 20 10 20 11 20 12 20 13 20 14 20 01 20 00 20 02 20 03 20 04 20 05 20 06 20 07 20 08 20 09 20 10 20 11 20 12 20 13 20 14 Employment by occupation – Type of task (%) 4 5 6 7 20 01 20 00 20 02 20 03 20 04 20 05 20 06 20 07 20 08 20 09 20 10 20 11 20 12 20 13 20 14 20 15 20 16 20 17 20 18 20 19 Total unemployment rate (%) 8 12 16 20 20 01 20 00 20 02 20 03 20 04 20 05 20 06 20 07 20 08 20 09 20 10 20 11 20 12 20 13 20 14 20 15 20 16 20 17 20 18 20 19 Youth unemployment rate (%) 66 67 68 20 01 20 00 20 02 20 03 20 04 20 05 20 06 20 07 20 08 20 09 20 10 20 11 20 12 20 13 20 14 20 15 20 16 20 17 20 18 20 19 Total employment-to-population ratio (%) 20 40 60 80 Employment by occupation – Skill level (%) 65 0 69.6 0 0 3 4 0 Estimate Projections Lower and upper boundPoint projection Estimate Projections Lower and upper boundPoint projection Estimate Projections Lower and upper boundPoint projection Estimate Projections Lower bound Point projection Upper bound Estimate Projections Lower bound Point projection Upper bound Non-routine cognitive occupations Routine occupations Non-routine manual occupations Low skills Medium skills High skills Projection Annexes ContentsContents
  • 78.
    81Annex 1. Globaland regional figures 1 South-East Asia and the Pacific Global and regional figures 20 01 20 00 20 02 20 03 20 04 20 05 20 06 20 07 20 08 20 09 20 10 20 11 20 12 20 13 Working poor (millions) – US$2/day Working poor as a share of total employment (%) Developing middle class US$4–13/day (millions) Developing middle class as a share of total employment (%) 0 2 4 6 8 10 20 01 20 00 20 02 20 03 20 04 20 05 20 06 20 07 20 08 20 09 20 10 20 11 20 12 20 13 20 14 20 15 20 16 20 17 20 18 20 19 Real wage growth (%) –23 –22 20 01 20 00 20 02 20 03 20 04 20 05 20 06 20 07 20 08 20 09 20 10 20 11 20 12 20 13 20 14 20 15 20 16 20 17 20 18 20 19 Gender gap: difference between male and female employment-to-population ratios (percentage points) 0.4 0.8 1.2 1.6 Social unrest (in percent of all events) (%) 0 2 4 20 01 20 00 20 02 20 03 20 04 20 05 20 06 20 07 20 08 20 09 20 10 20 11 20 12 20 13 20 14 20 15 20 16 20 17 20 18 20 19 Productivity growth (%) 20 01 20 00 20 02 20 03 20 04 20 05 20 06 20 07 20 08 20 09 20 10 20 11 20 12 20 13 20 14 20 15 20 16 20 17 20 18 20 19 Employment growth by sector (%) 20 14 30 60 120 150 180 20 01 20 00 20 02 20 03 20 04 20 05 20 06 20 07 20 08 20 09 20 10 20 11 20 12 20 13 Vulnerable employment (millions) Share of vulnerable employment (%) 20 14 145 155 165 175 20 01 20 00 20 02 20 03 20 04 20 05 20 06 20 07 20 08 20 09 20 10 20 11 20 12 20 13 20 14 A B C DE F G I HJ K P Q O L, M N Others 6 –21 17.5 35.0 52.5 70.0 0 –1 –24 0 –1 0 135 20 01 20 00 20 02 20 03 20 04 20 05 20 06 20 07 20 08 20 09 20 10 20 11 20 12 20 13 20 14 30 10 60 20 90 30 120 40 0 0 14 28 42 56 70 0 Working poor US$2/day Working poor as a share of total employment Projection Projection Developing middle class US$4–13/day Developing middle class as a share of total employment Projection Projection Vulnerable employment Share of vulnerable employment Projection Projection 0 10050 Estimate Projections Lower and upper boundPoint projection Projection Projection Projection Annexes ContentsContents
  • 79.
    82 World Employmentand Social Outlook – Trends 2015 1 Global and regional figures South Asia 7 14 21 28 35 20 01 20 00 20 02 20 03 20 04 20 05 20 06 20 07 20 08 20 09 20 10 20 11 20 12 20 13 20 14 20 15 20 16 20 17 20 18 20 19 Total unemployment (millions) 56 58 60 62 20 01 20 00 20 02 20 03 20 04 20 05 20 06 20 07 20 08 20 09 20 10 20 11 20 12 20 13 20 14 20 15 20 16 20 17 20 18 20 19 Labour force participation rate (%) 200 400 600 800 20 01 20 00 20 02 20 03 20 04 20 05 20 06 20 07 20 08 20 09 20 10 20 11 20 12 20 13 20 14 20 15 20 16 20 17 20 18 20 19 Total employment (millions) 15 30 45 60 20 01 20 00 20 02 20 03 20 04 20 05 20 06 20 07 20 08 20 09 20 10 20 11 20 12 20 13 20 14 20 01 20 00 20 02 20 03 20 04 20 05 20 06 20 07 20 08 20 09 20 10 20 11 20 12 20 13 20 14 Employment by occupation – Type of task (%) 3.6 4.2 4.8 20 01 20 00 20 02 20 03 20 04 20 05 20 06 20 07 20 08 20 09 20 10 20 11 20 12 20 13 20 14 20 15 20 16 20 17 20 18 20 19 Total unemployment rate (%) 9.5 10.5 11.5 20 01 20 00 20 02 20 03 20 04 20 05 20 06 20 07 20 08 20 09 20 10 20 11 20 12 20 13 20 14 20 15 20 16 20 17 20 18 20 19 Youth unemployment rate (%) 53 55 57 59 20 01 20 00 20 02 20 03 20 04 20 05 20 06 20 07 20 08 20 09 20 10 20 11 20 12 20 13 20 14 20 15 20 16 20 17 20 18 20 19 Total employment-to-population ratio (%) 10 20 30 40 50 60 70 Employment by occupation – Skill level (%) 51 54 8.5 0 0 0 3.0 0 Estimate Projections Lower and upper boundPoint projection Estimate Projections Lower and upper boundPoint projection Estimate Projections Lower and upper boundPoint projection Estimate Projections Lower bound Point projection Upper bound Estimate Projections Lower bound Point projection Upper bound Non-routine cognitive occupations Routine occupations Non-routine manual occupations Low skills Medium skills High skills Projection Annexes ContentsContents
  • 80.
    83Annex 1. Globaland regional figures 1 South Asia Global and regional figures 20 01 20 00 20 02 20 03 20 04 20 05 20 06 20 07 20 08 20 09 20 10 20 11 20 12 20 13 Working poor (millions) – US$2/day Working poor as a share of total employment (%) Developing middle class US$4–13/day (millions) Developing middle class as a share of total employment (%) 0 2 4 6 8 10 20 01 20 00 20 02 20 03 20 04 20 05 20 06 20 07 20 08 20 09 20 10 20 11 20 12 20 13 20 14 20 15 20 16 20 17 20 18 20 19 Real wage growth (%) –48 –46 –44 20 01 20 00 20 02 20 03 20 04 20 05 20 06 20 07 20 08 20 09 20 10 20 11 20 12 20 13 20 14 20 15 20 16 20 17 20 18 20 19 Gender gap: difference between male and female employment-to-population ratios (percentage points) 0.5 1.0 1.5 2.0 Social unrest (in percent of all events) (%) 3 6 20 01 20 00 20 02 20 03 20 04 20 05 20 06 20 07 20 08 20 09 20 10 20 11 20 12 20 13 20 14 20 15 20 16 20 17 20 18 20 19 Productivity growth (%) 20 01 20 00 20 02 20 03 20 04 20 05 20 06 20 07 20 08 20 09 20 10 20 11 20 12 20 13 20 14 20 15 20 16 20 17 20 18 20 19 Employment growth by sector (%) 20 14 90 180 270 360 450 20 01 20 00 20 02 20 03 20 04 20 05 20 06 20 07 20 08 20 09 20 10 20 11 20 12 20 13 Vulnerable employment (millions) Share of vulnerable employment (%) 20 14 395 430 465 500 20 01 20 00 20 02 20 03 20 04 20 05 20 06 20 07 20 08 20 09 20 10 20 11 20 12 20 13 20 14 A B C DE F G I HJ K P Q O L, M N Others 9 –42 74.5 77.0 79.5 82.0 72.0 –2 –50 0 0 0 360 20 01 20 00 20 02 20 03 20 04 20 05 20 06 20 07 20 08 20 09 20 10 20 11 20 12 20 13 20 14 0.5 3 1.0 6 60 9 80 12 0 0 18 36 54 72 90 0 Working poor US$2/day Working poor as a share of total employment Projection Projection Developing middle class US$4–13/day Developing middle class as a share of total employment Projection Projection Vulnerable employment Share of vulnerable employment Projection Projection –10 10 200 Estimate Projections Lower and upper bound Point projection Projection Projection Projection Annexes ContentsContents
  • 81.
    84 World Employmentand Social Outlook – Trends 2015 1 Global and regional figures Latin America and the Caribbean 6 12 18 24 30 20 01 20 00 20 02 20 03 20 04 20 05 20 06 20 07 20 08 20 09 20 10 20 11 20 12 20 13 20 14 20 15 20 16 20 17 20 18 20 19 Total unemployment (millions) 63.5 64.5 65.5 66.5 20 01 20 00 20 02 20 03 20 04 20 05 20 06 20 07 20 08 20 09 20 10 20 11 20 12 20 13 20 14 20 15 20 16 20 17 20 18 20 19 Labour force participation rate (%) 70 140 210 280 350 20 01 20 00 20 02 20 03 20 04 20 05 20 06 20 07 20 08 20 09 20 10 20 11 20 12 20 13 20 14 20 15 20 16 20 17 20 18 20 19 Total employment (millions) 15 30 45 60 20 01 20 00 20 02 20 03 20 04 20 05 20 06 20 07 20 08 20 09 20 10 20 11 20 12 20 13 20 14 20 01 20 00 20 02 20 03 20 04 20 05 20 06 20 07 20 08 20 09 20 10 20 11 20 12 20 13 20 14 Employment by occupation – Type of task (%) 6.5 8.0 9.5 20 01 20 00 20 02 20 03 20 04 20 05 20 06 20 07 20 08 20 09 20 10 20 11 20 12 20 13 20 14 20 15 20 16 20 17 20 18 20 19 Total unemployment rate (%) 12 14 16 18 20 01 20 00 20 02 20 03 20 04 20 05 20 06 20 07 20 08 20 09 20 10 20 11 20 12 20 13 20 14 20 15 20 16 20 17 20 18 20 19 Youth unemployment rate (%) 20 10 40 60 30 50 70 Employment by occupation – Skill level (%) 0 62.5 0 0 5.0 10 0 Estimate Projections Lower and upper boundPoint projection 59 61 63 20 01 20 00 20 02 20 03 20 04 20 05 20 06 20 07 20 08 20 09 20 10 20 11 20 12 20 13 20 14 20 15 20 16 20 17 20 18 20 19 Total employment-to-population ratio (%) 57 Estimate Projections Lower and upper boundPoint projection Estimate Projections Lower and upper boundPoint projection Estimate Projections Lower bound Point projection Upper bound Estimate Projections Lower bound Point projection Upper bound Non-routine cognitive occupations Routine occupations Non-routine manual occupations Low skills Medium skills High skills Projection Annexes ContentsContents
  • 82.
    85Annex 1. Globaland regional figures 1 Latin America and the Caribbean Global and regional figures 20 01 20 00 20 02 20 03 20 04 20 05 20 06 20 07 20 08 20 09 20 10 20 11 20 12 20 13 Working poor (millions) – US$2/day Working poor as a share of total employment (%) Developing middle class US$4–13/day (millions) Developing middle class as a share of total employment (%) 0.4 0.8 1.2 1.6 Social unrest (in percent of all events) (%) 20 14 10 20 30 40 20 01 20 00 20 02 20 03 20 04 20 05 20 06 20 07 20 08 20 09 20 10 20 11 20 12 20 13 Vulnerable employment (millions) Share of vulnerable employment (%) 20 14 70 75 80 85 90 20 01 20 00 20 02 20 03 20 04 20 05 20 06 20 07 20 08 20 09 20 10 20 11 20 12 20 13 20 14 30.6 32.2 33.8 35.4 37.0 29.0 0 0 65 20 01 20 00 20 02 20 03 20 04 20 05 20 06 20 07 20 08 20 09 20 10 20 11 20 12 20 13 20 14 40 43 80 46 49120 160 52 0 40 4.5 9.0 13.5 18.0 0 Working poor US$2/day Working poor as a share of total employment Projection Projection Developing middle class US$4–13/day Developing middle class as a share of total employment Projection Projection Vulnerable employment Share of vulnerable employment Projection Projection –30 –26 20 01 20 00 20 02 20 03 20 04 20 05 20 06 20 07 20 08 20 09 20 10 20 11 20 12 20 13 20 14 20 15 20 16 20 17 20 18 20 19 Gender gap: difference between male and female employment-to-population ratios (percentage points) 20 01 20 00 20 02 20 03 20 04 20 05 20 06 20 07 20 08 20 09 20 10 20 11 20 12 20 13 20 14 20 15 20 16 20 17 20 18 20 19 Employment growth by sector (%) A B C DE F G I HJ K P Q O L, M N Others –22 –34 −20−30 −10 0 10 20 30 Projection Projection Annexes ContentsContents
  • 83.
    86 World Employmentand Social Outlook – Trends 2015 1 Global and regional figures Middle East and North Africa 5 10 15 20 25 20 01 20 00 20 02 20 03 20 04 20 05 20 06 20 07 20 08 20 09 20 10 20 11 20 12 20 13 20 14 20 15 20 16 20 17 20 18 20 19 Total unemployment (millions) 46.5 47.5 48.5 49.5 50.5 20 01 20 00 20 02 20 03 20 04 20 05 20 06 20 07 20 08 20 09 20 10 20 11 20 12 20 13 20 14 20 15 20 16 20 17 20 18 20 19 Labour force participation rate (%) 40 80 120 160 20 01 20 00 20 02 20 03 20 04 20 05 20 06 20 07 20 08 20 09 20 10 20 11 20 12 20 13 20 14 20 15 20 16 20 17 20 18 20 19 Total employment (millions) 10 20 30 40 50 20 01 20 00 20 02 20 03 20 04 20 05 20 06 20 07 20 08 20 09 20 10 20 11 20 12 20 13 20 14 20 01 20 00 20 02 20 03 20 04 20 05 20 06 20 07 20 08 20 09 20 10 20 11 20 12 20 13 20 14 Employment by occupation – Type of task (%) 3.5 4.0 4.5 5.0 5.5 20 01 20 00 20 02 20 03 20 04 20 05 20 06 20 07 20 08 20 09 20 10 20 11 20 12 20 13 20 14 20 15 20 16 20 17 20 18 20 19 Total unemployment rate (%) 26 30 34 20 01 20 00 20 02 20 03 20 04 20 05 20 06 20 07 20 08 20 09 20 10 20 11 20 12 20 13 20 14 20 15 20 16 20 17 20 18 20 19 Youth unemployment rate (%) 41 43 45 20 01 20 00 20 02 20 03 20 04 20 05 20 06 20 07 20 08 20 09 20 10 20 11 20 12 20 13 20 14 20 15 20 16 20 17 20 18 20 19 Total employment-to-population ratio (%) 20 40 60 80 Employment by occupation – Skill level (%) 39 0 45.5 0 0 3.0 22 0 Estimate Projections Lower and upper boundPoint projection Estimate Projections Lower and upper boundPoint projection Estimate Projections Lower and upper boundPoint projection Estimate Projections Lower bound Point projection Upper bound Estimate Projections Lower bound Point projection Upper bound Non-routine cognitive occupations Routine occupations Non-routine manual occupations Low skills Medium skills High skills Projection Annexes ContentsContents
  • 84.
    87Annex 1. Globaland regional figures 1 Middle East and North Africa Global and regional figures 20 01 20 00 20 02 20 03 20 04 20 05 20 06 20 07 20 08 20 09 20 10 20 11 20 12 20 13 Working poor (millions) – US$2/day Working poor as a share of total employment (%) Developing middle class US$4–13/day (millions) Developing middle class as a share of total employment (%) 0 3 6 20 01 20 00 20 02 20 03 20 04 20 05 20 06 20 07 20 08 20 09 20 10 20 11 20 12 20 13 20 14 20 15 20 16 20 17 20 18 20 19 Real wage growth (%) –50.6 20 01 20 00 20 02 20 03 20 04 20 05 20 06 20 07 20 08 20 09 20 10 20 11 20 12 20 13 20 14 20 15 20 16 20 17 20 18 20 19 Gender gap: difference between male and female employment-to-population ratios (percentage points) 1 2 3 Social unrest (in percent of all events) (%) 0 2 20 01 20 00 20 02 20 03 20 04 20 05 20 06 20 07 20 08 20 09 20 10 20 11 20 12 20 13 20 14 20 15 20 16 20 17 20 18 20 19 Productivity growth (%) 20 01 20 00 20 02 20 03 20 04 20 05 20 06 20 07 20 08 20 09 20 10 20 11 20 12 20 13 20 14 20 15 20 16 20 17 20 18 20 19 Employment growth by sector (%) 20 14 13 14 15 20 01 20 00 20 02 20 03 20 04 20 05 20 06 20 07 20 08 20 09 20 10 20 11 20 12 20 13 Vulnerable employment (millions) Share of vulnerable employment (%) 20 14 15 30 45 20 01 20 00 20 02 20 03 20 04 20 05 20 06 20 07 20 08 20 09 20 10 20 11 20 12 20 13 20 14 A B C DE F G I HJ K P Q O L, M N Others –49.6 4 –3 –51.6 0 –2 12 0 15 30 45 0 15 30 45 0 20 01 20 00 20 02 20 03 20 04 20 05 20 06 20 07 20 08 20 09 20 10 20 11 20 12 20 13 20 14 15 34.5 30 37.0 39.545 60 42.0 0 32.0 6 12 18 0 Working poor US$2/day Working poor as a share of total employment Projection Projection Developing middle class US$4–13/day Developing middle class as a share of total employment Projection Projection Vulnerable employment Share of vulnerable employment Projection Projection 0 5 10−5 Estimate Projections Lower and upper boundPoint projection Projection Projection Projection Annexes ContentsContents
  • 85.
    88 World Employmentand Social Outlook – Trends 2015 1 Global and regional figures Sub-Saharan Africa 10 20 30 40 20 01 20 00 20 02 20 03 20 04 20 05 20 06 20 07 20 08 20 09 20 10 20 11 20 12 20 13 20 14 20 15 20 16 20 17 20 18 20 19 Total unemployment (millions) 69.5 70.0 70.5 71.0 71.5 20 01 20 00 20 02 20 03 20 04 20 05 20 06 20 07 20 08 20 09 20 10 20 11 20 12 20 13 20 14 20 15 20 16 20 17 20 18 20 19 Labour force participation rate (%) 150 300 450 20 01 20 00 20 02 20 03 20 04 20 05 20 06 20 07 20 08 20 09 20 10 20 11 20 12 20 13 20 14 20 15 20 16 20 17 20 18 20 19 Total employment (millions) 20 40 60 80 20 01 20 00 20 02 20 03 20 04 20 05 20 06 20 07 20 08 20 09 20 10 20 11 20 12 20 13 20 14 20 01 20 00 20 02 20 03 20 04 20 05 20 06 20 07 20 08 20 09 20 10 20 11 20 12 20 13 20 14 Employment by occupation – Type of task (%) 3 4 5 20 01 20 00 20 02 20 03 20 04 20 05 20 06 20 07 20 08 20 09 20 10 20 11 20 12 20 13 20 14 20 15 20 16 20 17 20 18 20 19 Total unemployment rate (%) 11 12 13 14 20 01 20 00 20 02 20 03 20 04 20 05 20 06 20 07 20 08 20 09 20 10 20 11 20 12 20 13 20 14 20 15 20 16 20 17 20 18 20 19 Youth unemployment rate (%) 63.5 64.5 64.5 66.5 20 01 20 00 20 02 20 03 20 04 20 05 20 06 20 07 20 08 20 09 20 10 20 11 20 12 20 13 20 14 20 15 20 16 20 17 20 18 20 19 Total employment-to-population ratio (%) 30 60 90 Employment by occupation – Skill level (%) 62.5 20 69.0 0 0 10 0 Estimate Projections Lower and upper boundPoint projection Estimate Projections Lower and upper boundPoint projection Estimate Projections Lower and upper boundPoint projection Estimate Projections Lower bound Point projection Upper bound Estimate Projections Lower bound Point projection Upper bound Non-routine cognitive occupations Routine occupations Non-routine manual occupations Low skills Medium skills High skills Projection Annexes ContentsContents
  • 86.
    89Annex 1. Globaland regional figures 1 Sub-Saharan Africa Global and regional figures 20 01 20 00 20 02 20 03 20 04 20 05 20 06 20 07 20 08 20 09 20 10 20 11 20 12 20 13 Working poor (millions) – US$2/day Working poor as a share of total employment (%) Developing middle class US$4–13/day (millions) Developing middle class as a share of total employment (%) 0 –2 2 4 6 8 10 20 01 20 00 20 02 20 03 20 04 20 05 20 06 20 07 20 08 20 09 20 10 20 11 20 12 20 13 20 14 20 15 20 16 20 17 20 18 20 19 Real wage growth (%) –14 –13 –12 –11 20 01 20 00 20 02 20 03 20 04 20 05 20 06 20 07 20 08 20 09 20 10 20 11 20 12 20 13 20 14 20 15 20 16 20 17 20 18 20 19 Gender gap: difference between male and female employment-to-population ratios (percentage points) 0.4 0.8 1.2 Social unrest (in percent of all events) (%) 0 2 20 01 20 00 20 02 20 03 20 04 20 05 20 06 20 07 20 08 20 09 20 10 20 11 20 12 20 13 20 14 20 15 20 16 20 17 20 18 20 19 Productivity growth (%) 20 01 20 00 20 02 20 03 20 04 20 05 20 06 20 07 20 08 20 09 20 10 20 11 20 12 20 13 20 14 20 15 20 16 20 17 20 18 20 19 Employment growth by sector (%) 20 14 180 200 220 20 01 20 00 20 02 20 03 20 04 20 05 20 06 20 07 20 08 20 09 20 10 20 11 20 12 20 13 Vulnerable employment (millions) Share of vulnerable employment (%) 20 14 100 200 300 20 01 20 00 20 02 20 03 20 04 20 05 20 06 20 07 20 08 20 09 20 10 20 11 20 12 20 13 20 14 A B C DE F G I HJ K P Q O L, M N Others –10 77 79 81 75 4 160 0 –4 –15 0 –2 20 01 20 00 20 02 20 03 20 04 20 05 20 06 20 07 20 08 20 09 20 10 20 11 20 12 20 13 20 14 10 20 30 40 50 0 30 60 90 0 2.8 5.6 8.4 11.2 14.0 0 Estimate Projections Lower and upper boundPoint projection Working poor US$2/day Working poor as a share of total employment Projection Projection Developing middle class US$4–13/day Developing middle class as a share of total employment Projection Projection Vulnerable employment Share of vulnerable employment Projection Projection 0 5 10 15 Projection Projection Projection Annexes ContentsContents
  • 87.
    90 World Employmentand Social Outlook – Trends 2015 Annexes 2 Labour market estimates and projections The source of all global and regional labour market estimates in this World Employment and Social Outlook report is ILO, Trends econometric models, October 2014. The ILO Research Department has designed and actively maintains econometric models which are used to produce estimates of labour market indicators in the countries and years for which country-reported data are unavailable. These give the ILO the ability to produce and analyse global and regional estimates of key labour market indicators and the related trends. The Global Employment Trends Model (GET Model) is used to produce estimates and projections – disaggregated by age and sex as appropriate – of unemployment, employment and status in employment. The output of the model is a complete matrix of data for 178 countries. The country-level data can then be aggregated to produce regional and global estimates of labour market indicators such as the unemployment rate, the employment-to-population ratio, status in employment shares and vulnerable employment. Prior to running the GET Model, labour market information specialists in the Research Department, in cooperation with specialists in ILO field offices, evaluate existing country-reported data and select only those observations deemed sufficiently comparable across countries – with criteria including: (1) type of data source; (2) geographic coverage; and (3) age group coverage. With regard to the first criterion, in order to be included in the model, data must be derived from either a labour force survey or population census. National labour force surveys are typically similar across countries, and the data derived from these surveys are more comparable than data obtained from other sources. A strict preference is therefore given to labour force survey-based data in the selection process. Yet many developing countries without adequate resources to carry out a labour force survey do report labour market information based on population censuses. Consequently, due to the need to balance the competing goals of data comparability and data coverage, some population census-based data are included in the model. The second criterion is that only nationally representative (i.e. not prohibitively geographically limited) labour market indicators are included. Observations corresponding to only urban or only rural areas are not included, as large differences typically exist between rural and urban labour markets, and using only rural or urban data would not be consistent with benchmark files such as GDP. The third criterion is that the age groups covered by the observed data must be sufficiently comparable across countries. Countries report labour market information for a variety of age groups and the age group selected can have an influence on the observed value of a given labour market indicator. Apart from country-reported labour market information, the GET Model uses the following benchmark files: United Nations World Population Prospects, 2012 revision for population estimates and projections. ILO Economically Active Population, Estimates and Projections (EAPEP) for labour force estimates and projections. IMF/World Bank data on GDP (PPP, per capita GDP and GDP growth rates) from the World Development Indicators and the World Economic Outlook October 2014 database. World Bank poverty estimates from the PovcalNet database. ContentsContents
  • 88.
    91Annex 2. Labourmarket estimates and projections Annexes 2 Labour market estimates and projections Estimates of labour market indicators The GET Model produces estimates of unemployment rates to fill in missing values in the countries and years for which country-reported data are unavailable. Multivariate regressions are run separately for different regions in the world in which unemployment rates broken down by age and sex (youth male, youth female, adult male, adult female) are regressed on GDP growth rates. Weights are used in the regressions to correct for biases that may result from the fact that countries that report unemployment rates tend to be different (in statistically important respects) than countries that do not report unemployment rates.1 For 2014, a preliminary estimate is produced, using quarterly and monthly information available up to the time of production of this World Employment and Social Outlook report (October 2014). The model also estimates employment by status using similar techniques to impute missing values at the country level. In addition to GDP growth rate, the variables used as explanatory variables are the value added shares of the three broad sectors in GDP, per capita GDP and the share of people living in urban areas. Additional econometric models are used to produce global and regional estimates of working poverty and employment by economic class (Kapsos and Bourmpoula, 2013). Projections of labour market indicators Unemployment rate projections are obtained using the historical relationship between unemployment rates and GDP growth during the worst crisis/downturn period for each country between 1991 and 2005, and during the corresponding recovery period.2 This was done through the inclusion of interaction terms of crisis and recovery dummy variables with GDP growth in fixed effects panel regressions.3 Specifically, the logistically transformed unemployment rate was regressed on a set of covariates, including the lagged unemployment rate, the GDP growth rate, the lagged GDP growth rate and a set of covariates consisting of the interaction of the crisis dummy, and of the interaction of the recovery-year dummy with each of the other variables. Separate panel regressions were run across three different groupings of countries, based on: (1) geographic proximity and economic/institutional similarities; (2) income levels;4 (3) level of export dependence (measured as exports as a percentage of GDP).5 The rationale behind these groupings is the following. Countries within the same geographic area or with similar eco- nomic/institutional characteristics are likely to be similarly affected by the crisis and have similar mechanisms to atten- uate the crisis impact on their labour markets. Furthermore, because countries within geographic areas often have strong WTO and financial linkages, the crisis is likely to spill over from one economy to its neighbour (e.g. Canada’s economy and labour market developments are intricately linked to developments in the United States). Countries of similar income levels are also likely to have more similar labour market institutions (e.g. social protection measures) and similar capacities to implement fiscal stimulus and other policies to counter the crisis impact. Finally, as the decline in exports was the primary crisis transmission channel from developed to developing economies, countries were grouped according to their level of exposure to this channel, as measured by their exports as a percentage of GDP. The impact of the crisis on labour markets through the export channel also depends on the type of exports (the affected sectors of the economy), the share of domestic value added in exports and the relative importance of domestic consumption 1   For instance, if simple averages of unemployment rates in reporting countries in a given region were used to estimate the unemployment rate in that region, and the countries that do not report unemployment rates are different with respect to unemployment rates than reporting countries, without such a correction mechanism, the resulting estimated regional unemployment rate would be biased. The “weighted least squares” approach adopted in the GET Model corrects for this potential problem. 2   The crisis period comprises the span between the year in which a country experienced the largest drop in GDP growth, and the “turning point year” when growth reached its lowest level following the crisis, before starting to climb back to its pre-crisis level. The recovery period comprises the years between the “turning point year” and the year when growth has returned to its pre-crisis level. 3   In order to project unemployment during the current recovery period, the crisis-year and recovery-year dummies were adjusted based on the following definition: a country was considered “currently in crisis” if the drop in GDP growth after 2007 was larger than 75 per cent of the absolute value of the standard deviation of GDP growth over the 1991–2008 period and/or larger than 3 percentage points. 4   The income groups correspond to the World Bank income group classification of four income categories, based on countries’ 2008 GNI per capita (calculated using the Atlas method): low-income countries, US$975 or less; lower middle-income countries, US$976–US$3,855; upper middle-income countries, US$3,856–US$11,905; and high-income countries, US$11,906 or more. 5   The export dependence-based groups are: highest exports (exports ≥70 per cent of GDP); high exports (exports 70 per cent but ≥50 per cent of GDP); medium exports (exports 50 per cent but ≥20 per cent of GDP); and low exports (exports 20 per cent of GDP). ContentsContents
  • 89.
    92 World Employmentand Social Outlook – Trends 2015 Annexes Labour market estimates and projections 2 (for instance, countries such as India and Indonesia with a large domestic market were less vulnerable than countries such as Singapore and Thailand). These characteristics are controlled for by using fixed-effects in the regressions. In addition to the panel regressions, country-level regressions were run for countries with sufficient data. The ordinary least squares country-level regressions included the same variables as the panel regressions. To take into account the uncertainty around GDP prospects as well as the complexity of capturing the relationship between GDP and unemployment rate for all the countries, a variety of 10 (similar) multilevel mixed-effects linear regressions (varying-intercept and varying-coefficient models) are utilized. The main component that changes across these 10 versions is the lag structure of the independent variables. The potential superiority of these models lies in the fact that not only is the panel structure is fully exploited (e.g. increased degrees of freedom), but also it is possible to estimate the coefficients specifically for each unit (country), taking into account unobserved heterogeneity at the cluster-level and correcting for the random effects’ approach caveat that the independent variables are not correlated with the random effects term. Overall, the final projection was generated as a simple average of the estimates obtained from the three group panel regressions and also, for countries with sufficient data, the country-level regressions. For a selection of countries (44 out of 178), an average of another set of forecast combination was made according to judgemental examination in order to represent more realistically the recent trends observed in each country’s economic forecast. Short-term projection model For G7 countries, the preliminary unemployment estimate for 2014 and the projection for 2015 are based on results from country-specific short-term projection models. The ILO maintains a database on monthly and quarterly un- employment flows that contains information on inflow and outflow rates into and out of unemployment, estimated on the basis of unemployment by duration, following the methodologies proposed by Shimer (2012) and Elsby et al. (2013). Seven different models are specified that either project the unemployment rate directly or both inflow and outflow rates, using ARIMA, VAR, VARX and combined forecast techniques. The model relies on several explanatory variables including hiring uncertainty (Ernst and Viegelahn, 2014), policy uncertainty (Baker et al., 2013) and GDP growth. For the final forecast, projections of one of the seven models are chosen for each country, based on results from a pseudo-out-of-sample analysis. ContentsContents
  • 90.
    93Annex 3. Occupationaland sectoral employment estimates and projections Annexes Occupational and sectoral employment estimates and projections 3 Besides other labour market indicators, this report also presents new estimates and projections of detailed sectoral and occupational employment shares, total and by sex. The principal database used for the sectoral and occupational employment shares is the most recent version of the ILO Key Indicators of the Labour Market (KILM), 8th edition.1 The KILM is a wide-ranging database of 18 labour market indicators from 1980 to the latest available year for about 226 countries. Employment by sector captures the distribution of the employed population across sectors of economic activity. Employment by occupation is an indicator that attempts to categorize the employed population into groups of jobs with similar tasks and duties that are hierarchically organized in a number of levels. The main source of additional data is ILOSTAT, ILO Short-Term Indicators (STI). For India, tabulations based on data from the National Sample Survey Organization (NSSO) survey on the Employment and Unemployment Situation in India were used. Data based on the most recent labour force survey conducted in Bangladesh were also considered. The groups for occupations are selected in order to be representative of broad levels of skills as defined by educational level required and by type of skills required. The broad occupational categories (skills) are chosen according to the broad level of educational attainment required based on the International Standard Classification of Education (ISCED); primary, secondary and tertiary educational level. The broad occupational categories (routine) are defined, following Jaimovich and Siu (2012) and Autor et al. (2003). To produce estimates and projections, data on sectoral value added shares of GDP are taken from the United Nations Statistics Division – System of National Accounts – National Accounts Main Aggregates (UNSD SNAAMA) database. The Economist Intelligence Unit (EIU) database was used to supplement the data from the above sources and also to assist in projecting the value added shares by sector. For only one country (i.e. Taiwan, China) the entire series from EIU was utilized because there were data for this country neither in World Bank WDI nor in UNSD SNAAMA. The demo- graphic variables used in the model come from the United Nations World Population Prospects (UN WPP), the United Nations World Urbanization Prospects (UN WUP) and the ILO Economically Active Population Estimates and Projections (ILO EAPEP). Other sources of data for explanatory variables are the IMF World Economic Outlook database and the World Bank World Development Indicators database. For one variable, the IMF International Financial Statistics was used. The explanatory variables that are considered include: GDP per capita, output per worker, investment, exports of goods, imports of goods, general government final consumption expenditure, gross capital formation, trade in services, real effective exchange rate index, value added by sector, ratio of female-to-male labour force aged 30 to 64 years old, share of urban population in total population, share of population aged less than 15 years old in total population, share of population aged less than 15 years old and population aged above 65 years old in total population, share of wage and salary workers in total employment. Estimates and projections are produced on the basis of the methodology that proceeds in three steps: (1) run regressions with a set of different combinations of the potential explanatory variables; (2) select the specifications for which the goodness-of-fit is best; and (3) run a bootstrap procedure on those specifications and calculate for each geographical region and each category of employment (i.e. sector and broad occupation) the RSME, based on this procedure. At this point, the RMSE is produced not only for these specifications but also for the average prediction among all the specifications selected, the average among the three best and among the five best performers. Then, for each sector or occupation and for each region, the specification with the lowest RMSE is selected to be used for the final estimates. Finally, some adjustments are made to the estimates in order to make sure that the sum of shares across all categories equals 100 and that the sum of men and women working in a specific sectoral or occupational category equals the number of the estimate for both sexes. 1   KILM 8th edition is available online at: www.ilo.org/kilm. ContentsContents
  • 91.
    94 World Employmentand Social Outlook – Trends 2015 Annexes Real wage growth estimates and projection 4 This report includes regional wage estimates and projections for 1999–2019, which are constructed on the basis of a large set of econometric models that exploit the relationship between wages and different macroeconomic and labour market variables. The underlying wage data are taken from the ILO’s Global Wage Database1 for 1999–2013 and from the ILO Key Indicators of the Labour Market (KILM), 8th edition for 1995–1998. Data for explanatory variables come from the IMF World Economic Outlook, October 2014 and ILO Trends Econometric Models, October 2014. The regional estimates and projections cover 107 countries for 1995–2013. The different models that are specified make use of panel estimation techniques and differ with respect to various dimensions: the estimation methodology; the form in which wages enter the models as dependent variable (as real wage growth, difference between real wage and productivity growth, or logarithm of the real wage); the set of explanatory variables; the way in which different countries are grouped together. The models consider a wide range of explanatory variables such as investment, labour productivity, proxies for the reservation wage, sectoral and occupational employment shares and demographic variables, allowing for a variety of factors that are (potentially) related to real wage trends. In addition, some specifications account for the fact that the relationship of wages with these variables can change, depending on the position within the business cycle. Regressions are run on the whole panel dataset as well as on different groups of countries. Country groupings are based on differ- ences in minimum wage legislation, minimum-wage setting mechanisms, geographic proximity and the distribution of unemployment over different durations and changes thereof. In total, more than 1,000 models are available for testing. In a first step, this number is reduced to about 600, based on a pre-selection of models that excludes those with the smallest explanatory power. As a second step, a detailed analysis that evaluates the pseudo-out-of-sample performance of the different wage projections is conducted to create country-specific performance rankings of the different models. The final projection for each country then corresponds to the simple average of the projections produced by the top-10 best performing models. The regional average wage growth is calculated by taking into account each country’s weight in the total regional wage bill, following the methodology used in the Global Wage Report (ILO, 2014b). The regional wage growth aggregates cover 107 out of the 178 countries that are included in this report (see Annex 5; ILO, 2014b). The following countries are included into the regional wage growth figures: Albania, Algeria, Armenia, Australia, Austria, Azerbaijan, Bahrain, Bangladesh, Belarus, Belgium, Plurinational State of Bolivia, Botswana, Brazil, Bulgaria, Burundi, Cambodia, Canada, Chad, Chile, China, Colombia, Congo, Costa Rica, Cyprus, Denmark, Dominican Republic, Ecuador, Egypt, El Salvador, Ethiopia, Fiji, Finland, France, Germany, Greece, Guatemala, Guyana, Honduras, Hong Kong (China), Hungary, Iceland, India, Indonesia, Islamic Republic of Iran, Ireland, Israel, Italy, Jamaica, Japan, Jordan, Kazakhstan, Kenya, Republic of Korea, Kuwait, Kyrgyzstan, Latvia, Lebanon, Lesotho, Luxembourg, Madagascar, Malawi, Malaysia, Mauritius, Mexico, Republic of Moldova, Mongolia, Morocco, Mozambique, Nepal, Netherlands, New Zealand, Nicaragua, Norway, Oman, Pakistan, Panama, Paraguay, Peru, Philippines, Poland, Portugal, Qatar, Romania, Russian Federation, Saudi Arabia, Senegal, Singapore, Slovenia, South Africa, Spain, Sri Lanka, Sweden, Switzerland, Taiwan (China), Tajikistan, United Republic of Tanzania, Thailand, Tunisia, Turkey, Uganda, Ukraine, United Arab Emirates, United Kingdom, United States, Uruguay, Bolivarian Republic of Venezuela, Viet Nam. For more details on the methodology, please see Ernst et al. (forthcoming). 1   This database is accessible via http://www.ilo.org/ilostat/GWR. ContentsContents
  • 92.
    95Annex 5. Regionalgroupings Annexes Regional groupings 5 Developed Economies and European Union European Union Austria Belgium Bulgaria Croatia Cyprus Czech Republic Denmark Estonia Finland France Germany Greece Hungary Ireland Italy Latvia Lithuania Luxembourg Malta Netherlands Poland Portugal Romania Slovakia Slovenia Spain Sweden United Kingdom North America Canada United States Other Developed Economies Australia Israel Japan New Zealand Western Europe (non-EU) Iceland Norway Switzerland Central and South- Eastern Europe (non-EU) and CIS Central and South-Eastern Europe Albania Bosnia and Herzegovina Montenegro Serbia The former Yugoslav Republic of Macedonia Turkey Commonwealth of Independent States Armenia Azerbaijan Belarus Georgia Kazakhstan Kyrgyzstan Moldova, Republic of Russian Federation Tajikistan Turkmenistan Ukraine Uzbekistan South Asia Afghanistan Bangladesh Bhutan India Maldives Nepal Pakistan Sri Lanka South-East Asia and the Pacific South-East Asia Brunei Darussalam Cambodia Indonesia Lao People’s Democratic Republic Malaysia Myanmar Philippines Singapore Thailand Timor-Leste Viet Nam Pacific Islands Fiji Papua New Guinea Solomon Islands East Asia China Hong Kong (China) Korea, Democratic People’s Republic of Korea, Republic of Macau (China) Mongolia Taiwan (China) Latin America and the Caribbean Caribbean Bahamas Barbados Cuba Dominican Republic Guadeloupe Guyana Haiti Jamaica Martinique Puerto Rico Suriname Trinidad and Tobago Central America Belize Costa Rica El Salvador Guatemala Honduras Mexico Nicaragua Panama South America Argentina Bolivia, Plurinational State of Brazil Chile Colombia Ecuador Paraguay Peru Uruguay Venezuela, Bolivarian Republic of Middle East Bahrain Iran, Islamic Republic of Iraq Jordan Kuwait Lebanon Oman Qatar Saudi Arabia Syrian Arab Republic United Arab Emirates Occupied Palestinian Territories Yemen North Africa Algeria Egypt Libya Morocco Sudan Tunisia Sub-Saharan Africa Eastern Africa Burundi Comoros Eritrea Ethiopia Kenya Madagascar Malawi Mauritius Mozambique Réunion Rwanda Somalia Tanzania, United Republic of Uganda Zambia Zimbabwe Middle Africa Angola Cameroon Central African Republic Chad Congo Congo, Democratic Republic of Equatorial Guinea Gabon Southern Africa Botswana Lesotho Namibia South Africa Swaziland Western Africa Benin Burkina Faso Cabo Verde Côte d’Ivoire Gambia Ghana Guinea Guinea-Bissau Liberia Mali Mauritania Niger Nigeria Senegal Sierra Leone Togo ContentsContents
  • 93.
  • 94.
    97Bibliography African Development BankGroup. 2012. Income inequality in Africa, Briefing Note 5, briefing notes for AfDB’s long-term strategy. Ahuja, A.; Nabar, M. 2012. Investment-led growth in China: Global spillovers, IMF Working Paper No. 12/267 (Washington, DC, International Monetary Fund). Aiyar, S.; Duval, R.; Puy, D.; Wu, Y.; Zhang, L. 2013. Growth slowdowns and the middle-income trap, IMF Working Paper No. 13/71 (Washington, DC, International Monetary Fund). Alesina, A.; Perotti, R. 1996. “Income distribution, political instability, and investment”, in European Economic Review, Vol. 40, No. 6, pp. 1203–1228. Alvaredo, F.; Gasparini, L. 2013. Recent trends in inequality and poverty in developing countries, Working Paper No. 151, Center for Distributive, Labor and Social Studies (Universidad Nacional de la Plata, La Planta). Angel-Urdinola, D.F.; Tanabe, K. 2012. Micro-determinants of informal employment in the Middle East and North Africa region, Social Protection Discussion Paper No. 1201 (Washington, DC, World Bank). Asian Development Bank (ADB). 2014. Asian Development Outlook 2014 Update: Asia in global value chains (Mandaluyong City). Autor, D.H. 2010. The polarization of job opportunities in the U.S. labor market: implications for employment and earnings (Washington, DC, The Center for American Progress and The Hamilton Project). —; Levy, F.; Murnane, R. 2003. “The skill content of recent technological change: An empirical exploration”, in Quarterly Journal of Economics, Vol. 118, No. 4, pp. 1279–1333. Baker, S.; Bloom, N.; Davis, S. 2013. Measuring economic policy uncertainty. Available at: www.policyuncertainty.com/media/BakerBloomDavis.pdf [10 Jan. 2015]. Ball, L.; Leigh, D.; Loungani, P. 2013. Okun’s Law: Fit at 50?, IMF Working Paper, No. 13/10 (Washington, DC, International Monetary Fund). Banco Bilbao Vizcaya Argentaria (BBVA). 2014. Country Risk Quarterly Report, September 2014 (Madrid). Available at: https://www.bbvaresearch.com/en/publicaciones/country-risk-third-quarter-2014/ [7 Jan. 2015]. Bassi, M.; Busso, M.; Urzúa, S.; Vargas, J. 2012. Disconnected: Skills, education and employment in Latin America (Washington, DC, Inter-American Development Bank). Berg, A.; Ostry, J. 2011. Inequality and unsustainable growth: Two sides of the same coin?, IMF Staff Discussion Note No. 11/08 (Washington, DC, International Monetary Fund). Bivens, J. 2008. Everybody wins, except for most of us: What economics teaches about globalization (Washington, DC, Economic Policy Institute). Brynjolfsson, E.; McAfee, A. 2014. The second machine age: Work, progress, and prosperity in a time of brilliant technologies (New York, W.W. Norton Company). Buckley, C. 2014. “China moves to ease home-registration rules in urbanization push”, in The New York Times, 30 July. Bureau of Labor Statistics (BLS). 2013. Occupational Employment Statistics Survey 2013 (Washington, DC, United States Department of Labor). Available at: http://www.bls.gov/oes/current/oes_tec.htm [11 Jan. 2015]. Cingano, F. 2014. Trends in income inequality and its impact on economic growth, OECD Social, Employment and Migration Working Paper No. 163 (Paris, Organisation for Economic Co-operation and Development). ContentsContents
  • 95.
    98 World Employmentand Social Outlook – Trends 2015 The Conference Board. 2014. From not enough jobs to not enough workers. Research Report, R‑1558‑14‑RR (New York, NY). Davis, S.J.; Haltiwanger, J. 2014. Labor market fluidity and economic performance, paper prepared for the Federal Reserve Bank of Kansas City’s economic policy symposium on Re-Evaluating Labor Market Dynamics, Jackson Hole (WY), 21–23 Aug. Available at: http://www.kc.frb.org/publicat/ sympos/2014/083014-1.pdf [7 Jan. 2015]. Economic and Social Commission for Western Asia (ESCWA). 2014. Sustainable development goals… An Arab regional perspective, discussion paper prepared by the ESCWA and presented at the Arab High Level Forum on Sustainable Development, Amman, 2–4 Apr. —; League of Arab States. 2013. Arab Millennium Development Goals report: Facing challenges and looking beyond 2015 (Beirut, ESCWA). Economic Commission for Latin America and the Caribbean (ECLAC); International Labour Organization (ILO). 2014. The employment situation in Latin America and the Caribbean: Conditional transfer programmes and the labour market, No. 10, May (Santiago, Chile). Eichengreen, B.; Park, D.; Shin, K. 2013. Growth slowdowns redux: New evidence on the middle-income trap, NBER Working Paper No. 18673 (Cambridge, MA, National Bureau of Economic Research). —; —; —. 2012. “When fast growing economies slow down: International evidence and implications for China”, in Asian Economic Papers, Vol. 11, pp. 42–87. Elsby, M.; Hobijn, B.; Sahin, A. 2013. “Unemployment dynamics in the OECD”, in Review of Economics and Statistics, Vol. 95, No. 2, pp. 530–548. Ernst, E.; Viegelahn, C. 2014. Hiring uncertainty: A new labour market indicator (ILO, Geneva). Available at: http://www.policyuncertainty.com/media/HiringUncertainty.pdf [7 Jan. 2015]. —; —; Narasimhan, V.; Duda, M. Forthcoming. Estimating and projecting global wage growth. ILO Research Department Working Paper (Geneva, ILO). European Commission (EC); International Labour Organization (ILO). 2014. Crisis responses, competitiveness and jobs, ILO Research Department (Geneva). Eurostat. 2010. Structure of Earnings Survey 2010. Available at: http://ec.europa.eu/eurostat/cache/ metadata/en/earn_ses2010_esms.htm [11 Jan. 2015]. Export-Import Bank of India (EXIM). 2013. West Africa: A study of India’s trade and investment potential, Research Brief No. 72 (Mumbai). Available at: http://www.eximbankindia.in/sites/default/files/ ind-eco.pdf [11 Jan. 2015]. Felipe, J.; Mehta, A.; Rhee, C. 2014. Manufacturing matters… but it’s the jobs that count, ADB Economics Working Paper Series No. 420 (Manila, Asian Development Bank). Galor, O.; Zeira, J. 1993. “Income distribution and macroeconomics”, in The Review of Economic Studies, Vol. 60, No. 1, pp. 35–52. Ghani, E.; O’Connell, S.D. 2014. Can service be a growth escalator in low income countries?, Policy Research Working Paper No. 6971 (Washington, DC, World Bank). Göbel, C.; Zwick, T. Forthcoming. “Which personnel measures are effective in increasing productivity of old workers?” in Labour Economics. Goos, M.; Manning, A. 2007. “Lousy and lovely jobs: The rising polarization of work in Britain”, in The Review of Economics and Statistics, Vol. 89, No. 1, pp. 118–133. Gordo, L.; Skirbekk, V. 2013. “Skill demand and the comparative advantage of age: Jobs tasks and earnings from the 1980s to the 2000s in Germany”, in Labour Economics, Vol. 22, pp. 61–69. Hausman, R.; Pritchett, L.; Rodrik, D. 2005. “Growth accelerations”, in Journal of Economic Growth, Vol. 10, No. 4, pp. 303–329. International Institute for Labour Studies (IILS). 2013. World of Work Report 2013: Repairing the economic and social fabric (Geneva, ILO). International Labour Organization (ILO). 2012. Statistical update on employment in the informal economy (Geneva). Available at: http://laborsta.ilo.org/applv8/data/INFORMAL_ECONOMY/2012-06- Statistical%20update%20-%20v2.pdf [7 Jan. 2015]. —. 2013a. Key Indicators of the Labour Market (KILM), 8th edition (Geneva). —. 2013b. 2013 Labour Overview: Latin America and the Caribbean (Lima, ILO Regional Office). —. 2013c. Asia-Pacific Labour Market Update, Dec. (Bangkok, ILO Regional Office). —. 2013d. Global Employment Trends 2013: Recovering from a second jobs dip (Geneva). ContentsContents
  • 96.
    99Bibliography —. 2014a. GlobalEmployment Trends 2014: Risk of a jobless recovery? (Geneva). —. 2014b. Global Wage Report 2014/15: Wages and income inequality (Geneva). —. 2014c. Greece: Productive jobs, Studies on growth with equity, Research Department (Geneva). —. 2014d. Spain: Growth with jobs, Studies on growth with equity, Research Department (Geneva). —. 2014e. Twenty-first century challenges for the Americas: Full and productive employment and decent work, Report of the Director-General for the 18th American Regional Meeting, Lima, Peru, 13–16 Oct. (Geneva). —. 2014f. Thematic labour overview. Transition to formality in Latin America and the Caribbean (Lima, ILO Regional Office). —. 2014g. Panorama Laboral 2014 (Lima, ILO Regional Office). —. 2014h. Thailand Labour Market Update, Mar. (Bangkok, ILO Country Office for Thailand, Cambodia and Lao People’s Democratic Republic). Available at: http://www.ilo.org/wcmsp5/groups/public/--- asia/---ro-bangkok/---sro-bangkok/documents/publication/wcms_240328.pdf [11 Jan. 2015]. —. 2014i. Samoa Labour Market Update, Aug. (Suva, ILO Office for Pacific Island Countries). —. 2014j. Assessment of the impact of Syrian refugees in Lebanon and their employment profile (Beirut, ILO Regional Office). —. 2014k. The impact of the Syrian refugee crisis on the labour market in Jordan: A preliminary analysis (Beirut, ILO Regional Office). —. 2014l. World of Work Report 2014: Developing with jobs (Geneva). —. 2014m. World Social Protection Report 2014/15: Building economic recovery, inclusive development and social justice (Geneva). —. Forthcoming. Latin America: Effectiveness of ALMPs Studies on growth with equity (Geneva). —; Asian Development Bank (ADB). 2014. ASEAN Community 2015: Managing integration for better jobs and shared prosperity (Bangkok). —; United Nations Development Programme (UNDP). 2012. Rethinking economic growth: Towards productive and inclusive Arab societies (Beirut, ILO Regional Office). International Monetary Fund (IMF). 2014a. People’s Republic of China, IMF Country Report No. 14/235 (Washington, DC). Available at: http://www.imf.org/external/pubs/ft/scr/2014/cr14235.pdf [11 Jan. 2015]. —. 2014b. Regional Economic Outlook: Asia and the Pacific, Oct. (Washington, DC). —. 2014c. Regional Economic Outlook: Middle East and Central Asia, Oct. (Washington, DC). —. 2014d. World Economic Outlook: Legacies, clouds, uncertainties, Oct. (Washington, DC). Jaimovich, N.; Siu, H. 2012. The trend is the cycle: Job polarization and jobless recoveries, NBER Working Paper No. 18334 (Cambridge, MA, National Bureau of Economic Research). Kapsos, S.; Bourmpoula, V. 2013. Employment and economic class in the developing world, ILO Research Paper, No. 6 (Geneva, ILO). Available at: http://www.ilo.org/wcmsp5/groups/public/---dgreports/-- -inst/documents/publication/wcms_216451.pdf [7 Jan. 2015]. —; Silberman, A.; Bourmpoula, E. 2014. Why is female labour force declining so sharply in India?, ILO Research Paper No. 10 (Geneva). Kumhof, M.; Rancière, R. 2010. Inequality, leverage and crises. IMF Working Paper No. 10/268 (Washington, DC, International Monetary Fund). Lustig, N.; Lopez-Calva, L.F.; Ortiz-Juarez, E. 2013. Deconstructing the decline in inequality in Latin America, Policy Research Working Paper Series No. 6552 (Washington, DC, World Bank). ManpowerGroup. 2013. 2013 Talent Shortage Survey: Research Results (Milwaukee, WI). Mayer, G. 2014. The trend in long-term unemployment and characteristics of workers unemployed for two years or more (Washington, DC, Congressional Research Service). Michaels, G.; Natraj, A.; Van Reenen, J. 2010. “Has ICT polarized skill demand? Evidence from eleven countries over twenty-five years”, in The Review of Economics and Statistics, Vol. 96, No. 1, pp. 60–77. Mishel, L.; Bivens, J.; Gould, E.; Shierholz, H. 2012. The State of Working America, 12th edition (Ithaca, NY, ILR Press of Cornell University Press). —; Schmitt, J.; Shierholz, H. 2014. “Wage inequality: A story of policy choices”, in New Labor Forum, pp. 1–6. ContentsContents
  • 97.
    100 World Employmentand Social Outlook – Trends 2015 National Bureau of Statistics of China (NBS). 2014. Statistical communiqué of the People’s Republic of China on the 2013 national economic and social development. —. 2014. China Statistical Abstract, 2014 (Beijing). Organisation for Economic Co-operation and Development (OECD). 2012. OECD Employment Outlook 2012 (Paris). Ostry, J.; Berg, A.; Tsangarides, C. 2014. Redistribution, inequality, and growth, IMF Staff Discussion Note 14/02 (Washington, DC, International Monetary Fund). Perova, E.; Vakis, R. 2009. Welfare impacts of the “Juntos” program in Peru: Evidence from a non‑experimental evaluation (Washington, DC, World Bank). —; —. 2011. Más tiempo en el programa, mejores resultados: duración e impactos del programa JUNTOS en el Perú (Washington, DC, World Bank). Rajan, R. 2010. Fault lines: How hidden fractures still threaten the world economy (Princeton, NJ, Princeton University Press). Rodrik, D. 2013. The perils of premature deindustrialization, Project Syndicate, 11 Oct. Available at: http://www.project-syndicate.org/commentary/dani-rodrikdeveloping-economies--missing- manufacturing [11 Jan. 2015]. —. 2014. Are services the new manufactures? Project Syndicate, 13 Oct. Available at: http://www.project- syndicate.org/commentary/are-services-the-new-manufactures-by-dani-rodrik-2014-10 [11 Jan. 2015]. Ruckelshaus, C.; Leberstein, S. 2014. Manufacturing low pay: Declining wages in the jobs that built America’s middle class (New York, NY, National Employment Law Project). Shimer, R. 2012. “Reassessing the ins and outs of unemployment”, in Review of Economic Dynamics, Vol. 15, No. 2, pp. 127–148. Solt, F. 2014. The Standardized World Income Inequality Database, Working Paper, SWIID Version 5.0, Oct. Stiglitz, J. 2013. The price of inequality: How today’s divided society endangers our future (New York, NY, W.W. Norton Company). Subramanian, A. 2014. Premature deindustrialization, 22 Apr. (Washington, DC, Center for Global Development). Available at: http://www.cgdev.org/blog/premature-de-industrialization [11 Jan. 2015]. Teulings, C.; Hartog, J. 1998. Corporatism or competition? Labour contracts, institutions and wage structures in international comparison (Cambridge, Cambridge University Press). United Nations (UN). 2014. Draft outcome document of the third International Conference on Small Island Developing States, transmitted to the third International Conference on Small Island Developing States, Apia, Samoa, 1–4 Sep. United Nations Conference on Trade and Development (UNCTAD). 2014. UNCTAD Statistics (New York). United Nations Population Fund (UNFPA). 2014. State of World Population 2014 (New York). Viegelahn, C. Forthcoming. Structural trends in the labour market: Headwinds or boosts to economic growth? (Geneva, ILO). Weinberg, B. 2002.  “New technologies, skills obsolescence, and skill complementarity”, in A. de Griep, J. van Loo and K. Mayhew (eds): The Economics of Skills Obsolescence, Research in Labor Economics, Vol. 21, pp. 101–118. World Bank. 2013. Jobs for shared prosperity: Time for action in the Middle East and North Africa (Washington, DC). —. 2014a. Global Economic Prospects: Shifting priorities; building for the future, June (Washington, DC). —. 2014b. The economic impact of the 2014 Ebola epidemic: Short and medium term estimates for Guinea, Liberia, and Sierra Leone (Washington, DC). —. 2014c. World Development Indicators 2014 (Washington, DC). World Health Organization (WHO). 2014. Ebola response roadmap: Situation report (Geneva). Available at: http://apps.who.int/ebolaweb/sitreps/20141231/20141231.pdf [11 Jan. 2015]. Zaccone, J. 2012. Has globalization destroyed the American middle class? (Lynbrook, NY, National Jobs for All Coalition). ContentsContents
  • 98.
    I S BN 978-92-2-129259-3 9 7 8 9 2 2 1 2 9 2 5 9 3 The World Employment and Social Outlook – Trends 2015 provides a global overview of recent trends in employment, unemployment, labour force participation, productivity, as well as different dimensions of job quality, such as vulnerable employment, informal jobs and working poverty. The overview covers all countries in the world and describes patterns in the main regions and sectors. In addition, the report examines income and social developments and provides an indicator of social unrest. The volume also presents projections for the period 2015–19 for employment, unemployment and the labour force. A key finding of this research is that the expansion of the world economy has been too weak to close the significant employment and social gaps that have emerged since the beginning of the global crisis in 2008. Around 201 million people were unemployed in the world in 2014, and the projections are for a further increase in global unemployment by 11 million people over the next five years. Income inequalities are widening as the job market is changing profoundly. A growing number of jobs once performed by semi-skilled workers have become automated.