Download to read offline

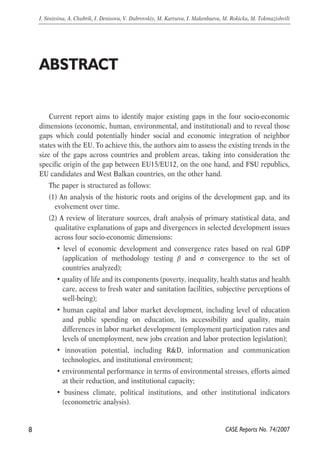
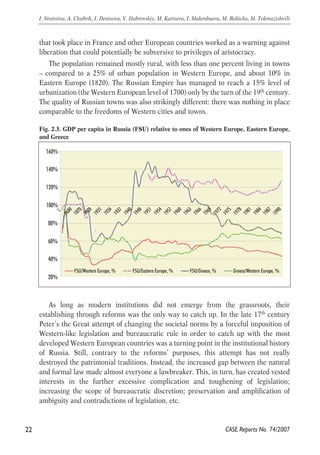
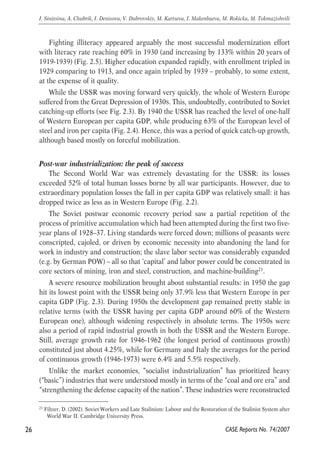
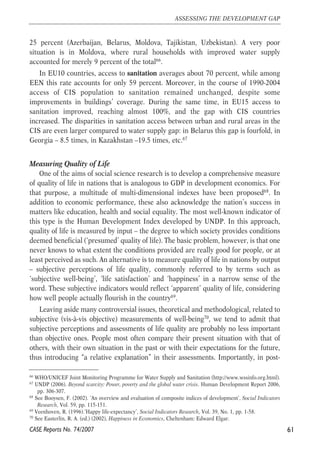
![Still, despite Peter the Great’s attempt of institutional and technological catch-up in the
beginning of the 18th century, by the beginning of Industrial Revolution the Russian
Empire remained mostly agrarian. It remained such for quite a long period of time
with less than one percent of urban population compared to fifteen percent in the
Western Europe, and 5.65% in the Eastern Europe by 1720.
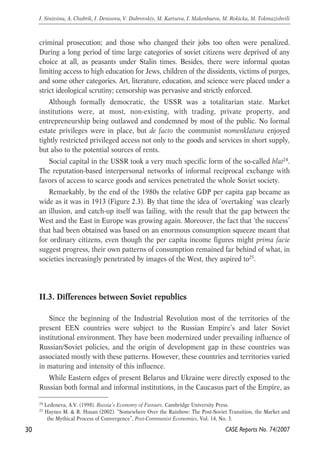
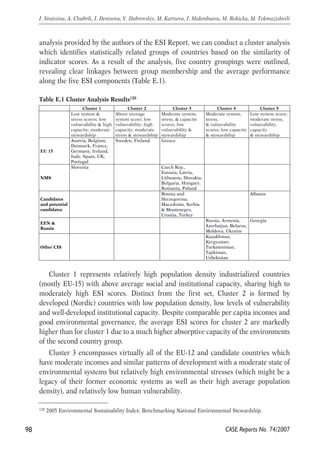
Authoritarianism was an essential part of any agrarian empire, and Russia was not
an exception, remaining an absolute monarchy until the early 20th century. Serfdom
that lasted until 1861 made labor mobility close to zero. Instead, modern industries
were run mostly by the state that, in its turn, was also using mostly forced labor. At the
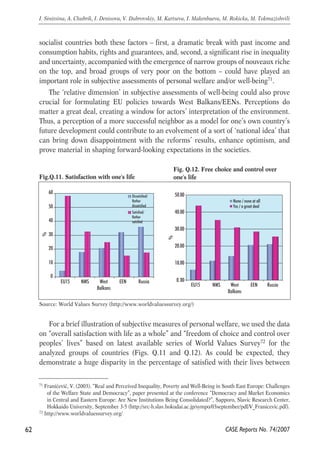
same time, the bureaucracy and other institutions of rational rule were largely formal,
while the actual rules remained inherited from the patrimonial state17. The rule of law
and other institutions needed for complex transactions going beyond simple bazaar
exchange remained weak, so the financial markets were non-existing. Therefore, not
only the industrialization did not start, but the most necessary preconditions for a
“market capitalist” kind of industrialization were missed along with driving forces for it.
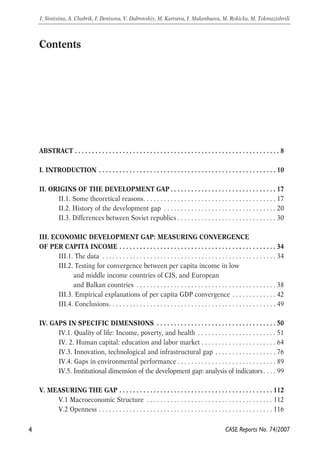
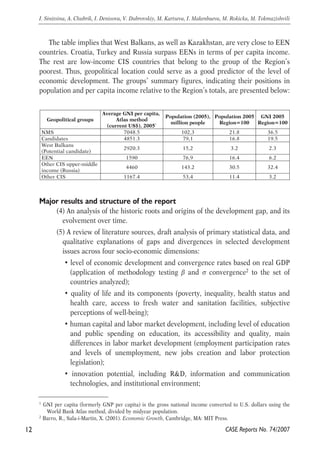
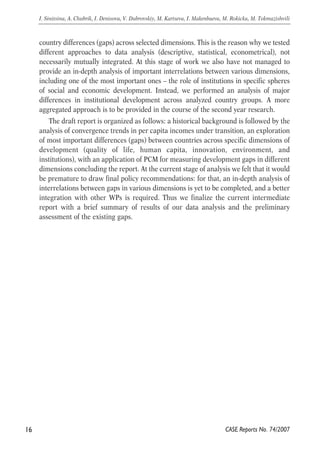
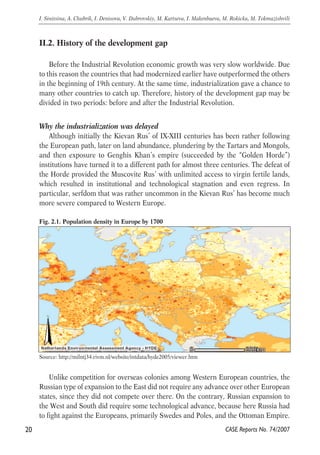
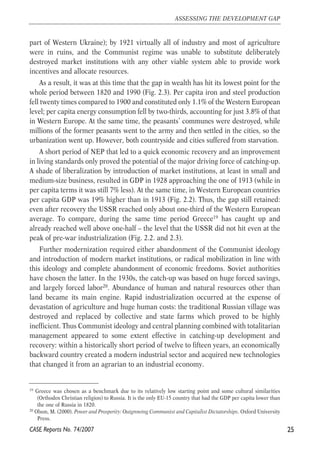
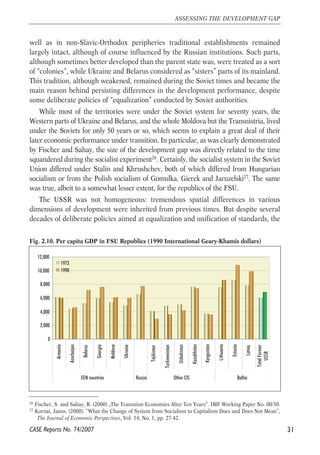
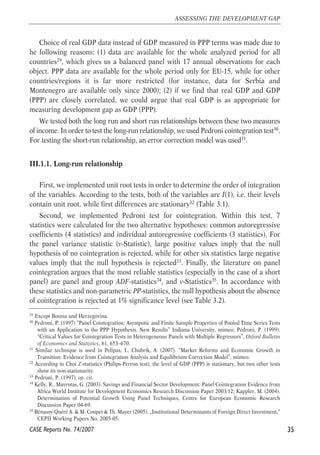
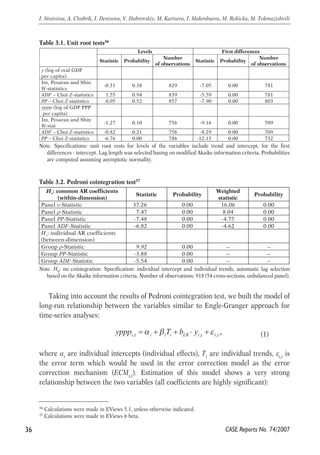
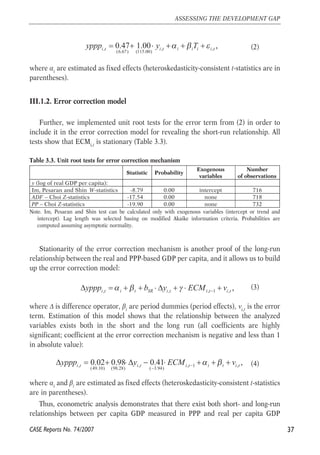
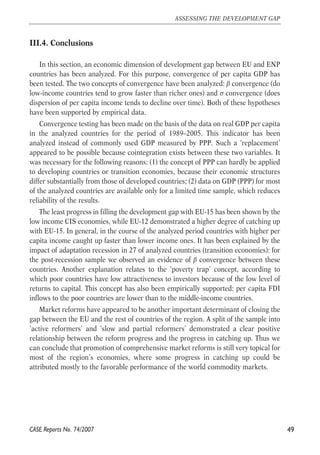
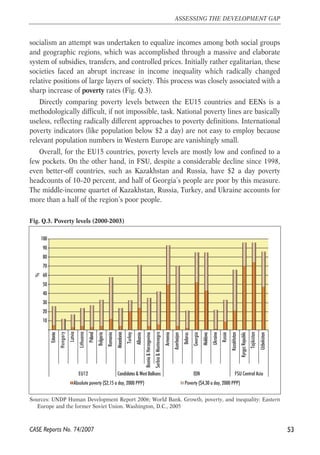
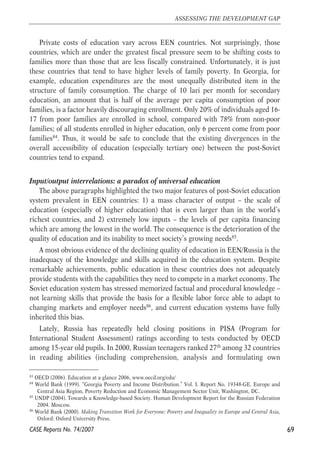
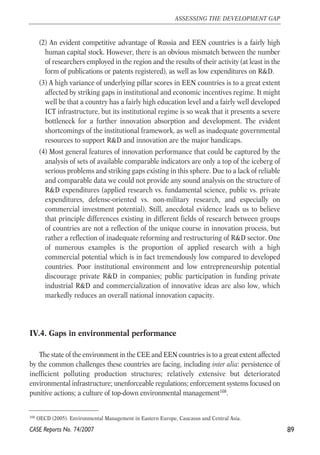
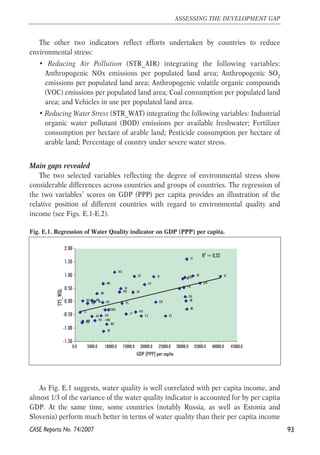
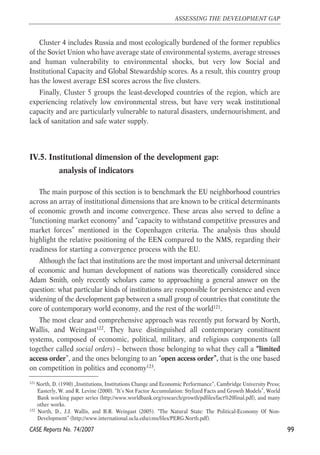
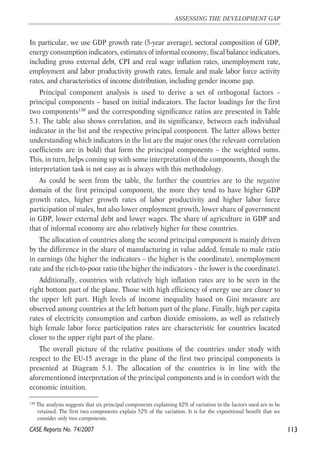
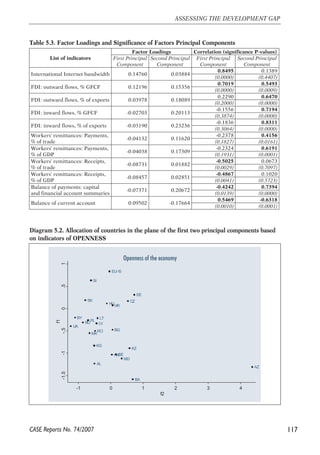
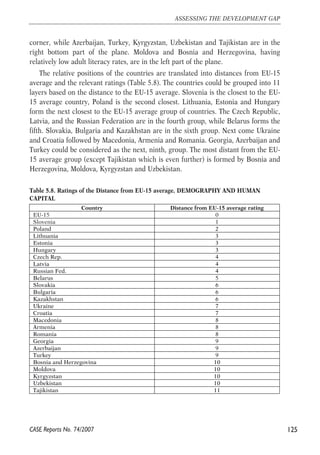
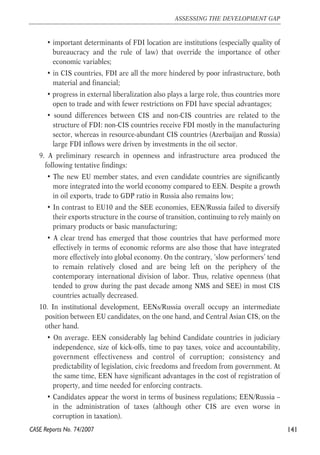
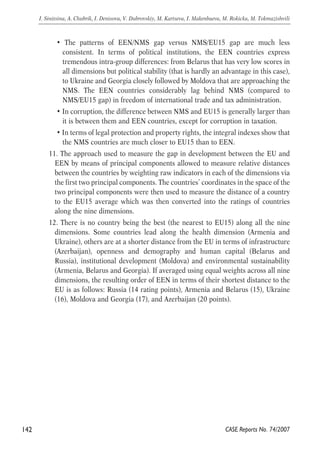
Fig. 2.2. GDP per capita in Russia (FSU) compared to Europe and Greece
18,000
16,000
14,000
12,000
10,000
8,000
6,000
4,000
2,000
0
1
1600
1870
1928
1931
1954
1957
1960
1963
1966
1969
1972
1975
1978
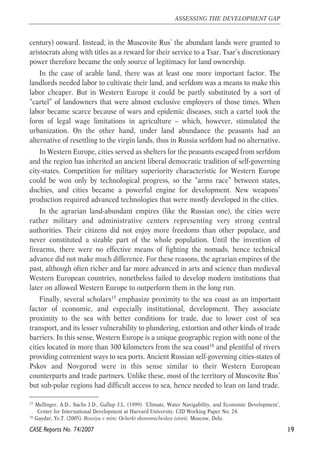
By this time the Russian Empire was already one of the largest in the world by its
territory having, however, very little density of population even in its most developed
European part (Fig. 2.1), abundant with virgin lands, having a severe serfdom and
with very weak incentives for entrepreneurship. Examples of bourgeois revolutions
21
ASSESSING THE DEVELOPMENT GAP
17 Volkov, V. (2000). “Patrimonialism versus Rational Bureaucracy: on the Historical Relativity of Corruption”
[in:] S. Lovell, A. V. Ledeneva, and A. Rogachevskii (ed.), Bribery and Blat in Russia: Negotiating Reciprocity
from the Middle Ages to the 1990, School of Slavonic and Eastern European Studies, University of London.
McMillan.
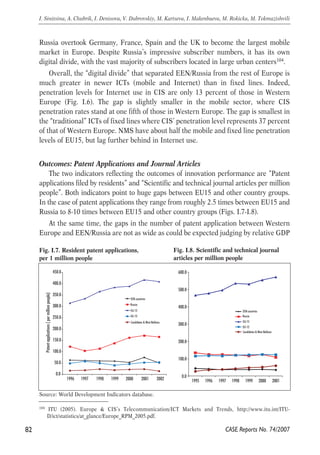
CASE Reports No. 74/2007
1934
1937
1940
1948
1951
1981
1984
1987
1990
1990 Int'l Geary-Khamis $
Greece
Western Europe (29 countries)
FSU/Russia](https://image.slidesharecdn.com/cnr74-141022094859-conversion-gate01/85/CASE-Network-Reports-74-Assessing-the-Development-Gap-21-320.jpg)
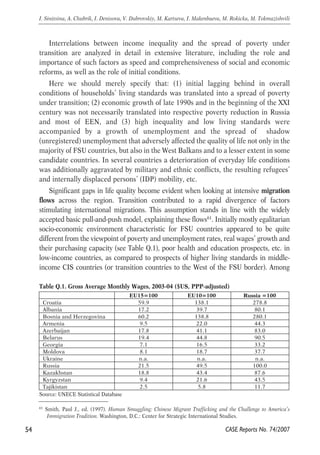
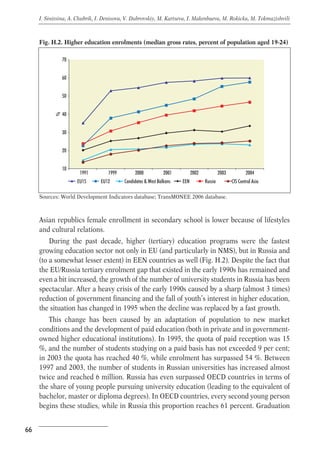
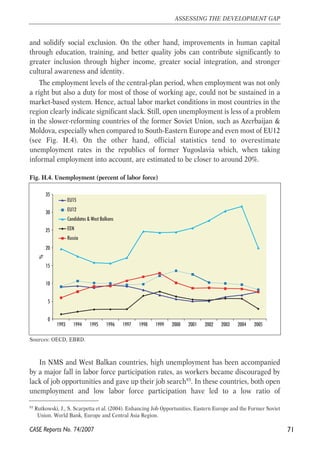
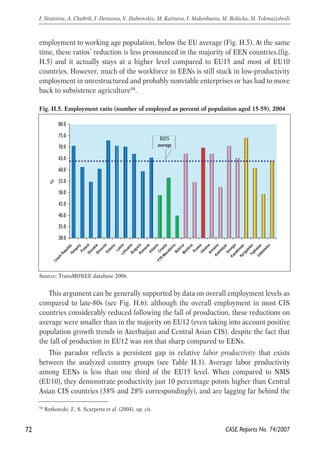
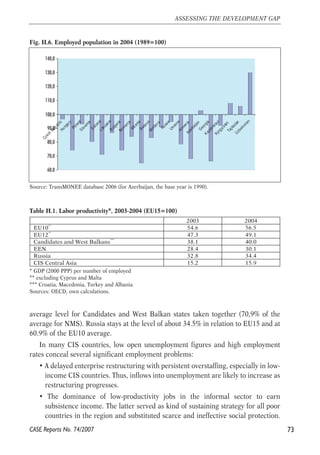
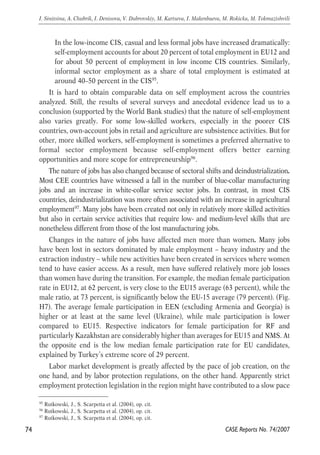
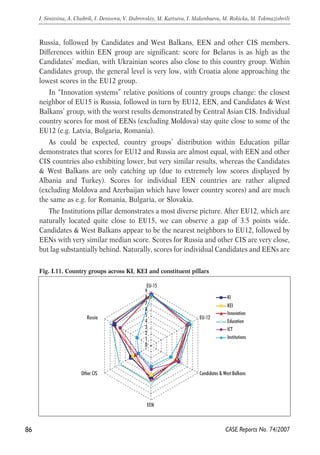
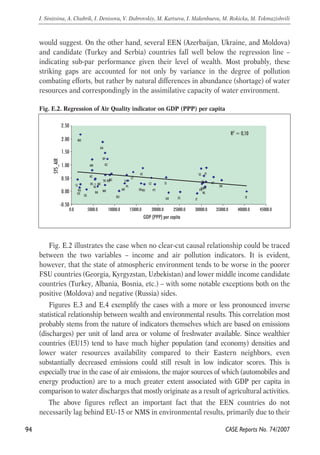
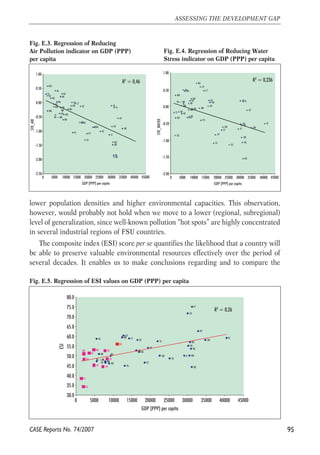
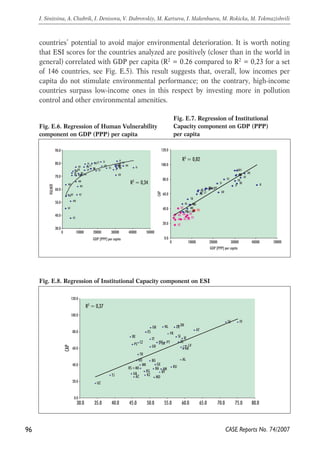
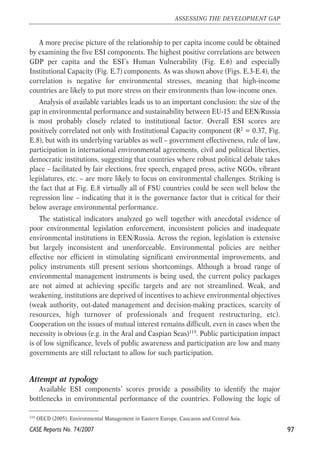
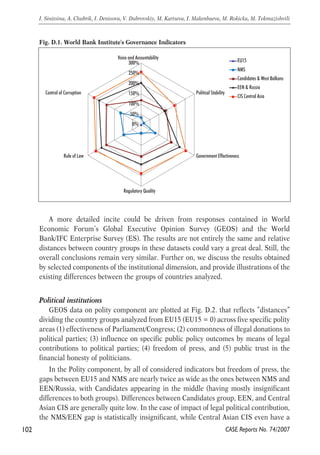
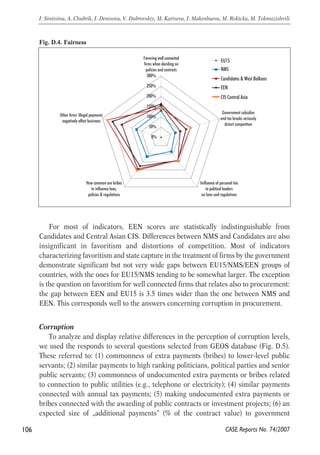
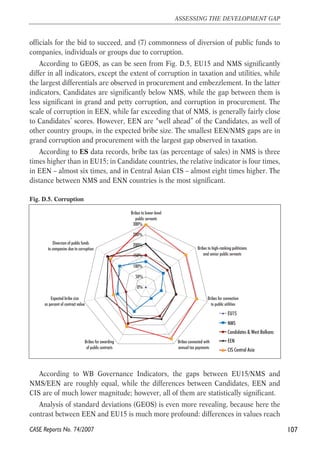
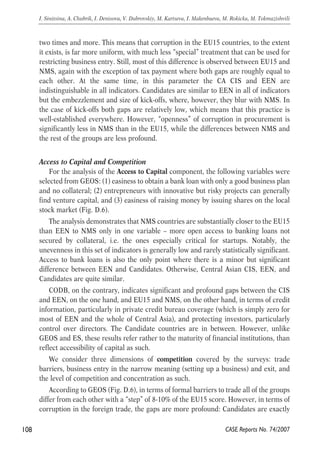
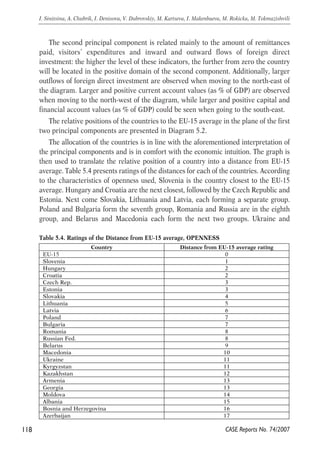
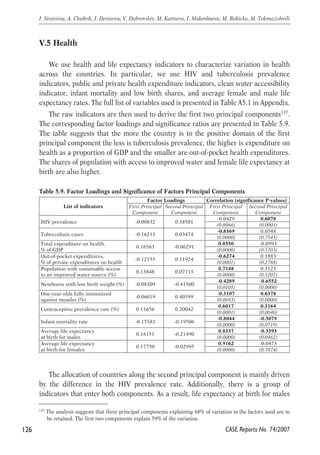
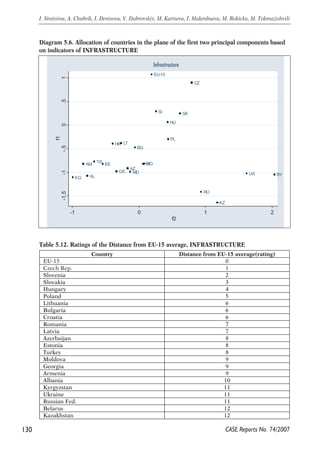
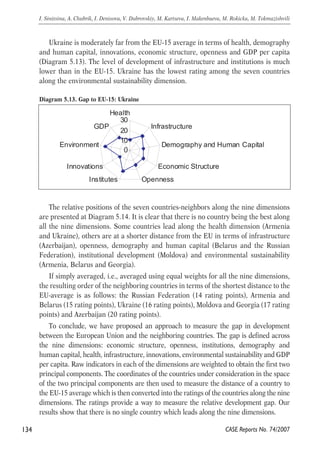
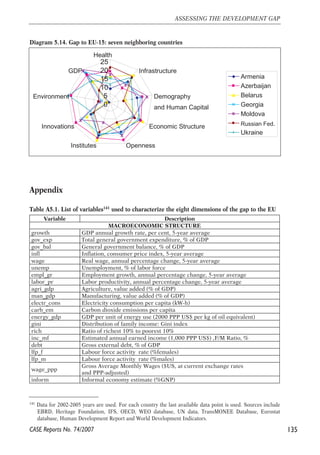

This report, prepared within the ENEPO project, examines the development gaps among EU neighboring countries, focusing on economic, human, environmental, and institutional dimensions. It aims to assess trends and origins of these gaps, which could impact social and economic integration with the EU, and includes a comprehensive analysis based on quantitative and qualitative methods. The authors, experts in various fields, highlight notable issues related to each dimension, providing insights for policy-making and research.


