Download to read offline

![107
References
Antczak, R. (1996), Foreign Trade and Balance of Payments of Ukraine in 1992-1995 [Handel
zagraniczny i bilans p³atniczy Ukrainy w latach 1992-1995], [in:] M. D¹browski and R.
Antczak eds., Ukrainian Path to the Market Economy 1991-1995 [Ukraiñska droga do
gospodarki rynkowej 1991-1995; in Polish], CASE, Warsaw.
Aslund, A. (2001). Ukraine's Return to Economic Growth. Post-Soviet Geography and Economics,
Vol. 42 No. 5, pp. 313-328.
Aslund, A. (1994). Lessons of the First Four Years of Systemic Change in Eastern Europe, Journal
of Comparative Economics, Vol. 19, No. 1.
Babanin, O., V. Dubrovskiy and O. Ivaschenko (2002), Ukraine: The Lost Decade … and a
Coming Boom?. The GDN "Explaining Growth" working paper, In press, Available at:
http://www.eerc.ru/activ/GDN/.
Barth, J. R., G., Jr. Caprio, and R. Levine (2001), Bank Regulation and Supervision: What Works
Best? World Bank Working Paper.
Benecke Ch., and St. von Cramon-Taubadel (2001), The present and future profitability of
sugar production in Ukraine, [in:] St. von Cramon-Taubadel, S. Zorya, L. Stiewe (eds.),
Policies and Agricultural Development in Ukraine, pp. 214-239, Shaker-Verlag: Aachen.
Blanchard, O. (1997), The Economics of Post-Communist Transition, Clarendon Press: Oxford.
CASE (2002), Global Economy. Quarterly Outlook, No. 2/2002 (6), CASE, Warsaw. April. At
www.case.com.pl
CASE (2000-2001), Quarterly Ukrainian Economic Outlook – Trends, Opinions, Forecasts (in
Russian), Various editions.
Cabinet of Ministries of Ukraine (2001), Reformi zaradi dobrobutu v 2000 [Reforms for
Welfare in 2000], March 2, 2001.
D¹browski, M. (1994). Ukrainian Way to Hyperinflation, CASE, Studies and Analyses, No. 12,
Warsaw.
D¹browski, M., U. Górski, and M. Jarociñski (1999), Inflationary Consequences of Devaluation
Crisis in Russia and Ukraine: The First Observations, CASE Studies and Analyses, No. 159.
Dubrovskiy, V. (2001), Economic Transformation in the NIS and Failure of the Washington
Consensus: More Questions than Answers, [in:] Szyrmer and D. Snelbecker (eds.), Reforms
in Ukraine: Ideas and Actions, J. Kyiv, Alterpress, pp. 81-103.
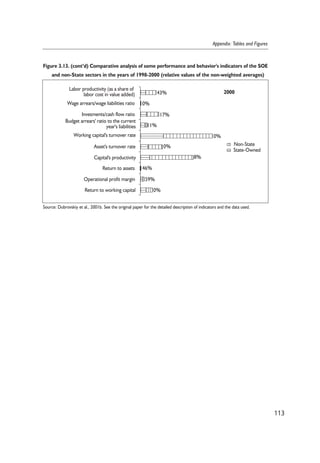
Dubrovskiy, V., T. Shygayeva, O. Bilothsekivets, R. Bondarenko, M. Golovanenko (2001a),
The Impact of Privatization to the Economic Behavior and Performance of the Firms in the](https://image.slidesharecdn.com/rc55-141023035342-conversion-gate02/85/CASE-Network-Reports-55-The-Sources-of-Economic-Growth-in-Ukraine-after-1998-Currency-Crisis-and-the-Country-s-Prospects-107-320.jpg)
![Context of General Economic Conditions in Ukraine, Analytical Report, funded by SPFU.
Under the supervision of J. Szyrmer. HIID/CASE, mimeo, http://www.case-ukraine.
kiev.ua
Dubrovskiy, V., T. Shygayeva, O. Bilothsekivets, R. Bondarenko, M. Golovanenko (2001b),
The Impact of Privatization to the Economic Behavior and Performance of the Firms in the
Context of General Economic Conditions in Ukraine in the years of 2000-2001, Analytical
Report, funded by SPFU. Under the supervision of J. Szyrmer. HIID/CASE, mimeo,
http://www.case-ukraine.kiev.ua
Dubrovskiy, V., and T. Shygayeva (2000), It Would Go Worse Without Privatization: The Analysis
of Balance Sheets of the Industrial Enterprises Says for the Non-State Sector of the Economy
(in Russian), Zerkalo Niedeli newspaper (The Mirror Weekly), No. 7(280).
Dubrovskiy, V. (2001), Privatization and Growth in the Real World: The Case of Ukraine, [in:] A.
Paskhaver (ed.), The Ukrainian Privatization: Pros and Contras, Alterpress, Kyiv.
Easterly W., and R. Levine, (2000), It's Not Factor Accumulation: Stylised Facts and Growth
Models. Mimeo.
Enste, D., and F. Schneider (2000), Shadow Economies Around the World: Size, Causes and
Consequences, IMF Working Paper, WP/00/26.
Estrin, S. and R. Rosevear (2000), The Transformation of Ownership in Ukraine and Policy
Options, Economic Essays, Institute of Reforms, Kyiv, Available at: www.ir.org.ua (in
Ukrainian).
Estrin, S. and R. Rosevear (1998), Enterprise Performance and Corporate Governance in
Ukraine, paper presented during Workshop on Corporate Governance in Russia, London
Business School, June.
Fischer, S., and R. Sahay (2000), The Transition Economies after Ten Years, NBER Working
Paper No. W7664, April.
Frydman, R., Ch. Gray, M. Hessel and A. Rapaczynski (1997), Private Ownership and Corporate
Perormance: Some Lessons from Transition Economies, Research Report RR#97-28. C.V.
Starr Center for Applied Economics, New York University.
Frydman, R., M. Hessel, and A. Rapaczynski (1998), Why Ownership Matters? Politicization and
Enterpreneurship in the Restructuring of Enterprises in Central Europe. Research Report (RR
98-14). C.V. Starr Center for Applied Economics, New York University.
German Advisory Group on Economic Reform (2001), Welche Maßnahmen im
Landwirtschaftsektor führten zum Erfolg? [in:] Die ersten 365 Tage: Ein konstruktiver
Rückblick auf die Wirtschaftsreformen in der Ukraine im Jahr 2000, Deutscher
Beratergruppe Wirtschaft bei der ukrainischen Regierung, Kyjiv, January, pp. 18-28.
Guriev, S., and B. Ickes (2000), Microeconomic Aspects of Economic Growth in the Eastern
Europe and the Former Soviet Union, 1950-2000, Paper for the Research Project of
108
CASE Reports No. 55 – The Sources of Economic Growth in Ukraine ...](https://image.slidesharecdn.com/rc55-141023035342-conversion-gate02/85/CASE-Network-Reports-55-The-Sources-of-Economic-Growth-in-Ukraine-after-1998-Currency-Crisis-and-the-Country-s-Prospects-108-320.jpg)
![Global Development Network, "Explaining Growth", http://www.eerc.ru/activ/
GDN/Guriev_IckesPaper.pdf
Guriev, S., and B. Ikces (1999), Barter in Russia. [in:] P. Seabright (ed.), The Vanishing Ruble:
Barter and Currency Substitution in Post-Soviet Societies, Cambridge University Press:
Cambridge, UK.
Gylfason, T. (2001), Natural Resources and Economic Growth, Paper for the conference "The
Factors of Sustainable Economic Growth in Ukraine", Kyiv, June 25-26.
Hellman, J., and M. Schankerman (2000), Intervention, Corruption, and Capture, Economics of
Transition, Vol. 8(3), 2000, pp.545-576.
Hellman, Joel S. (1998), Winners Take All. The Politics of Partial Reform in Post-Communist
Transitions, World Politics 50, pp. 203-234.
Ickes, B. and Gaddy, (1998), Enterprises in Russia, Paper presented during Academic
Workshop on Corporate Governance in the Former Soviet Union, London Business
School, June.
IER (2002), Monthly Economic Monitor of Ukraine, Monthly outlook by Institute for Economic
Research and Policy Consulting, Kiev, Various editions, available at www.ier.kiev.ua
IFC, (1997), 1997 Business Survey, Obstacles to Small Business Development in Ukraine,
International Financial Corporation, Kyiv.
IMF (2001), Ukraine. Staff Report for the Fifth and Sixth Reviews Under the Extended
Arrangement, IMF, Washington, D.C., August.
Johnson, S., McMillan, J., and C. Woodruff (2000), Property Rights and Finance, MIT Working
Paper. At http://web.mit.edu/sjohnson/www/home.htm
Kornai, J. (1986), The Soft Budget Constraint, Kyklos, 39(1) pp. 3-30.
Libanova, E., O. Poznyak (2002), The Labour Migrations from Ukraine – a New Migration
Potential from Eastern Countries, Paper presented at Beyond Transition – Development
Perspectives and Dilemmas CASE conference. Falenty near Warsaw, Poland, April 12-13.
Lunina, I., and V. Vincetz, (1999), Subsidizing Ukraine's Enterprises, [in:] Ukraine at the
Crossroads, Springer Verlag, pp.118-132.
Nelson, R. and S. Winter (1982), An Evolutionary Theory of Economic Change, Harvard
University Press, Cambridge, MA.
Paskhaver, A. (2002), Two years of economic growth: more questions than answers, The PiC
(weekly), #9 (140), 2002, Kyiv (in Ukrainian), http://www.pic.com.ua/9 140/achas/c7.htm
Paskhaver, A. (1999), Prospects for Entrepreneurship in Ukraine: Privatization and Gains of the
New Capital, Monitoring of Ukrainian Economy 1/43.
Roe, A. (ed.) (2001), Ukraine: The Financial Sector and the Economy. The New Policy
Agenda, World Bank. Available at www.worldbank.org.ua
Shleifer, A., T. Frye (1997), The Invisible Hand and the Grabbing Hand, American Economic
Review Papers and Proceedings, May.
109
References](https://image.slidesharecdn.com/rc55-141023035342-conversion-gate02/85/CASE-Network-Reports-55-The-Sources-of-Economic-Growth-in-Ukraine-after-1998-Currency-Crisis-and-the-Country-s-Prospects-109-320.jpg)
![Shygayeva, T. (2001a), Industrial Production and Finance, [in:] J. Szyrmer (ed.), Ukraine:
Monetizing a Transition Economy, Harvard/CASE Ukraine Project, Kyiv.
Shygayeva, T. (2001b), Industry of Ukraine in 2000, Financial Risks, #1/2001, pp.7-43.
Shygayeva, T. (2000), Industry of Ukraine in 1999, Financial Risks, #1/2000, Kyiv (in Russian).
Striewe, L., and St. von Cramon-Taubadel (2001), Ernstfall Rekordernte: Was läuft schief auf
den Ukrainischen Getreidemärkten? Deutscher Beratergruppe Wirtschaft bei der
ukrainischen Regierung, Kyiv, September (manuscript).
Sultan, Khwaja, Dimitar Mishev, and Olga Pogarska, (2001), Finance and Growth, [in:] Janusz
Szyrmer (ed.), Ukraine: Monetizing a Transition Economy, Harvard/CASE-Ukraine,
Alterpress, Kyiv.
Szyrmer, J. (2001), Openness, Distortions and Growth, [in:] J. Szyrmer and D. Snelbecker,
(eds.), Reforms in Ukraine: Ideas and Actions, pp. 81-103. Alterpress, Kyiv.
Szyrmer, J. (2001), Post-Soviet Transition: Problems, Lessons and Solutions, [in:] J. Szyrmer and
D. Snelbecker (eds.), Reforms in Ukraine: Ideas and Actions, pp. 81-103. Alterpress, Kyiv.
Szyrmer, J., and O. Besedina, (2001), Transactions in Transition: To Barter or Not to Barter, [in:]
Ukraine: Monetizing a Transition Economy, J. Szyrmer (ed.), Alterpres, Kyiv.
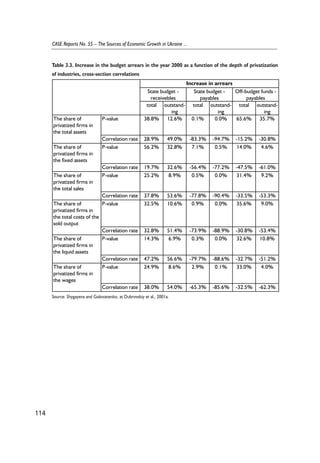
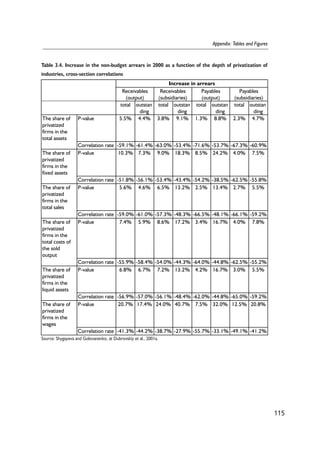
Szyrmer, J. and V. Dubrovskiy (2001), Influence of Privatization on Behavior and Economic
Performance of Enterprises in the Context of Economic Situation in 2000-2001, CASE-Ukraine,
www.case-ukraine.org.ua.
Szyrmer, J., V. Dubrovskiy, and T. Shygayeva (1999), Is the Private Sector More Efficient? ICPS
Policy Studies 1, http://www.icps.kiev.ua.
UDN. Ukraine Daily News. Daily on-line news of Ukrainian News Agency.
World Bank (2002), Transition. The First Ten Years. Analysis and Lessons for Eastern Europe and
the Former Soviet Union, The World Bank, Washington, D.C.
Yakoub, M., B. Senchuk, and T. Tkachenko (2001), Ukrainian Enterprises in 2000: An IFC
Survey of Ukrainian Business, Report by IFC Ukraine Business Development Project.
Zhurzhenko, T. (1998), Ukrainian Women in the Transitional Economy, Labour Focus on
Eastern Europe, No. 60.
110
CASE Reports No. 55 – The Sources of Economic Growth in Ukraine ...](https://image.slidesharecdn.com/rc55-141023035342-conversion-gate02/85/CASE-Network-Reports-55-The-Sources-of-Economic-Growth-in-Ukraine-after-1998-Currency-Crisis-and-the-Country-s-Prospects-110-320.jpg)

This document, prepared for the World Bank, analyzes the sources of economic growth in Ukraine from the late 1990s and discusses the sustainability of this growth. It covers macroeconomic outlook, external sector developments, microeconomic prerequisites for growth, fiscal policy, and challenges for future growth. The study indicates the complex interplay of various macro and microeconomic factors affecting Ukraine's economy, emphasizing the need for comprehensive reform to ensure sustained economic progress.


![Economic overview-final[1]](https://cdn.slidesharecdn.com/ss_thumbnails/economic-overview-final1-120329125506-phpapp02-thumbnail.jpg?width=640&height=640&fit=bounds)


