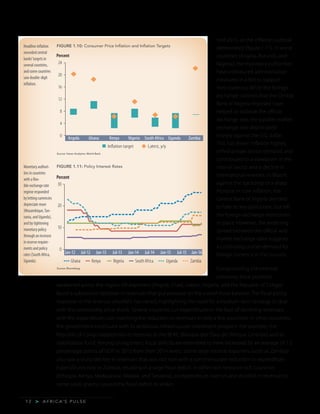
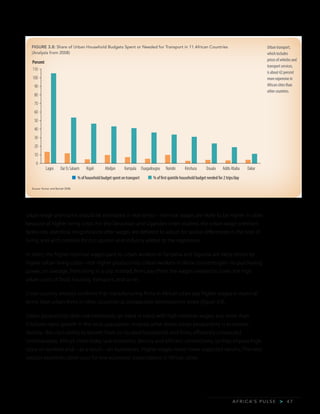
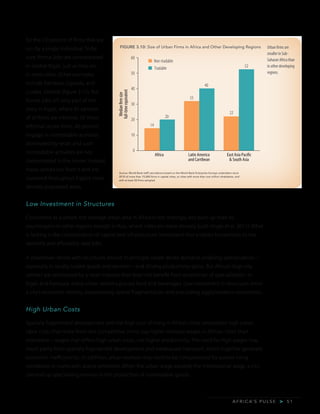
This document analyzes issues shaping Africa's economic future. It finds that growth in Sub-Saharan Africa will remain lackluster in 2016 due to low commodity prices. Addressing economic vulnerabilities and diversifying growth are priorities. Rapid urbanization offers potential, but cities must reform land markets and regulations to coordinate infrastructure investments to work effectively and support sustainable growth. The analysis examines the macroeconomic impact of declining oil prices, challenges facing African cities, and policy recommendations to leverage urbanization.


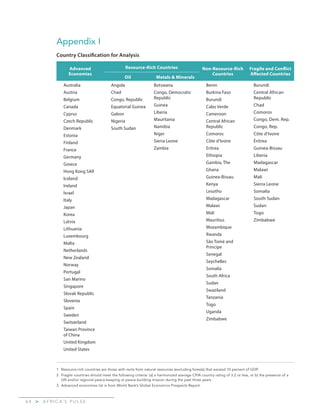
![A F R I C A’ S P U L S E > 1 9
BOX 1.1
Continued
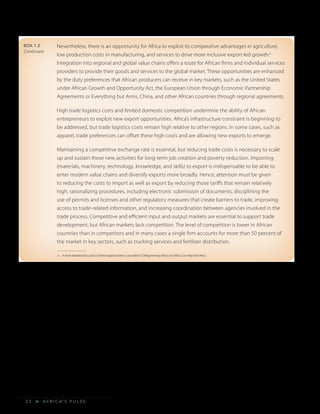
account deficits. For example, a fiscal expansion financed by public debt issuances will increase
private disposable income and private consumption, and lower national saving. This fiscal expansion
will crowd out private investment by lifting domestic interest rates; therefore, a decline in national
saving is matched by an increase in the current account deficit, thus leading to twin fiscal and current
account deficits.
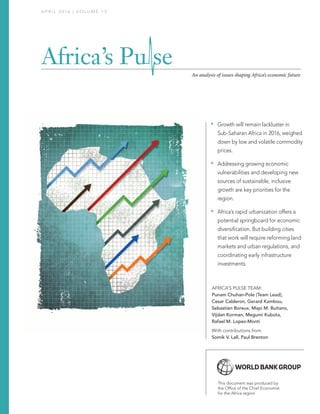
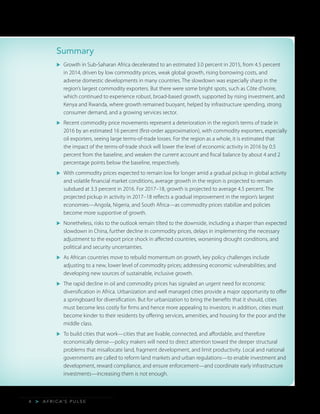
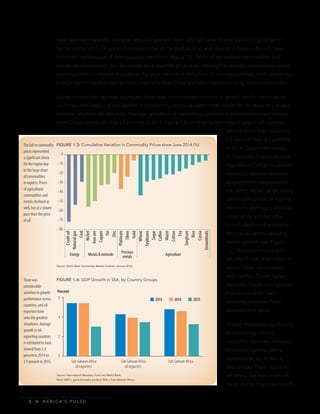
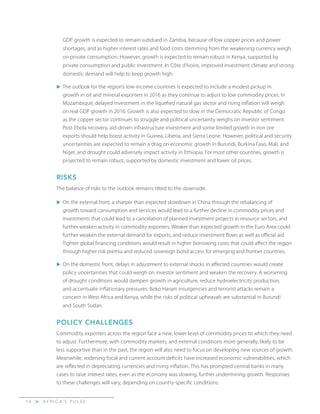
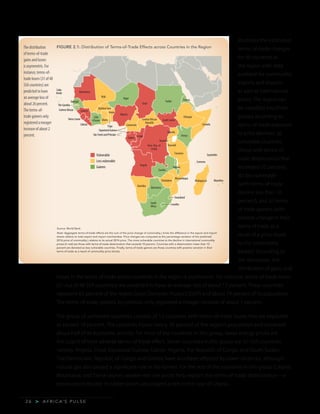
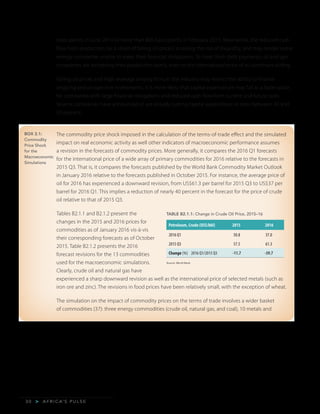
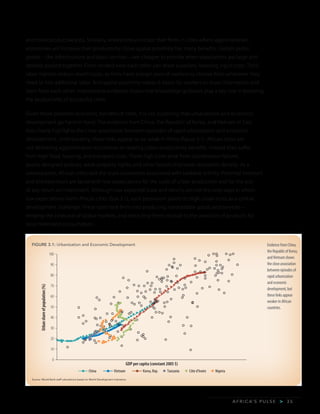
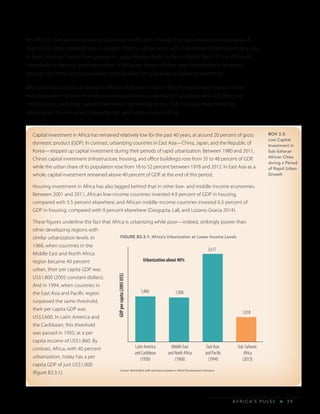
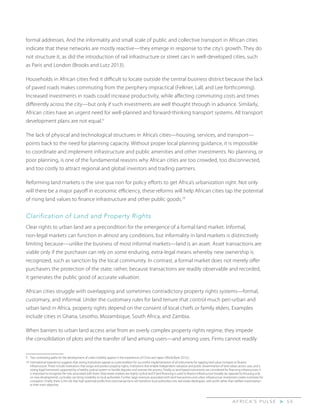
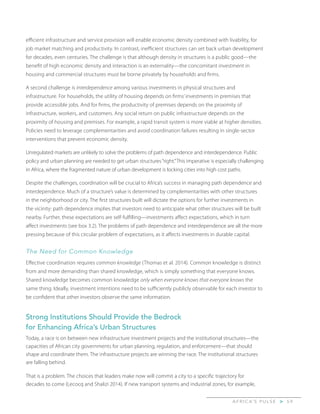
The twin deficits hypothesis is examined for a sample of 47 SSA countries with annual information
from 1980 to 2015. Table B1.1.1 reports the results of regressing the current account balance (as
percentage of GDP) on the fiscal balance and other explanatory variables selected from the literature
(Bartolini and Lahiri 2006), namely, government consumption, public debt, trade openness, GDP
growth, and population growth. Table B1.1.1 (column [1]) reports a simple bivariate regression of
the current account balance on the fiscal balance that yields a positive and significant coefficient.
The regression confirms the hypothesis that fiscal deficits are associated with a deterioration of the
current account balance for SSA countries. The estimated coefficient suggests that if the fiscal balance
declines by 1 percent of GDP, the current account balance deteriorates by 0.16 percent of GDP. When
more control variables are included in the regression (column [2] in table B1.1.1), the estimated
coefficient of fiscal balance not only remains positive and significant, but also becomes larger than
that of the bivariate regression. It shows that a 1 percent of GDP deterioration in the fiscal balance is
associated with a 0.22 percent of GDP widening of the current account deficit.
Although columns [1] and
[2] in table B1.1.1 assume
parameter homogeneity
across countries, the
literature argues that the
transmission process can
be nonlinear because
of the degree of trade
openness or the level of
government indebtedness
(Corsetti and Muller
2006, 2008; Kim and
Roubini 2008; Nickel and
Vansteenkiste 2008; Nickel
and Tudyka 2014).b
Thus,
columns [3] and [4] in
table B1.1.1 introduce the
interaction between fiscal
balance and the level
of public indebtedness
as well as that between
fiscal balance and trade
openness. The findings
TABLE B1.1.1: Testing the Twin Deficits Hypothesis in SSA
Dependent variable: current account balance (% GDP)
Sample of 47 Sub-Saharan African countries, 1980-2015 (annual)
Explanatory variables [1] [2] [3] [4]
Fiscal balance (FB) 0.160* 0.221** 3.195** 0.845
(% GDP) (0.0946) (0.108) (1.193) (1.486)
Government consumption – 0.0270 0.0401 -0.158
(% GDP) (0.164) (0.154) (0.167)
Public Debt (PDbt) – -4.054*** -5.262*** -7.106***
(% GDP, logs) (1.465) (1.456) (1.569)
Trade Openness (TO) – -0.742 -1.925 1.224
(% GDP, logs) (2.450) (2.345) (2.563)
GDP Growth – -0.0281 -0.547 -0.435
(% ) (0.315) (0.361) (0.343)
Population Growth – 0.783 1.283 1.055
(% ) (1.244) (1.183) (1.117)
Interaction: FB x PDbt – – -0.589** -0.972***
(0.236) (0.273)
Interaction: FB x TO – – – 0.835**
(0.346)
Countries 47 45 45 45
Observations 1085 744 744 744
R-squared 0.060 0.275 0.380 0.466
Note. The regression analysis accounts for time effects. Standard errors are in parentheses. *** p<0.01, ** p<0.05, * p<0.1.](https://image.slidesharecdn.com/be1536e7-ae2e-4dea-9e73-6e4cb58b2ab3-160413160338/85/Africas-Pulse-brochure_Vol13-21-320.jpg)
![A F R I C A’ S P U L S E>2 0
BOX 1.1
Continued
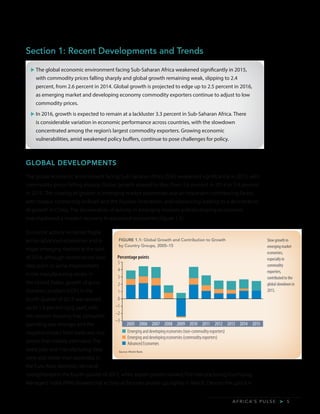
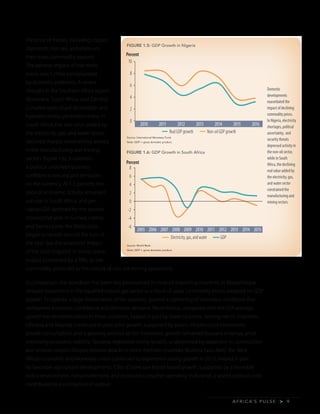
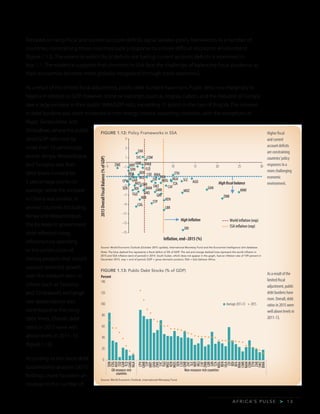
show that fiscal deficits are more likely to be associated with current account deficits in countries with
greater trade integration and lower public debt. The (partial degree of) responsiveness of the current
account deficit to fiscal deficits is about 1.43 for countries with low public debt (around 20 percent of
GDP), and about 0.89 for countries with higher public debt (50 percent of GDP).
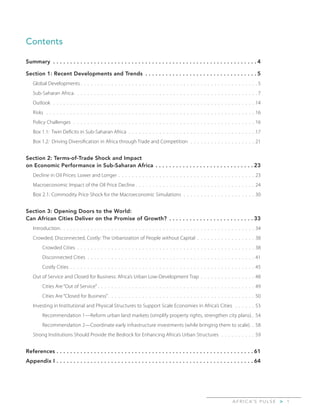
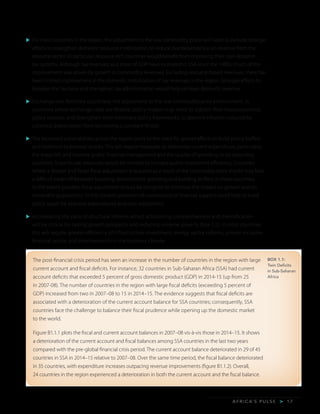
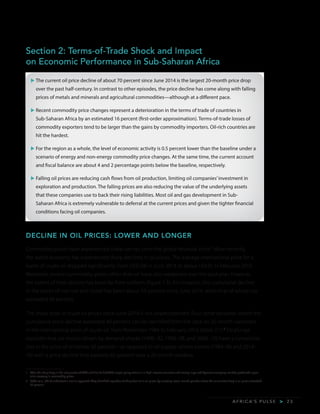
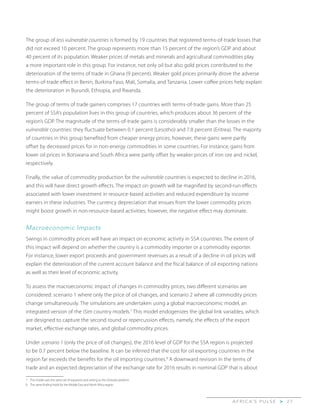
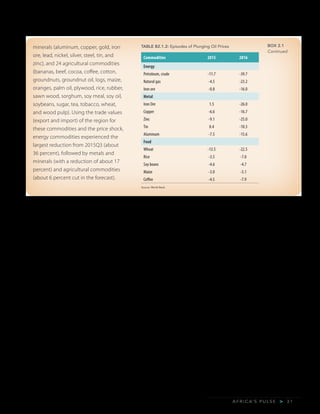
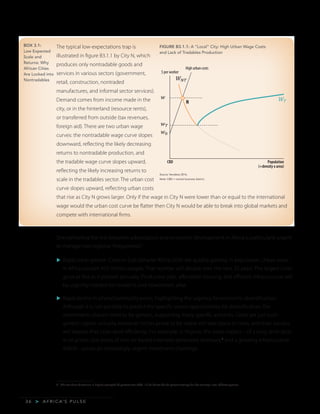
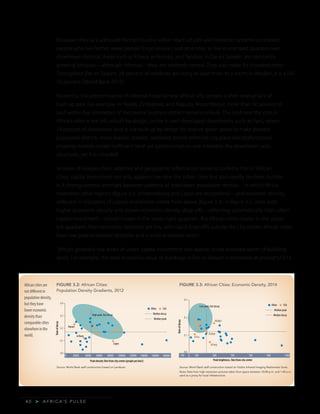
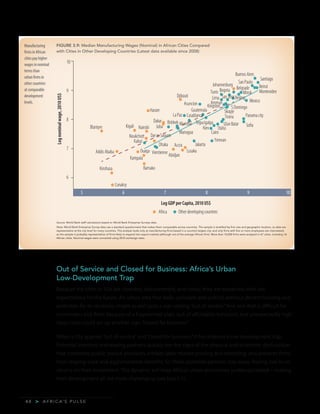
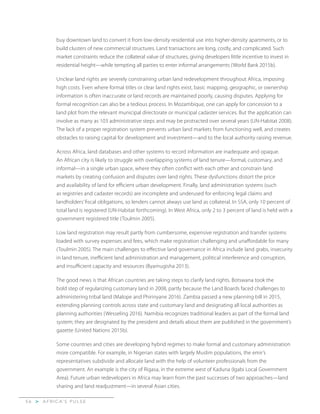
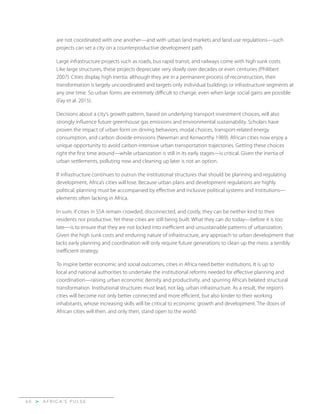
Figure B1.1.3 shows the responsiveness of the current account deficit to movements in the fiscal deficit
conditional on the degree of trade openness (panel a) and the level of government indebtedness
(panel b), while keeping constant the other dimension (at its median level). The solid line represents
the strength (or lack thereof) of the twin deficits hypothesis, while the dotted lines capture the 90
percent confidence interval. This response was evaluated at selected percentiles of the distribution
of these two variables for SSA (5th, 10th, …, 90th, 95th). The figure shows that the nature of the
relationship between the current account and the fiscal balance among countries in the region is
consistent with that of the twin deficits hypothesis: (a) the relationship is stronger the greater is the
degree of international trade integration, and (b) the relationship is stronger the lower is the level of
general government gross debt (as a ratio to GDP).
Figure B1.1.3, panel a, shows that for countries with very low levels of trade openness (below the 5th
percentile—that is, exports and imports of about 25 percent of GDP), the relationship between the
current account deficit and the fiscal deficit is negative and nonsignificant. For countries with trade
openness of about 55 percent of GDP (that is, the 40th to 45th percentile), the relationship is positive
and statistically significant, and the coefficient fluctuates between 0.4 and 0.45. For SSA countries with
a high level of openness (say, the top quartile or real exports and imports that represent 90 percent of
GDP), the coefficient is 0.8. This implies that a 1 percent of GDP increase in the fiscal deficit is associated
with a 0.8 percent of GDP increase in the current account deficit for countries with high trade openness.
Figure B1.1.3, panel b, indicates that for countries with very high levels of government indebtedness
(above the 75th percentile—that is, public debt of about 98–100 percent of GDP), the relationship
FIGURE B1.1.3: Responsiveness of the Current Account Deficit to Movements in the Fiscal Deficit
Notes. The conditional responses were computed using the coefficient regressions in column [4] of table B1.1.1. The responses are evaluated at selected percentiles (5th to 95th)
of trade openness (public debt) while holding public debt (trade openness) at its median value.
(a) Conditional on the degree of trade openness (b) Conditional on the level of government indebtedness
Coefficient Coefficient
–1.5
–1.0
–0.5
0.0
0.5
1.0
1.5
2.0
2.5
5 10 15 20 25 30 35 40 45 50 55 60 65 70 75 80 85 90 95
Percentiles of the distribution of exports and imports (% of GDP)
–1.5
–1.0
–0.5
0.0
0.5
1.0
1.5
2.0
2.5
3.0
5 10 15 20 25 30 35 40 45 50 55 60 65 70 75 80 85 90 95
Percentiles of the distributions of public debt (% of GDP)](https://image.slidesharecdn.com/be1536e7-ae2e-4dea-9e73-6e4cb58b2ab3-160413160338/85/Africas-Pulse-brochure_Vol13-22-320.jpg)

![A F R I C A’ S P U L S E > 6 1
References
Antos, S, N Lozano-Gracia, and S. V. Lall. Forthcoming.“Morphology of African Cities.”World Bank,
Washington, DC.
Arimah, C. B., and D. Adeagbo. 2000.“Compliance with Urban Development and Planning Regulations in
Ibadan, Nigeria.”Habitat International 24 (3): 279–94.
Baffes, John, M. Ayhan Kose, Franziska Ohnsorge, and Stocker. 2015.“The Great Plunge in Oil Prices: Causes,
Consequences, and Policy Responses.”Policy Research Note PRN/15/01, World Bank, Washington, DC.
Balbo, M. 1993.“Urban Planning and the Fragmented City of Developing Countries.”Third World Planning
Review 15 (1): 23–35.
Barro, Robert J. 1974.“Are Government Bonds Net Wealth?”Journal of Political Economy 82 (6): 1095–1117.
Bartolini, Leonardo, and Amartya Lahiri. 2006“Twin Deficits, Twenty Years Later.”Federal Reserve Bank of New
York, Current Issues in Economics and Finance 12 (7): 1–7.
Baruah, N. Forthcoming. Splintered and Segmented? Fragmentation of African Cities Footprints. London
School of Economics, London]
Bernard, L., O. D’Aoust, and P. Jones. 2016. The Urban Wage Premium in Africa: Myth or Reality. World Bank,
Washington DC
Bertaud, A. 2004.“The Spatial Organization of Cities: Deliberate Outcome or Unforeseen Consequence?”
Working Paper 2004-01, University of California, Berkeley, CA.
Birch, E. L. 2008. The Urban and Regional Planning Reader. London and New York: Routledge.
Brennan, J. R., A. Burton, and Y. Lawi. 2007. Dar es Salaam: Histories from an Emerging African Metropolis. Dar es
Salaam/Nairobi: Mkuki na Nyota/BIEA.
Brooks, L., and B. Lutz. 2013.“Vestiges of Transit: Urban Persistence at a Micro Scale.”Trachtenberg School of
Public Policy and Public Administration, George Washington University, Washington, DC.
Byamugisha F. 2013. Securing Africa’s Land for Shared Prosperity. World Bank, Washington, DC.
Collier, P. 2015. African Urbanization: an Analytic Policy Guide. World Bank, Washington, DC.
Collier, P., and P. Jones. 2016.“Transforming Dar es Salaam into a City that Work.”Oxford University , Oxford UK.
Corsetti, Giancarlo, and Gernot J. Muller. 2006.“Twin Deficits: Squaring Theory, Evidence and Common Sense.”
Economic Policy 21 (48): 599–638.
———. 2008.“Twin Deficits, Openness, and the Business Cycle.”Journal of the European Economic Association 6
(2-3): 404–13.
Dasgupta, B., S. V. Lall, and N. Lozano-Gracia. 2014.“Urbanization and Housing Investment.”Policy Research
Working Paper 7110, World Bank, Washington, DC.
De la Rocha, J., and D. Puga. 2016.“Learning by Working in Big Cities.”Review of Economic Studies. Forthcoming.
Fay, M., S. Hallegatte, A. Vogt-Schilb, J. Rozenberg, U. Narloch, and T. Kerr. 2015. Decarbonizing Development.
World Bank, Washington, DC.](https://image.slidesharecdn.com/be1536e7-ae2e-4dea-9e73-6e4cb58b2ab3-160413160338/85/Africas-Pulse-brochure_Vol13-63-320.jpg)


![Canada's State of Trade - Trade & Investment Update 2011 [DFAIT]](https://cdn.slidesharecdn.com/ss_thumbnails/canadasstateoftrade-tradeinvestmentupdate2011dfait-110819101715-phpapp01-thumbnail.jpg?width=640&height=640&fit=bounds)


