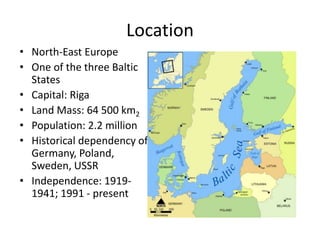
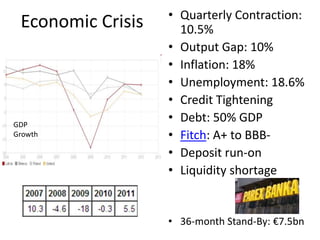
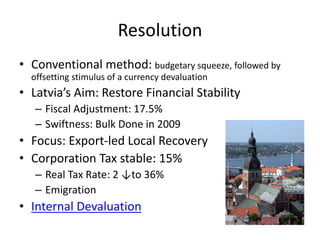
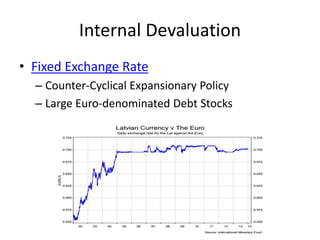
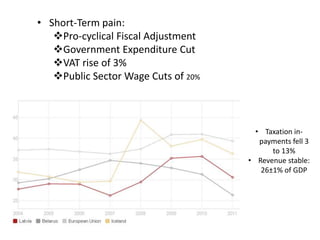
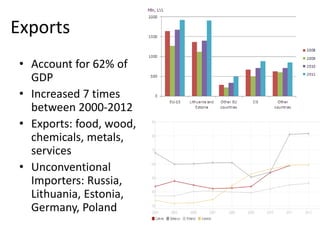
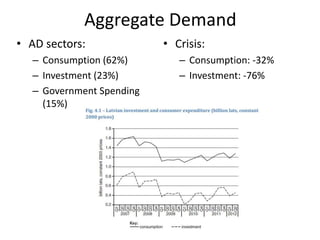
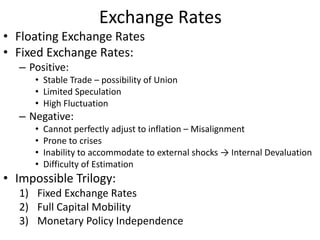
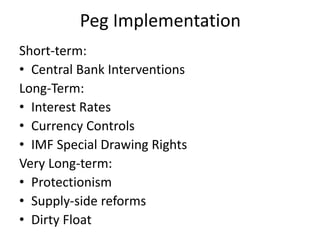
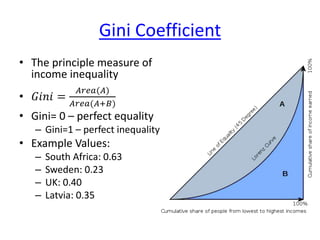
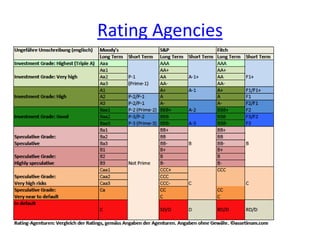
Latvia
Overview of Country Profile.
Analysis of Extract 3
Location
• North-East Europe
• One of the three Baltic
States
• Capital: Riga
• Land Mass: 64 500 km2
• Population: 2.2 million
• Historical dependency of:
Germany, Poland,
Sweden, USSR
• Independence: 1919-
1941; 1991 - present
Demographics
• Shrinking Population:
Low Birth Rate
- Fertility: 1.35 – 221nd globally
EU Migration
• Ethnic Split:
61% Latvians
28% Russians
3% Belarusian
Composition of GDP
• Services: 70%
– IT
– Transport
– Wholesale
– Finance
• Manufacturing: 25%
– Timber
– Foodstuffs
– Petrochemicals
– Metals
– Pharmaceuticals
– Construction
– Candles
• Agriculture 5%
– Dairies
– Cereals
– Potatoes
– Meat
Standards of Living
• GDP per Capita: $21 920
GDP per Capita
HDI
• Index: 0.814
• Very High Income
Group
2002-2007
• GDP (PPP): $33.7bn
• Real Growth Rate: 4%
• Causes:
– EU Accession 2004
– Interest Rates
– Business Confidence
– Housing Market
– Consumption Boom
– Credit Boom:
Inventories/Durables
– Asset Price Bubble
GDP
Growth
Economic Crisis • Quarterly Contraction:
10.5%
• Output Gap: 10%
• Inflation: 18%
• Unemployment: 18.6%
• Credit Tightening
• Debt: 50% GDP
• Fitch: A+ to BBB-
• Deposit run-on
• Liquidity shortage
• 36-month Stand-By: €7.5bn
• Aims of Bailout (Conditionality):
– stem the loss of bank deposits and international
reserves
– restore confidence in the banking and support
private debt restructuring;
– limit the substantial widening in the budget deficit
– prepare for early fulfillment of the Maastricht
criteria
– Structural reforms aimed at rebuilding
competitiveness
Resolution
• Conventional method: budgetary squeeze, followed by
offsetting stimulus of a currency devaluation
• Latvia’s Aim: Restore Financial Stability
– Fiscal Adjustment: 17.5%
– Swiftness: Bulk Done in 2009
• Focus: Export-led Local Recovery
• Corporation Tax stable: 15%
– Real Tax Rate: 2 ↓to 36%
– Emigration
• Internal Devaluation
Internal Devaluation
• Fixed Exchange Rate
– Counter-Cyclical Expansionary Policy
– Large Euro-denominated Debt Stocks
• Taxation in-
payments fell 3
to 13%
• Revenue stable:
26±1% of GDP
• Short-Term pain:
Pro-cyclical Fiscal Adjustment
Government Expenditure Cut
VAT rise of 3%
Public Sector Wage Cuts of 20%
• Squeeze on Labour Costs
– Fall in Real Wages, mostly in public sector
– Real Unit Labour Costs fall of 20%
– Increased Productivity
• High Interest Rates
Internal Devaluation Assessed
Iceland Fixed Exchange Rate : NEER devaluation of 50%
• The Crisis in Latvia: deeper (20%) and V-shaped
– Iceland: 10%
• Faster and More Sustainable Recovery in Latvia: 4% annual GDP:
– Spare Capacity
– Iceland: 2%, but relating to pre-crisis size of economy
• Exports: -10%
– Iceland: +15%
• Unemployment: peak of 18%, 2013: 9.8%
– 9%. 2013: 5%
• Inflation: 9% peak followed by Stability at 2%
– Iceland: 12% (2009), continues at one of highest in Europe
• Sovereign Debt: Denominator Effect
– Increasing Debt
• Similar Current Account situation
• Competitiveness Improved
• Reassurance of Investors
IMF-Parex
• Restoration of healthy levels of GDP
• Unemployment down 3%
• Competitiveness:
– Macroeconomic Environment:
– Labour Efficiency: 18 ↓ to 27th
– Investors Confidence: 93rd to 29th
• Market Confidence: BBB+
• Improved Government Finances: December 2012 US$ Issue at 2.75%
• Early IMF Repayment
• Current Account Normalisation
• Fiscal Discipline Law
• National Strategic Plan
Results
Competitiveness
• Transition Stage:
Efficiency→ Innovation
Positive Developments:
 Index Rank:
44th (2007)
70th (2010)
52nd (2013)
 Labour Market
Competitiveness
Estonia Rank: 34th
Inflation Rate
Latest Developments
IMF Concluding Statement: 10/3/14
“The Outlook for 2014 is Broadly Favourable”
Praise:
• 4%: Fastest Rate of Growth in Europe
• Real Effective Exchange Rate is in line with
fundamentals
• Unemployment: 11.3%
• The Output Gap has been largely Closed
• A Balanced Recovery: C, I, X
Gross National Savings
• Short-Term Warnings : Dependency on
Performance of neighbouring economies
– Escalation of Ukrainian Crisis
– Tapering of Unconventional Monetary Policy
– Contracting Banking Credit, hampered by private
sector debt overhang
– Closure of Output Gap
• Recommendations:
– Maintain Competitiveness through Structural Reforms
– Fiscal Consolidation: Income Tax
– Reinforcement of security net
– Reduction in reliance on foreign deposits
– Resuscitate stagnant banking sector
Private Sector Credit
Bank Asset to Capital Ratio
Recommendations
Medium to Long-Term:
• Land Infrastructure
• Liberalisation of Energy Market
• Emphasis on Vocational and Higher Education
• Strengthening of Judicial system, especially
liabilities
• Reducing the Grey Economy
• Reconsideration of tax system to improve
inequality: Land, Consumption, Thresholds
Inequality
and
Innovation
Government Finances
Government
Debt (% GDP)
Budget Surplus 2012: -1.8%*
• Speculative Investment Bubble
• “Market Stability is Destabilizing”
• Stages:
– Hedge Borrower: Cash Flows<=Debt-associated payments
Example: mortgages
– Speculative Borrower: Overconfident Euphoria
Example: interest-only loan
– Ponzi Borrower: Excess Debt Accumulates
Example: Negative Amortization Loan
– Debt Exceeds Repayment Capabilities – Minsky Moment
• Stood for better understanding of finance and of
ending overreliance on mathematical models
Hyman Minsky Crisis Theory
Exports
• Account for 62% of
GDP
• Increased 7 times
between 2000-2012
• Exports: food, wood,
chemicals, metals,
services
• Unconventional
Importers: Russia,
Lithuania, Estonia,
Germany, Poland
Imports
Closer Neighbouring States
Industrial Production
Trade/GDP = 118%
Balance of Payments
Aggregate Demand
• AD sectors:
– Consumption (62%)
– Investment (23%)
– Government Spending
(15%)
• Crisis:
– Consumption: -32%
– Investment: -76%
Foreign Direct Investment
Net
The End
Not Quite yet
Key Definitions
• Purchasing Power Parity: the sum value of all
goods and services produced in a country valued
in US dollars
• Human Development Index: a composite statistic
of life expectancy, education, and income which
is used to rank countries into four tiers
of development
• High-technology exports: products with high
R&D intensity, such as in aerospace, computers,
pharmaceuticals, scientific instruments, and
electrical machinery
Exchange Rates
• Nominal Exchange Rate (S) – price of domestic
money in terms of foreign money
• Real Exchange Rate (𝜎) – the relative price of
our goods and services in terms of foreign
goods
𝜎 =
𝑃
𝑃∗/𝑆
• NEER: Nominal Effective Exchange Rate
• REER: Real Effective Exchange Rate
Exchange Rates
• Floating Exchange Rates
• Fixed Exchange Rates:
– Positive:
• Stable Trade – possibility of Union
• Limited Speculation
• High Fluctuation
– Negative:
• Cannot perfectly adjust to inflation – Misalignment
• Prone to crises
• Inability to accommodate to external shocks → Internal Devaluation
• Difficulty of Estimation
• Impossible Trilogy:
1) Fixed Exchange Rates
2) Full Capital Mobility
3) Monetary Policy Independence
Peg Implementation
Short-term:
• Central Bank Interventions
Long-Term:
• Interest Rates
• Currency Controls
• IMF Special Drawing Rights
Very Long-term:
• Protectionism
• Supply-side reforms
• Dirty Float
Currency Blocs
Advantages:
• Reduced Exchange Rate Costs
– Commissions and charges
– Risk factors of currency fluctuations
• Greater Price Transparency
– Comparison of prices
– Lower price discrimination
• Greater Business Confidence
– Stability promotes investment
• Macroeconomic Management
Disadvantages:
• Transition Costs
• Less Monetary Independence
Gini Coefficient
• The principle measure of
income inequality
• 𝐺𝑖𝑛𝑖 =
𝐴𝑟𝑒𝑎(𝐴)
𝐴𝑟𝑒𝑎(𝐴+𝐵)
• Gini= 0 – perfect equality
– Gini=1 – perfect inequality
• Example Values:
– South Africa: 0.63
– Sweden: 0.23
– UK: 0.40
– Latvia: 0.35
Balance of Payments
• Export of Goods
• Import of Goods
• Export of Services
• Import of Services
• Net Royalties
• Net Investment Income
• Net International Aid
• Gross Inward Direct Investment
• Gross Outward Direct Investment
• Gross Inward Portfolio Investment
• Gross Outward Portfolio
Investment
• Short-Term Inward Capital Flows
• Short-Term Outward Capital Flows
• Errors and Omissions
• Official Intervention Account
Trade Balance
Current Account Balance
Capital Account Balance
Current Account + Financial Account + Official Intervention=0
Balance of Payments
Export of Goods
Import of Goods
Export of Services
Import of Services
Net Investment Income/Royalties
Net International Aid/Transfers
Gross Inward Direct Investment
Gross Outward Direct Investment
Gross Inward Portfolio Investment
Gross Outward Portfolio Investment
Short-Term Inward Capital Flows
Short-Term Outward Capital Flows
Errors and Omissions
Official Intervention Account
Trade Balance
Current Account Balance
Capital Account Balance
Current Account + Financial Account + Official Intervention=0
Deficit on the Current Account:
• Excess Supply of Currency
– Depreciation of Currency
– Restoration of Equilibrium
• Exports
• Asset Attractiveness
• Net Leakage of Demand
• Loss of Jobs
• Long-term Confidence
Competitiveness
1) Price Competitiveness:
• Relative Unit Labour Costs – labour cost per unit
of output
2) Non-Price Competitiveness:
• Regulation:
• Environmental
• Employment
• Pensions
• Taxation
World Economic Forum
Global
Competitiveness Index
Rating Agencies
Internal Devaluation
• Definition: pro-cyclical measure which occurs
when a country attempts to improve
competitiveness through lowering unit wage
costs and increasing labour productivity,
rather than through currency depreciation
• Latvia had no choice but to internally devalue
due to Lat peg.
Maastricht Criteria
(part of the “Treaty on European Union”, 1992)
• Fifth Stage of Integration: European Economic and
Monetary Union
• Criteria:
1) Inflation: no more than 1.5% above average of Top-3
European economies
2)
𝐺𝑜𝑣𝑒𝑟𝑛𝑚𝑒𝑛𝑡 𝐷𝑒𝑓𝑖𝑐𝑖𝑡
𝐺𝐷𝑃
≤3% or converging to this value
3)
𝐺𝑜𝑣𝑒𝑟𝑛𝑚𝑒𝑛𝑡 𝐷𝑒𝑏𝑡
𝐺𝐷𝑃
≤ 60% or converging
4) Exchange Rate Mechanism Membership with two
years stable peg
5) 10yr Government Bonds yields: no more than 2%
above Top-3 European economies
• Surveillance Role
– Article IV: Annual Visits and Evaluations
– World Economic Outlook
– Enhanced Surveillance
– Macroeconomic Guidance
– Statistical Innovations
• Lender of Last Resort: “the International Fire-fighter”
– Duration of Loan: 1-4 years
– Highest Priority
– Types:
• Special Drawing Rights (SDR) – an allocated line of credit based on
each country’s annual contributions
• Concessional Loans
• Stand-by Arrangements
Founded: Bretton Woods (1945); 188 members; Centre: Washington DC
Directorship: Board of Governors, Board of Executive Directors
• SDRs are evaluated according to each country’s
annual contributions, which are themselves based on
GDP
– £1 = SDR1.08
• Votes amongst the Executive Directors are
distributed accordingly
Latvia 142 0.06%
Special Drawing Rights and Votes
Denominator Effect
NOW SERVING 50 EUROPEAN
DESTINATIONS VIA RIGA
JURMALA:
FROM GATWICK
MOSCOW:
FROM GATWICK
Jurmala
Ssa SALE RIGA:
FROM GATWICK
€85
http://www.economist.com/blogs/charlemagne/2012/06/lessons-
latvia?zid=307&ah=5e80419d1bc9821ebe173f4f0f060a07
List of Useful Websites
• IMF
• World Bank
• CIA World Factbook
• The New York Times
– Paul Krugman Blogs
• The Economist
– Login: library@henleycol.ac.uk
– Password: library
• BBC Business
– Robert Peston
– Linda Yueh
Quiz Question
Balance of Payments
Trade Balance 67.6
Balance on Goods and Services 68.1
Net Investment Income/Royalties -35.4
Aid/Transfers -45.0
Direct Investment Abroad -228.6
Direct Investment Inward 146.1
Portfolio Investment Assets -258.3
Portfolio Investment Liabilities 290.1
Capital (Financial) Account -43.2
Other Investment Assets, eg Financial Derivatives -219.2
Other Investment Liabilities 226.5
Errors and Omissions ?
Official Intervention Account (Reserves) 16.9
Answer : -38.6

Latvia mail Exchange (latest)

  • 1.
    Latvia Overview of CountryProfile. Analysis of Extract 3
  • 2.
    Location • North-East Europe •One of the three Baltic States • Capital: Riga • Land Mass: 64 500 km2 • Population: 2.2 million • Historical dependency of: Germany, Poland, Sweden, USSR • Independence: 1919- 1941; 1991 - present
  • 3.
    Demographics • Shrinking Population: LowBirth Rate - Fertility: 1.35 – 221nd globally EU Migration • Ethnic Split: 61% Latvians 28% Russians 3% Belarusian
  • 4.
    Composition of GDP •Services: 70% – IT – Transport – Wholesale – Finance • Manufacturing: 25% – Timber – Foodstuffs – Petrochemicals – Metals – Pharmaceuticals – Construction – Candles • Agriculture 5% – Dairies – Cereals – Potatoes – Meat
  • 5.
    Standards of Living •GDP per Capita: $21 920 GDP per Capita
  • 6.
    HDI • Index: 0.814 •Very High Income Group
  • 7.
    2002-2007 • GDP (PPP):$33.7bn • Real Growth Rate: 4% • Causes: – EU Accession 2004 – Interest Rates – Business Confidence – Housing Market – Consumption Boom – Credit Boom: Inventories/Durables – Asset Price Bubble
  • 8.
    GDP Growth Economic Crisis •Quarterly Contraction: 10.5% • Output Gap: 10% • Inflation: 18% • Unemployment: 18.6% • Credit Tightening • Debt: 50% GDP • Fitch: A+ to BBB- • Deposit run-on • Liquidity shortage • 36-month Stand-By: €7.5bn
  • 9.
    • Aims ofBailout (Conditionality): – stem the loss of bank deposits and international reserves – restore confidence in the banking and support private debt restructuring; – limit the substantial widening in the budget deficit – prepare for early fulfillment of the Maastricht criteria – Structural reforms aimed at rebuilding competitiveness
  • 10.
    Resolution • Conventional method:budgetary squeeze, followed by offsetting stimulus of a currency devaluation • Latvia’s Aim: Restore Financial Stability – Fiscal Adjustment: 17.5% – Swiftness: Bulk Done in 2009 • Focus: Export-led Local Recovery • Corporation Tax stable: 15% – Real Tax Rate: 2 ↓to 36% – Emigration • Internal Devaluation
  • 11.
    Internal Devaluation • FixedExchange Rate – Counter-Cyclical Expansionary Policy – Large Euro-denominated Debt Stocks
  • 12.
    • Taxation in- paymentsfell 3 to 13% • Revenue stable: 26±1% of GDP • Short-Term pain: Pro-cyclical Fiscal Adjustment Government Expenditure Cut VAT rise of 3% Public Sector Wage Cuts of 20%
  • 13.
    • Squeeze onLabour Costs – Fall in Real Wages, mostly in public sector – Real Unit Labour Costs fall of 20% – Increased Productivity
  • 14.
  • 15.
    Internal Devaluation Assessed IcelandFixed Exchange Rate : NEER devaluation of 50% • The Crisis in Latvia: deeper (20%) and V-shaped – Iceland: 10% • Faster and More Sustainable Recovery in Latvia: 4% annual GDP: – Spare Capacity – Iceland: 2%, but relating to pre-crisis size of economy • Exports: -10% – Iceland: +15% • Unemployment: peak of 18%, 2013: 9.8% – 9%. 2013: 5% • Inflation: 9% peak followed by Stability at 2% – Iceland: 12% (2009), continues at one of highest in Europe • Sovereign Debt: Denominator Effect – Increasing Debt • Similar Current Account situation • Competitiveness Improved • Reassurance of Investors
  • 16.
    IMF-Parex • Restoration ofhealthy levels of GDP • Unemployment down 3% • Competitiveness: – Macroeconomic Environment: – Labour Efficiency: 18 ↓ to 27th – Investors Confidence: 93rd to 29th • Market Confidence: BBB+ • Improved Government Finances: December 2012 US$ Issue at 2.75% • Early IMF Repayment • Current Account Normalisation • Fiscal Discipline Law • National Strategic Plan Results
  • 17.
    Competitiveness • Transition Stage: Efficiency→Innovation Positive Developments:  Index Rank: 44th (2007) 70th (2010) 52nd (2013)  Labour Market Competitiveness Estonia Rank: 34th
  • 18.
  • 19.
  • 20.
    IMF Concluding Statement:10/3/14 “The Outlook for 2014 is Broadly Favourable” Praise: • 4%: Fastest Rate of Growth in Europe • Real Effective Exchange Rate is in line with fundamentals • Unemployment: 11.3% • The Output Gap has been largely Closed • A Balanced Recovery: C, I, X
  • 21.
  • 22.
    • Short-Term Warnings: Dependency on Performance of neighbouring economies – Escalation of Ukrainian Crisis – Tapering of Unconventional Monetary Policy – Contracting Banking Credit, hampered by private sector debt overhang – Closure of Output Gap • Recommendations: – Maintain Competitiveness through Structural Reforms – Fiscal Consolidation: Income Tax – Reinforcement of security net – Reduction in reliance on foreign deposits – Resuscitate stagnant banking sector
  • 23.
  • 24.
    Bank Asset toCapital Ratio
  • 25.
    Recommendations Medium to Long-Term: •Land Infrastructure • Liberalisation of Energy Market • Emphasis on Vocational and Higher Education • Strengthening of Judicial system, especially liabilities • Reducing the Grey Economy • Reconsideration of tax system to improve inequality: Land, Consumption, Thresholds
  • 26.
  • 27.
    Government Finances Government Debt (%GDP) Budget Surplus 2012: -1.8%*
  • 28.
    • Speculative InvestmentBubble • “Market Stability is Destabilizing” • Stages: – Hedge Borrower: Cash Flows<=Debt-associated payments Example: mortgages – Speculative Borrower: Overconfident Euphoria Example: interest-only loan – Ponzi Borrower: Excess Debt Accumulates Example: Negative Amortization Loan – Debt Exceeds Repayment Capabilities – Minsky Moment • Stood for better understanding of finance and of ending overreliance on mathematical models Hyman Minsky Crisis Theory
  • 29.
    Exports • Account for62% of GDP • Increased 7 times between 2000-2012 • Exports: food, wood, chemicals, metals, services • Unconventional Importers: Russia, Lithuania, Estonia, Germany, Poland
  • 30.
  • 31.
  • 32.
  • 33.
    Aggregate Demand • ADsectors: – Consumption (62%) – Investment (23%) – Government Spending (15%) • Crisis: – Consumption: -32% – Investment: -76%
  • 34.
  • 35.
  • 36.
    Key Definitions • PurchasingPower Parity: the sum value of all goods and services produced in a country valued in US dollars • Human Development Index: a composite statistic of life expectancy, education, and income which is used to rank countries into four tiers of development • High-technology exports: products with high R&D intensity, such as in aerospace, computers, pharmaceuticals, scientific instruments, and electrical machinery
  • 37.
    Exchange Rates • NominalExchange Rate (S) – price of domestic money in terms of foreign money • Real Exchange Rate (𝜎) – the relative price of our goods and services in terms of foreign goods 𝜎 = 𝑃 𝑃∗/𝑆 • NEER: Nominal Effective Exchange Rate • REER: Real Effective Exchange Rate
  • 38.
    Exchange Rates • FloatingExchange Rates • Fixed Exchange Rates: – Positive: • Stable Trade – possibility of Union • Limited Speculation • High Fluctuation – Negative: • Cannot perfectly adjust to inflation – Misalignment • Prone to crises • Inability to accommodate to external shocks → Internal Devaluation • Difficulty of Estimation • Impossible Trilogy: 1) Fixed Exchange Rates 2) Full Capital Mobility 3) Monetary Policy Independence
  • 39.
    Peg Implementation Short-term: • CentralBank Interventions Long-Term: • Interest Rates • Currency Controls • IMF Special Drawing Rights Very Long-term: • Protectionism • Supply-side reforms • Dirty Float
  • 40.
    Currency Blocs Advantages: • ReducedExchange Rate Costs – Commissions and charges – Risk factors of currency fluctuations • Greater Price Transparency – Comparison of prices – Lower price discrimination • Greater Business Confidence – Stability promotes investment • Macroeconomic Management Disadvantages: • Transition Costs • Less Monetary Independence
  • 41.
    Gini Coefficient • Theprinciple measure of income inequality • 𝐺𝑖𝑛𝑖 = 𝐴𝑟𝑒𝑎(𝐴) 𝐴𝑟𝑒𝑎(𝐴+𝐵) • Gini= 0 – perfect equality – Gini=1 – perfect inequality • Example Values: – South Africa: 0.63 – Sweden: 0.23 – UK: 0.40 – Latvia: 0.35
  • 42.
    Balance of Payments •Export of Goods • Import of Goods • Export of Services • Import of Services • Net Royalties • Net Investment Income • Net International Aid • Gross Inward Direct Investment • Gross Outward Direct Investment • Gross Inward Portfolio Investment • Gross Outward Portfolio Investment • Short-Term Inward Capital Flows • Short-Term Outward Capital Flows • Errors and Omissions • Official Intervention Account Trade Balance Current Account Balance Capital Account Balance Current Account + Financial Account + Official Intervention=0
  • 43.
    Balance of Payments Exportof Goods Import of Goods Export of Services Import of Services Net Investment Income/Royalties Net International Aid/Transfers Gross Inward Direct Investment Gross Outward Direct Investment Gross Inward Portfolio Investment Gross Outward Portfolio Investment Short-Term Inward Capital Flows Short-Term Outward Capital Flows Errors and Omissions Official Intervention Account Trade Balance Current Account Balance Capital Account Balance Current Account + Financial Account + Official Intervention=0
  • 44.
    Deficit on theCurrent Account: • Excess Supply of Currency – Depreciation of Currency – Restoration of Equilibrium • Exports • Asset Attractiveness • Net Leakage of Demand • Loss of Jobs • Long-term Confidence
  • 45.
    Competitiveness 1) Price Competitiveness: •Relative Unit Labour Costs – labour cost per unit of output 2) Non-Price Competitiveness: • Regulation: • Environmental • Employment • Pensions • Taxation
  • 46.
  • 47.
  • 48.
    Internal Devaluation • Definition:pro-cyclical measure which occurs when a country attempts to improve competitiveness through lowering unit wage costs and increasing labour productivity, rather than through currency depreciation • Latvia had no choice but to internally devalue due to Lat peg.
  • 49.
    Maastricht Criteria (part ofthe “Treaty on European Union”, 1992) • Fifth Stage of Integration: European Economic and Monetary Union • Criteria: 1) Inflation: no more than 1.5% above average of Top-3 European economies 2) 𝐺𝑜𝑣𝑒𝑟𝑛𝑚𝑒𝑛𝑡 𝐷𝑒𝑓𝑖𝑐𝑖𝑡 𝐺𝐷𝑃 ≤3% or converging to this value 3) 𝐺𝑜𝑣𝑒𝑟𝑛𝑚𝑒𝑛𝑡 𝐷𝑒𝑏𝑡 𝐺𝐷𝑃 ≤ 60% or converging 4) Exchange Rate Mechanism Membership with two years stable peg 5) 10yr Government Bonds yields: no more than 2% above Top-3 European economies
  • 50.
    • Surveillance Role –Article IV: Annual Visits and Evaluations – World Economic Outlook – Enhanced Surveillance – Macroeconomic Guidance – Statistical Innovations • Lender of Last Resort: “the International Fire-fighter” – Duration of Loan: 1-4 years – Highest Priority – Types: • Special Drawing Rights (SDR) – an allocated line of credit based on each country’s annual contributions • Concessional Loans • Stand-by Arrangements Founded: Bretton Woods (1945); 188 members; Centre: Washington DC Directorship: Board of Governors, Board of Executive Directors
  • 51.
    • SDRs areevaluated according to each country’s annual contributions, which are themselves based on GDP – £1 = SDR1.08 • Votes amongst the Executive Directors are distributed accordingly Latvia 142 0.06% Special Drawing Rights and Votes
  • 52.
  • 54.
    NOW SERVING 50EUROPEAN DESTINATIONS VIA RIGA JURMALA: FROM GATWICK MOSCOW: FROM GATWICK Jurmala Ssa SALE RIGA: FROM GATWICK €85 http://www.economist.com/blogs/charlemagne/2012/06/lessons- latvia?zid=307&ah=5e80419d1bc9821ebe173f4f0f060a07
  • 55.
    List of UsefulWebsites • IMF • World Bank • CIA World Factbook • The New York Times – Paul Krugman Blogs • The Economist – Login: library@henleycol.ac.uk – Password: library • BBC Business – Robert Peston – Linda Yueh
  • 56.
    Quiz Question Balance ofPayments Trade Balance 67.6 Balance on Goods and Services 68.1 Net Investment Income/Royalties -35.4 Aid/Transfers -45.0 Direct Investment Abroad -228.6 Direct Investment Inward 146.1 Portfolio Investment Assets -258.3 Portfolio Investment Liabilities 290.1 Capital (Financial) Account -43.2 Other Investment Assets, eg Financial Derivatives -219.2 Other Investment Liabilities 226.5 Errors and Omissions ? Official Intervention Account (Reserves) 16.9 Answer : -38.6

Editor's Notes

  • #2 http://www.em.gov.lv/em/2nd/?lng=en&cat=30288 http://data.worldbank.org/indicator/PA.NUS.FCRF/countries/LV-XC?display=graph http://www.youtube.com/watch?v=8CdzQkl4PRU http://www.tradingeconomics.com/latvia/currency http://www.youtube.com/watch?v=SrvVkTwQqtU
  • #3 UK: 243 000 Hanseatic League http://www.youtube.com/watch?v=cVYjS0v6M4A Von Rumpoy: http://www.youtube.com/watch?v=e_KWADGiUY8 Mockery of Int Dev: http://www.youtube.com/watch?v=kdLQ9L01CNU Rus Lang: http://www.youtube.com/watch?v=hPJiGlcNxeY DW Lat Recov: http://www.youtube.com/watch?v=WBV4tijTnio
  • #4 Birth Rate: 9/1000 Population shrinkage: average of 10 000/year since 2000 Population peak: 2.7 million, ie loss of 0.5mln
  • #5 GDP pc very fast up 1999: 4200, but lowest amongst Baltics + Poland http://balticexport.com/?article=100-lielakie-nodrosina-pusi-visa-eksporta
  • #7 UK: 0.875; Norway: 0.955. Lowest in E. Europe
  • #8 109th, 2nd largest Baltic UK: 2378bn Int Rate: avg 8-9%, UK 5% Car sales 7* Graph is of Savings
  • #9 Previously 4% stable growth Junk rate Decline Outpus 20% peak-trough Debt: 22.5 – 50% GDP (2008-2010) Unemployment 20% Non-Performing Loans: 20% of total
  • #11 If not: loss of confidence, outflow of investment and labour; bankruptcies on mortgages
  • #12 http://www.imf.org/external/np/sec/pr/2008/pr08345.htm
  • #16 Nominal effective exchange rate High exports due to usa not inflation but defltor
  • #17 Fiscal Tightening: small-scale Relative Unit Labour Costs
  • #29 loan payment for any period is less than the interest charged over that period so that the outstanding balance of the loan increases
  • #30 Russia 20, Lithuania 15, Estonia 12, Germany 7, Poland 5, Sweden
  • #36 Ventas rumba
  • #37 May not be a direct equivalent (limitation)
  • #39 ERML Capital Controls (different inflation rates allowed) German leadership of monetary policy Cessation of Fixed
  • #40 Central Bank graphs
  • #41 Stiffling of growth One size fits all Structural patterns different regions require different exch rates