Download to read offline


![14
G. Ganev, M. Jarociñski, R. Lubenova, P. WoŸniak
CASE Reports No. 38
2.3. Conclusions from the Model
The model illustrates how credibility of the exchange
rate policy affects the performance of an economy under-going
a stabilization program. A lower credibility leads to a
slower disinflation and a stronger real appreciation, which
can increase the output cost of disinflation and undermine
the credibility of the exchange rate policy in the future
(although the latter two aspects are not reflected in the
model). The model is capable of reproducing the pheno-menon
of a fall of monetization in the early phase of stabi-lization,
which has puzzled economists [see: DeBroeck
et al. (1997)].
Apart from illustrating the advantages of a more credible
exchange rate policy, the model has implications for the
empirical investigation of credibility. It allows to formalize it
in terms of the parameter θ and examine it in real life
economies, as long as we accept the model assumptions.
The model suggests that the speed of disinflation, the
scope of real appreciation and the dynamics of the level of
monetization can be used as indicators of credibility. The
first two factors are difficult to work with in practice,
because the assumptions of the model are too strong.
There are many factors, apart from credibility, which can
influence the speed of disinflation. These are for example:
exogenous price shocks, institutional arrangements (back-ward
looking vs. forward looking indexation), relative price
adjustments in conditions of downward price rigidity. Both
the behavior of inflation and the real exchange rate will be
significantly influenced by the degree of over- or undervalu-ation
of the real exchange rate in the beginning of stabiliza-tion.
This degree is not straightforward to assess, and the
Purchasing Power Parity is likely to change along with the
real transformations underway in the economy.
More promising is the use of the level of monetization as
a source of information about credibility. Of course, the
level of monetization can be, in a real life economy, also
influenced by factors not featuring in the model:
The inertia of changing habits of the population,
entrenched customs regarding the use of domestic and fo-reign
money can carry over to the level of monetization. It
should be kept in mind that actual evolution of credibility
can be more volatile, than what would be implied by the
evolution of the monetization level.
Level of development of the banking sector can also
influence the level of broad money monetization. A more
efficient, safer and more customer friendly banking sector
can attract more deposits, and thus contribute to a higher
broad money monetization. The characteristics of the
banking sector can evolve over time, influencing the
dynamics of monetization regardless of depreciation
expectations. However, in the short and medium term this
effect should not change the dynamics of monetization in a
dramatic fashion.
The third potential problem lies in the speed of clearing
of the money market. The model bases on the assumption
that the money market is in equilibrium, i.e. that the money
supply is adjusted to the money demand (the exchange rate
is fixed, so money supply becomes endogenous). Violation
of this condition distorts the information about credibility
that is inferred from the money demand. This problem can
be partially controlled for by looking at the rate of inflation.
A high rate of inflation accompanying a rapidly falling mone-tization
can mean, that the adjustment of the real money
balances is not complete, and is occurring both by reducing
money holding and by a price growth. Such situations hap-pen
often in the early phase of stabilization. A growth of
monetization accompanied by a fall in inflation suggests the
opposite situation: that an upward adjustment of real ba-lances
might still be underway.
With these caveats in mind one can check how much
information on credibility of exchange rate policies is con-tained
in the monetization figures of transition economies.](https://image.slidesharecdn.com/rc38-141023050422-conversion-gate02/85/CASE-Network-Report-38-Credibility-of-the-Exchange-Rate-Policy-in-Transition-Countries-14-320.jpg)
![15
Credibility of the Exchange Rate Policy in Transition Countries
Part 3
Credibility of the Exchange Rate Policy in Poland
3.1. Poland's Stabilization Program and
the Policy of the National Bank of Poland
Poland's ambitious "shock therapy" was initiated on Ja-nuary
1st 1990. Along with radical liberalization of prices
and deregulation of the economy, a number of restrictive
monetary measures were introduced. One of the pillars of
the stabilization program was internal convertibility of zloty
along an stabilizing of the official exchange rate. These were
augmented by the policies of the central bank aiming to
control money supply: rationing credit to enterprises, active
use of reserve requirements and open market operations.
The stabilization program was designed using the guide-lines
of the IMF and its approval by the Fund enabled Poland
to take advantage of the stand-by program in 1990 and sev-eral
consecutive years. This program besides providing vital
tranches of credit, undoubtedly gave Polish stabilization
efforts external credibility. Additionally, the credibility was
enhanced by establishing the so-called stabilization fund of $
1 billion made up of contributions by a number of Western
countries. By far, the biggest measure supporting and legit-imizing
Polish path to the free market was a deep cut of Pol-ish
external debt. The eventual debt reduction of about
US$20 billion provided a clear signal to institutions world-wide
and constituted an important pre-condition for
Poland's long-term external viability and growth [1].
The National Bank of Poland was re-established in 1989
after passing the new Law on the National Bank by the Parlia-ment.
The main task of the Bank, as outlined in the document,
is to strengthen the Polish currency and to cooperate with the
Government in carrying out its economic policy. The Law of
the National Bank of Poland obliged the Bank to formulate
"projects of guidelines of the state's monetary policy specifi-cally
CASE Reports No. 38
setting growth of money supply, deposit and credit inte-rest
rates, exchange rate and exchange rate policy and
policies concerning external credit relations" [2]. Although
Polish monetary policy was most visibly focused on controlling
money supply during early 90s, exchange rate policy was
viewed as extremely important and at times assumed domi-nant
role. This is particularly understandable in light of recent
research on transmission mechanisms of monetary policy in
Poland which indicates that the exchange rate channel is by far
the strongest and shortest in its impact on inflation [3].
3.2. Inflation, Exchange Rates and Money
Inflation in Poland began to rise significantly as soon as
1987 but it wasn't until 1989 that it became one of the most
apparent threats to macroeconomic stability. Figure 3.1 pre-sents
gradual rise in monthly inflation until its peak in January
1990. This outburst of inflation was to a significant extent the
effect of comprehensive price liberalization coupled with
monetary overhangs that have been built in the form of
forced savings during years of rationing and shortages.
Thus, the stabilization program introduced in January
1990 had inflation curb as one if its main goals. Three major
disinflation measures were employed: the policy of positive
interest rate, the special tax on income increases (the so-called
popiwek) and freezing exchange rate. The latter was
one of the most significant elements of the stabilization pro-gram
introduced with the objective to anchor nominal mag-nitudes
in the economy. The exchange rate was set at 9500
zloty to 1 US$ with the formal commitment to keep it for 3
months. The rate at which zloty was anchored was com-
[1] Gomó³ka (1995).
[2] Law of the National Bank of Poland in Szpunar (2000, p. 211).
[3] See for example, Rybiñski (2000).](https://image.slidesharecdn.com/rc38-141023050422-conversion-gate02/85/CASE-Network-Report-38-Credibility-of-the-Exchange-Rate-Policy-in-Transition-Countries-15-320.jpg)


![23
Credibility of the Exchange Rate Policy in Transition Countries
Part 4
Credibility of the Exchange Rate Policy in Bulgaria
4.1. The Policy of the Bulgarian National
Bank
The Bulgarian banking system was established as a two-tier
system gradually during the 1980-s, and by 1990 was
already in place. With the Bulgarian National Bank (BNB)
Act of 1991 and the Banking and Credit Act of 1992 the sys-tem
was established with the traditional relationships
between the national bank and the commercial banks. The
main goal of BNB was legislatively set to be "to take actions
to maintain the internal and external stability of the nation-al
monetary unit" [4]. The BNB was explicitly trying to
achieve this goal throughout the period 1991–1997, and the
stability of the exchange rate of the Bulgarian lev was regu-larly
mentioned as one of the main goals of BNB, even
though explicit targets were never set during this period.
In the second half of 1996 and the beginning of 1997 Bul-garia
experienced a severe financial crisis, which combined
high inflation, sharp and sustained currency depreciation,
and failure of a large portion of the banking system. The pol-icy
response to this development was the introduction of a
currency board arrangement (CBA) in Bulgaria on July 1,
1997. The benchmark of the CBA is the extremely institu-tionalized
fixing of the exchange rate of the Bulgarian lev
with respect to the Deutsche mark – the nominal exchange
rate is set in art. 29 of the 1997 BNB Act, and the BNB is
obliged to sell or buy Deutsche marks at this rate to every-one
who wants to buy or sell Bulgarian leva. Except for set-ting
the minimal reserve requirement, the BNB is not able
to conduct monetary policy, as it is forbidden by law to hold
assets which are obligations for domestic economic agents
and therefore cannot give out loans to Bulgarian banks and
cannot hold a portfolio of Bulgarian treasuries.
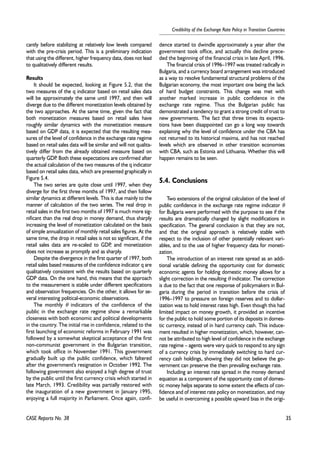
Figure 4.1 shows the dynamics of the BNB interventions
on the foreign exchange market through most of the transi-tion
period. It can be seen how the crisis of 1996 was pre-ceded
by significant net sales of foreign currency, depleting
BNB's foreign reserves, and how the announcement of the
CBA, supported by the IMF, led to large net purchases.
It is obvious, that the behavior of the BNB with respect
to its support of the national currency went through diffe-rent
periods and so the confidence of the public in its real
intent may have varied significantly.
Figure 4.1. Bulgaria 1991–1999: Annual and Semiannual Net
Purchases of Foreign Currency by the BNB from Customers and
Banks (in USD million)
800
600
400
200
0
-200
-400
4.2. Inflation, Exchange Rates, and Broad
Money
Looking at the main macroeconomic indicators of Bul-garia
shown in Table 4.1, it can be inferred that the basic
financial indicators exhibit significant instability. Bulgaria has
CASE Reports No. 37
-600
1991
1993
1994
1992
1995
1996
1997
1998
1999
2000
Source: Source: BNB annual and semiannual reports, 1991–2000
[4] Art. 2 of the 1991 BNB Act, repealed with the 1997 BNB Act.](https://image.slidesharecdn.com/rc38-141023050422-conversion-gate02/85/CASE-Network-Report-38-Credibility-of-the-Exchange-Rate-Policy-in-Transition-Countries-23-320.jpg)
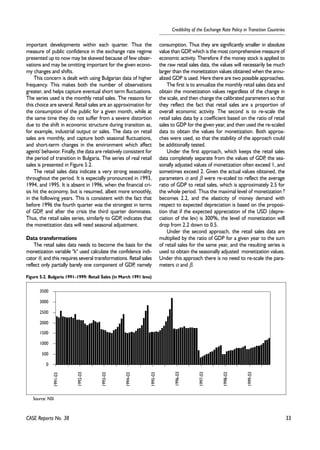
![24
G. Ganev, M. Jarociñski, R. Lubenova, P. WoŸniak
Table 4.1. Bulgaria 1991–1999: Inflation, USD Exchange Rate, Real Exchange Rate, Money (% change)
Year 1991 1992 1993 1994 1995 1996 1997 1998 1999
Inflation 335.0 79.5 72.8 95.1 62.8 123.1 1082.2 22.3 0.3
BG lev/USD 24.0 18.5 96.2 23.8 161.8 853.5 5.0 4.4
Real eff. exch. rate 34.0 45.2 -5.1 18.5 -10.3 28.3 18.1 -2.0
broad money 124.8 42.1 47.6 78.6 39.6 124.5 359.3 9.6 11.4
gone through periods of relative calming down of the indi-cators,
and through periods of great turbulence and insecu-rity.
The data, however, suggest several observations, which
are relevant for the calibration of the public confidence in
the exchange rate regime.
Before the introduction of a CBA in 1997, inflation has
been rampant in Bulgaria. However, it has been growing
consistently faster that both the nominal exchange rate
(except during the currency crisis episodes) and the quanti-ty
of money in the economy. Besides illustrating the process
of real loss of living standards in the Bulgarian economy, this
observation indicates that broad money growth exceeded
inflation only in 1996, when the financial crisis hit the eco-nomy,
and in 1999, when the economy went through a
short period of deflation while the financial sector was still
recovering the public confidence under the CBA.
Bulgaria started economic reforms in 1991 with the
declared goal to preserve the exchange rate stable, and
reconfirmed this goal in 1997 at the introduction of a curren-cy
board. In both cases these announcements, made in the
beginning of important structural changes, were followed by
a significant real appreciation. To make this possible for longer
periods (more than one or two quarters), it requires a rela-tively
high confidence on the part of the public, which leaves
the national currency without speculative attacks.
It is obvious that the defense of a claim that inflation in
Bulgaria may have been caused primarily by the movements
in the money supply is problematic – broad money has grown
at consistently lower speed than the price level. Bulgaria may
have been experiencing a severe restructuring of its domestic
prices, which is consistent with the sharp drop in output in
the first years of transition. This fact is also consistent with the
speculation that inflation was a major redistributive tool in the
early transition period in Bulgaria. At the same time, the start-ing
level of monetization in the country was relatively high for
transition country standards, and it was only after the "disap-pearance"
of a significant amount of deposits, and a large
chunk of public confidence in the banking sector with them,
in a series of failed banks in 1996–1997 that the level of mon-etization
went down to a level quite consistent with the
standing of the Bulgaria as a transition economy and with its
level of income per capita. Thus movements in monetization
may reflect public attitudes to a very large extent.
4.3. Output Dynamics vs Broad Money
Changes
Seasonality
Bulgarian output is highly seasonal. Even though agri-culture
constitutes less than 20 percent of GDP through-out
the transition period with the exception of the crisis
ridden 1997, the "agricultural" third quarter is regularly
the strongest, and during the post-crisis period outper-forms
even the traditionally strongest fourth quarter.
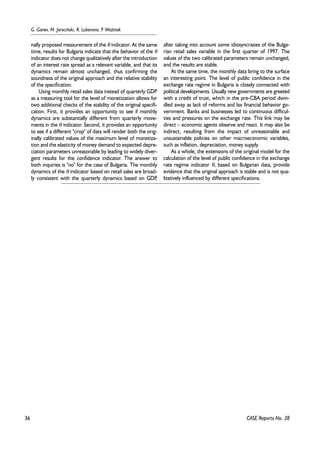
Figure 4.2. Bulgaria 1994–1999: Quarterly Real GDP Index,
1997=100
130
120
110
100
90
80
70
60
In terms of making inferences about the level of mo-netization,
this highly seasonal dynamic of output needs to
be compared with the seasonality of broad money, which
is exhibited on Figure 4.3. The movements in nominal
money do not indicate a strong seasonal pattern. The
same inference can be made after looking at real money
growth for the same period.
The comparison suggests two main things. First, broad
money in Bulgaria exhibits an uncharacteristic lack of sea-sonality
[5]. This lack of seasonality in Broad money and
CASE Reports No. 38
Source: BNB, National Statistical Institute of Bulgaria (NSI), Bank for International Settlements – Basle
50
1994Q1
1996Q1
1998Q1
2000Q1
1995Q1
1997Q1
1999Q1
Source: NSI
[5] A formal multiplicative seasonal adjustment procedure yields seasonal factors which are small, and are probably most influenced by a single
quarter – 1997-1.](https://image.slidesharecdn.com/rc38-141023050422-conversion-gate02/85/CASE-Network-Report-38-Credibility-of-the-Exchange-Rate-Policy-in-Transition-Countries-24-320.jpg)


![31
Credibility of the Exchange Rate Policy in Transition Countries
Part 5
Credibility of the Exchange Rate Policy in Bulgaria – Extensions
5.1. Justification
The values of the indicator θ for the level of public con-fidence
in the exchange rate regime in Bulgaria obtained in
the previous section were derived through a calibration
based on a simple theoretical model and on quarterly GDP
data representing the level of economic activity. As with any
other calibration exercise, the results should be taken with
a necessary degree of caution, since the parameter values
are strongly dependent on subjective judgement. There
may be different ways to check whether calibration pro-vides
acceptable results. Here two of them are used for the
case of Bulgaria. One involves a slight change in the under-lying
theoretical equation, and the other involves different
data representing economic activity.
The slight change in theory is in fact an addition of domes-tic
interest rates as a part of the decision of the representative
agent, more precisely as a variable relevant for the opportuni-ty
cost of holding domestic money. This addition may make a
significant difference if interest rates are an important omitted
variable in the original specification, or if the calibration
involves unrealistic assumptions about the parameters.
Changing the data series representing economic activity
allows for two additional checks. First, it makes it possible
to use higher frequency observations, which may put the
realism of the assumptions behind the model and behind the
assumed parameter values under a more severe test. Se-cond,
using a different measure for economic activity by
itself puts the assumed parameters and the obtained results
to the test by checking whether they are qualitatively
dependent on the choice of variable.
5.2. Inclusion of Interest Rates
Interest rates as a part of domestic money's opportu-nity
cost
The reason for the introduction of the currency depre-ciation
in the money demand equation is to have a repre-sentation
of the opportunity cost of holding domestic
money instead of other currencies as a store of value and
even for everyday transactions. Depreciation increases the
return on holding foreign currencies. However, domestic
interest rates, if they are high enough relative to expected
depreciation, create an incentive to hold domestic currency
denominated assets. At the same time, assets in foreign cur-rencies
also bring a yield of their own. Thus, what is rele-vant
for domestic economic agents, is the differential
between returns from holding domestic currency denomi-nated
assets and holding foreign currency denominated
assets.
The return on domestic currency denominated assets is
measured by the domestic interest rate, represented by the
Bulgarian base interest rate. The return on foreign curren-cy
denominated assets is a composite one. It consists of the
return due to the depreciation of domestic currency rela-tive
to the foreign one, and to the own yield of the asset. In
the analysis here foreign currency denominated assets are
represented by USD denominated deposits of Bulgarian
economic agents in Bulgarian banks, which are by far the
dominating form of foreign currency saving in Bulgaria. As a
result, the relevant opportunity cost of holding domestic
money consists of expected depreciation and of the interest
rate differential between domestic and dollar deposits.
It is precisely in this manner that interest rates can be
introduced in the money demand equation:
lnM - lnP = α + k lny - n [E{de/e} - (rd - rf)]
In this specification, "n" is the elasticity of money
demand with respect to changes in the relative expected
return on holding foreign currency denominated assets. The
reason why inclusion of this measure may be relevant for
measuring confidence in the exchange rate regime is that
high domestic interest rates may be an important means for
attracting public holding of domestic currency and over-coming
the public "nervousness" about the credibility of the
exchange rate regime. Thus omitting the interest rate dif-ferential
may lead to an overestimation of the level of pub-lic
confidence in the exchange rate regime – the public may
CASE Reports No. 38](https://image.slidesharecdn.com/rc38-141023050422-conversion-gate02/85/CASE-Network-Report-38-Credibility-of-the-Exchange-Rate-Policy-in-Transition-Countries-31-320.jpg)
![32
G. Ganev, M. Jarociñski, R. Lubenova, P. WoŸniak
be holding domestic currency deposits not because it
believes the exchange rate regime, but because of the rela-tively
high interest rates.
Formalization
Provided that the real income elasticity of money
demand is 1, and that monetization is denoted by "k", the
resulting expression for the expected rate of depreciation is:
E{de/e} = [(ln(k) - α)/(-n)] + (rd - rf),
and the equation for the calculation of the confidence indi-cator
θ becomes:
θ = [(ln(k) - α)/(-n) + (rd - rf) - DevScen] / [NoDevScen -
DevScen]
It can be seen from this specification how relatively high-er
domestic interest rates mean that people are holding
domestic money because of them, and not because of high
confidence in the sustainability of the exchange rate. Intu-itively,
the lower the confidence in the domestic currency,
the higher interest rates are needed to entice domestic eco-nomic
agents to hold deposits in domestic currency. For-mally,
the derivative of θ with respect to domestic interest
rates is negative due to the fact that the denominator
[NoDevScen-DevScen] is negative.
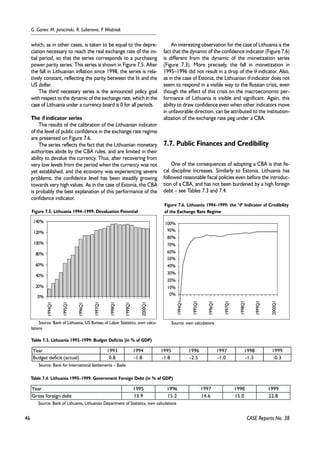
Results
It is to be expected that high domestic interest rates are
pulling the confidence measure down relative to the mea-sure
of confidence which ignores the interest rate differen-tial.
This effect is clearly demonstrated on Figure 5.1, which
shows the two measures for Bulgaria and makes obvious the
fact that for the periods when the Bulgarian domestic inte-rest
rates were significantly higher than foreign currency
interest rates, the resulting confidence measure is lower
than the benchmark measure omitting domestic interest
rates. After the introduction of the currency board arrange-ment
in Bulgaria and the convergence of Bulgarian interest
rates to the levels close to the ones characteristic for foreign
currency deposits, the two measures of public confidence in
the exchange rate regime become almost overlapping.
At the same time, the two measurements are not diffe-rent
enough to lead to qualitatively different results, and
both of them capture generally the same dynamic, and con-vey
approximately similar pictures. This means that the gen-eral
approach is not vulnerable to this slight theoretical
refinement, and that the choice of parameter values may be
considered reasonable.
5.3. Alternative Economic Activity Data
and Frequency
Retail sales as a measure of economic activity
GDP is the usual candidate for a representation of the
overall level of economic activity, but it does not have to be
the only one and in the case of transition countries has two
deficiencies. First, the highest frequency of GDP data is
quarterly, and many transition countries have a history
which is not long enough to provide even the opportunity
for interpolation of earlier annual data using estimated sea-sonal
factors. Second, transition economies are less stable
and with less inertia than the more highly developed coun-tries,
and their internal economic dynamic may involve
Figure 5.1. Bulgaria 1991–1999: Two Measures of the Confidence Indicator: with Interest Rates and without Interest Rates
CASE Reports No. 38
100%
90%
80%
70%
60%
50%
40%
30%
20%
10%
0%
1991Q1
1992Q1
1993Q1
1994Q1
1995Q1
1996Q1
1997Q1
1998Q1
1999Q1
2000Q1
without interest rates
with interest rates
Source: own calculations](https://image.slidesharecdn.com/rc38-141023050422-conversion-gate02/85/CASE-Network-Report-38-Credibility-of-the-Exchange-Rate-Policy-in-Transition-Countries-32-320.jpg)


![38
G. Ganev, M. Jarociñski, R. Lubenova, P. WoŸniak
caused by the Russian crisis, than by the internal dynamic of
Estonian financial developments.
6.3. Output Dynamics vs Broad Money
Changes
Seasonality
Estonian quarterly real GDP is visibly seasonal, with a
strongest fourth quarter, a very strong second quarter, a
weaker third quarter, with the first quarter being the weak-est.
One inference from this observation is that the Esto-nian
economy follows a pattern consistent with more deve-loped
industrial economies. This seasonality is visible on Fig-ure
6.1.
Figure 6.1. Estonia 1993–1999: Quarterly Real GDP
(in 1995 kroons)
14000
13000
12000
11000
10000
9000
To illustrate the highly seasonal character of monetiza-tion,
the jigsaw pattern of Estonian real GDP needs to be
compared with the dynamics of Broad Money, which are
shown on Figure 6.2.
Due to the relatively low fluctuations in inflation, the
dynamic of nominal and real broad money are roughly simi-lar.
While there is a discernible seasonal pattern before
1998, with the second quarter exhibiting the strongest
growth in broad money, this pattern seems to have disap-peared,
or at least visibly changed after the Russian crisis of
August 1998. The presence of seasonal factors in the
dynamics of both GDP and money makes a seasonal adjust-ment
of monetization necessary, if it is to serve as a basis for
the measurement of a highly inertial concept such as public
confidence.
Dynamics
Output in Estonia has followed a pattern specific for a
country with a CBA. GDP declined for two consecutive years
after the introduction of the CBA, which means that the
desirable effects of the arrangement were affecting the econ-omy
with a long lag. This, of course, may be entirely attribut-able
Figure 6.2. Estonia 1993–1999: Change in Nominal Broad Money
Compared to Previous Quarter (in percent)
25%
20%
15%
10%
5%
0%
to the usual post-communist recession. Then, four years
of robust growth in real GDP were recorded, roughly coin-ciding
with similar levels of growth in monetization [6].
The annual data for Estonia indicate a relatively close
relationship between real GDP and the level of monetiza-tion,
rendering the assumption of a unit elasticity of money
demand with respect to output reasonable.
Table 6.2. Estonia 1993–1999: Real GDP Monetization Annual Growth Tares (% change)
Year 1993 1994 1995 1996 1997 1998 1999
Real GDP growth -8.5 -1.8 4.3 4.0 10.6 4.7 -1.1
Growth in monetization 4.4 3.3 5.1 16.2 -4.5 15.3
CASE Reports No. 38
8000
1993Q1
1994Q1
1996Q1
1997Q1
1998Q1
1999Q1
2000Q1
1995Q1
Source: Statistical Office of Estonia
-5%
1993Q1
1994Q1
1996Q1
1997Q1
1998Q1
1999Q1
2000Q1
1995Q1
Source: Bank of Estonia
Source: Bank of Estonia, Statistical Office of Estonia
[6] The discrepancy in 1998 is entirely due to the last quarter, when after the Russian crisis money decreased rapidly relative to GDP, but the weak-ness
of GDP in the last quarter was not enough to affect the growth for the whole year.](https://image.slidesharecdn.com/rc38-141023050422-conversion-gate02/85/CASE-Network-Report-38-Credibility-of-the-Exchange-Rate-Policy-in-Transition-Countries-38-320.jpg)

![40
G. Ganev, M. Jarociñski, R. Lubenova, P. WoŸniak
tion of parameters and specification of the relevant data
series.
Calibration of the parameters of the money demand
relationship
Calibration involves assigning values to the parameter α,
which represents the potential maximal level of monetiza-tion
for the respective economy, and the parameter β,
which represents the elasticity of money demand with
respect to expected depreciation.
The maximal level of monetization is taken to corre-spond
to the highest one achieved so far in Estonia, and is
set at 0.45. This parameter value fits the current sample, but
since the overall monetization trend in Estonia is positive, it
may become too restrictive in the near future.
Selecting a value for β for Estonia necessarily involves a
high degree of discretion, as over the period of observation
the country has not had a significant depreciation, nor a
large drop in monetization. Different values of this parame-ter
were tried, and none of them changes the results in any
substantial way, except for the first three observations, for
which the starting level of confidence was very low and
changes in the parameter did have a slight impact. The value
actually chosen corresponds to a relatively high sensitivity of
the public towards depreciation, corresponding to the rela-tively
high level of development of the financial system
which is capable of enabling economic agents to flee in a
case of a crisis. Thus it is assumed that a certain 30% depre-ciation
will make monetization drop to one tenth of its
potentially maximal level.
Time series
There are three data series needed for the calculation of
the confidence indicator θ. The first is the monetization,
which was derived above. The second is the potential
depreciation. It is based on the assumption that if left alone
by policymakers, the nominal exchange rate will return to a
point where the real exchange rate is equal to the real
exchange rate of a base period, where the base period is
chosen to be the beginning of the observed period. This
choice of a "fall-back" scenario is definitely unrealistic, and
renders other approaches possible and even desirable, but
is useful as a starting point for comparison. Any other
approach would also require some strong assumptions.
Thus the data needed to calculate the potential deprecia-tion
coincide with the data needed for the calculation of the
purchasing power parity, i.e. the domestic price level (taken
from the Statistical Office of Estonia), the foreign price level
(US Bureau of labor statistics), and the nominal exchange rate
(Bank of Estonia). The resulting series is shown on Figure 6.5,
and presents no surprises given the facts about the inflation
rate in Estonia after the introduction of the CBA.
The Estonian kroon has been appreciating in real terms
consistently during the first three years of observation, and
then with the slowdown of inflation in Estonia has remained
at fairly constant levels [7]. Since there have been no
episodes of significant attack against the kroon, the dyna-mics
of this series is fairly smooth.
The last series, needed for the calculation of the confi-dence
indicator, is the announced exchange rate policy
goals. Due to the CBA, which has been operational through-out
the period in question in Estonia, this goal can be
assumed to be an explicitly stated exchange rate stability, i.e.
0 percent depreciation in all periods.
The θ indicator series
The results of the calibration of the Estonian indicator of
the level of public confidence in the exchange rate regime
are presented on Figure 6.6. The series reflects the strong
commitment of the monetary authority to the adopted CBA
and the relatively good macroeconomic results achieved by
the Estonian economy.
After starting at a very low level, corresponding to the
political and economic turbulence related to the separation
from the USSR, and to the restoration of statehood, of the
currency and of the financial system, confidence grew quick-ly
to very high levels in 1993, and has been gradually con-verging
towards full confidence since then.
It is interesting to note that a very high level of confi-dence
was reached in periods (i.e. 1993) when the level of
monetization (Figure 6.3) was still quite low for a transition
country with the Estonian GDP per capita. This can be
CASE Reports No. 38
Figure 6.5. Estonia 1993–1999: Devaluation Potential
200%
180%
160%
140%
120%
100%
80%
60%
40%
20%
0%
1994Q1
1996Q1
1997Q1
1998Q1
1999Q1
2000Q1
1995Q1
1993Q1
Source: Bank of Estonia, US Bureau of Labor Statistics, own calcula-tions
[7] The real depreciation at the end of the observed period is due mainly to the strength of the US dollar relative to other, especially the Euro-pean,
currencies. The same effect is observed in all other countries whose currencies are not pegged to the US dollar.](https://image.slidesharecdn.com/rc38-141023050422-conversion-gate02/85/CASE-Network-Report-38-Credibility-of-the-Exchange-Rate-Policy-in-Transition-Countries-40-320.jpg)


![43
Credibility of the Exchange Rate Policy in Transition Countries
Part 7
Credibility of the Exchange Rate Policy in Lithuania
7.1. The Policy of the Bank of Lithuania
As early as 1990 the Bank of Lithuania was re-estab-lished
after being a branch of the Soviet Gosbank for 60
years, with an act of the Lithuanian Parliament. In the fol-lowing
two years, it was decided to introduce a provisio-nal
currency (talonas) as a substitute for the Russian Ruble,
and in 1993 the Lithuanian Litas became the national cur-rency.
After initially following a policy of a managed float, the
Lithuanian authorities decided to follow the example of
Estonia, and to establish a currency board arrangement
(CBA), with the lit tied to the US dollar at a rate of 4 litas
for 1 dollar. The Lithuanian currency board was intro-duced
on April 1, 1994. An interesting feature of the
Lithuanian CBA is the ability of the central bank to have
discretion over decisions to appreciate the lit, but not to
depreciate it.
Since 1994 the Bank of Lithuania has followed the mon-etary
rules of the CBA, without appreciating the currency,
Table 7.1. Lithuania 1993–1999: Inflation, USD Exchange Rate, Real Exchange Rate, Money (% change)
Year 1993 1994 1995 1996 1997 1998 1999
inflation 410.2 72.2 39.6 24.6 8.9 5.1 0.8
LTL/USD -8.2 0.6 0.0 0.0 0.0 0.0
real eff. exch. rate 250.0 75.6 23.1 25.8 19.9 5.5 3.3
broad money 100.2 63.0 28.9 -3.5 34.1 14.5 7.7
Source: Bank of Lithuania, Bank for International Settlements – Basle
so the exchange rate has remained fixed. However, a weak
banking sector has continuously caused imbalances in the
Lithuanian financial system and has contributed to pressures
on the fixed exchange rate regime. On several occasions the
political establishment in Lithuania has expressed an inten-tion
to abandon the CBA [Chankova, 1999], and this beha-vior
kept the level of uncertainty and from there interest
rates relatively high.
7.2. Inflation, Exchange Rates, and Broad
Money
In 1993 the Lithuanian economy experienced high
inflation, resulting from the use of the provisional curren-cy
and the close ties with the highly inflationary zone of
the Russian ruble. This performance was one of the rea-sons
for the adoption of a CBA in 1994. After the start of
the CBA, inflation subsided significantly, but did not come
down to single digits annually until 1997. In this manner, as
illustrated in Table 7.1, Lithuania experienced a real effec-tive
exchange rate appreciation throughout the period
under observation.
At the same time as the price level was growing rela-tively
quickly, and the Lithuanian currency was appreciat-ing,
the broad money aggregate was growing at a slower
pace than prices until 1997, when this trend was reversed.
As a result the monetization of the economy was decreas-ing
until 1996, and increasing, albeit more slowly, after
that.
Normally, the real appreciation of the currency and the
dropping monetization may be expected to bring about
external imbalances, which may hold back, and even suffo-cate
the growth of the economy. As in the case of Estonia,
however, Lithuania was able to register robust growth rates
before the Russian-crisis-ridden 1999, when most of the
decline of GDP can be attributed to unfavorable external
factors.
CASE Reports No. 38](https://image.slidesharecdn.com/rc38-141023050422-conversion-gate02/85/CASE-Network-Report-38-Credibility-of-the-Exchange-Rate-Policy-in-Transition-Countries-43-320.jpg)


![50
G. Ganev, M. Jarociñski, R. Lubenova, P. WoŸniak
confirm the perception that the fixed rate may become
unsustainable in the future, although it may reflect a normal
re-monetization after the crises of the early 1990s.
8.3. Output Dynamics vs Broad Money
Changes
Seasonality
The seasonal pattern of the Latvian GDP is easy to spot,
and not very complicated – see Figure 8.1. Its most important
feature is a weak first quarter and approximately equal other
three quarters – the only exception is the last quarter of 1998,
when the Latvian economy reacted to the Russian crisis.
This pattern suggests that other than a correction for the
first quarter, the GDP dynamics may not introduce any sea-sonality
into the level of monetization in Latvia.
Likewise, the seasonal pattern in broad money growth,
shown on Figure 8.2, does not indicate a strong seasonality.
This observation leads to the expectation that the moneti-zation
obtained by the simple ratio of broad money to GDP
may not exhibit strong seasonal patterns.
Dynamics
Output dynamics in Latvia followed the pattern typical
for a transition country – sharp recession followed by
slow resumption of growth (Table 8.2). After a somewhat
slow stabilization of output in 1994 and 1995, Latvian
GDP grew robustly in 1996–1998, and registered growth
even in 1999, which was the year following the Russian
crisis and in which the other two Baltic countries record-ed
recessions.
Except for 1995, when the banking crisis in Latvia [8]
affected the creation of money and led to a severe drop in
monetization, the level of monetization has had a similar
dynamic to the level of output, and the assumption of a
unit elasticity of the demand for money with respect to
output can be realistically maintained.
8.4. Evolution of Monetization in Latvia
The data for the level of monetization in Latvia come
from the Bank of Latvia for both the monetary aggregate
and the nominal quarterly GDP. Seasonal adjustment was
performed, using the EViews ratio to moving average
Figure 8.2. Latvia 1995–1999: Change in Nominal Broad Money
Compared to Previous Quarter (in percent)
CASE Reports No. 38
Figure 8.1. Latvia 1994–1999: Quarterly Real GDP Index
(in 1993 lats)
460
440
420
400
380
360
340
320
1994Q1
1996Q1
1997Q1
1998Q1
1999Q1
2000Q1
1995Q1
Source: Bank of Latvia
15%
10%
5%
0%
-5%
-10%
-15%
-20%
1996Q1
1997Q1
1998Q1
1999Q1
2000Q1
1995Q1
Source: Bank of Latvia
Table 8.2. Latvia 1993–1999: Real GDP and Monetization Annual Growth Rates (%)
Year 1993 1994 1995 1996 1997 1998 1999
Real GDP growth -14.9 0.6 -0.8 3.3 8.6 3.9 0.1
Growth in monetization -8.5 -29.5 -0.7 20.2 -2.4 6.0
Source: Bank of Latvia, own calculations
[8] The banking crisis was caused mainly by bad lending practices of banks which were not sanctioned in time by the Bank of Latvia and the depo-sitors.
The results of the crisis were a worsening of the credit conditions and the revoking of 15 bank licenses during the year. See Bank of Latvia
Annual Report for 1995.](https://image.slidesharecdn.com/rc38-141023050422-conversion-gate02/85/CASE-Network-Report-38-Credibility-of-the-Exchange-Rate-Policy-in-Transition-Countries-50-320.jpg)


![54
G. Ganev, M. Jarociñski, R. Lubenova, P. WoŸniak
9.1. The Policy of the National Bank of
Moldova
A two tier banking system, with a separate Central
Bank, had been established in Moldova already in 1991.
However, until 1993 Moldova belonged to the rouble zone
and suffered from its chaos and very high inflation (1670%
in 1992 and 2706% in 1993). The National Bank of Moldo-va
(NBM) started issuing Moldovan coupons in 1992. Ini-tially
they were equivalent of roubles and circulated in pa-rallel.
Only since August 1993 Moldovan rouble coupons
started to be quoted independently and soon afterwards
Moldovan Interbank Currency Exchange was founded.
Starting in the second half of 1993 a stabilization program
was implemented, with the support of the Standby
Arrangement with the IMF. In the framework of the pro-gram,
on November 29, 1993 Moldova introduced the
national currency: the Moldovan leu.
The National Bank of Moldova never explicitly
announced any exchange rate peg. However, the policy of
stabilizing the exchange rate (which, in conditions of a deep
current account deficit means mainly intervening in support
of the leu) was both announced and, as long as the situation
allowed it, conducted. The 1997 Annual Report of the
National Bank of Moldova states this clearly:
"The main objective of the National Bank of Moldova is
the maintenance of the national currency stability. This
objective can be achieved through the implementation of a
severe monetary and credit policy and through the imple-mentation
of a foreign exchange policy that corresponds to
the situation of the market of the Republic of Moldova. In
the condition of deterioration of external balance of payments
and absence of a durable economic growth, the stability of
the Moldovan Leu exchange rate is one of the main pillars that
contribute to the stability of the national currency and
attraction of foreign investments." (our italics) [9].
Reserves of the NBM, used up for the support of the
exchange rate were being repleted by subsequent tranches
of the IMF loans. The figure below presents NBM net pur-chases
of foreign currency on the interbank market (nega-tive
for most of the period), which were executed in pursue
of the goal of exchange rate stability.
We are stressing the above circumstances with two
goals in mind. First, to defend the analysis of the credibility
of the Moldovan Central Bank in the context of the fixed
exchange rate model, although officially the exchange rate
regime was classified as a managed float. Second, to justify
the appropriateness of another assumption of the model:
namely that money supply is fully determined by the
demand, i.e. by the willingness of people to hold domestic
currency. As long as the Central Bank had access to financ-ing
from the IMF it could defend the currency on the forex
Figure 9.1. NBM Net Purchases of Foreign Currency on the
Chisinau Interbank Currency Exchange (USD million)
CASE Reports No. 38
Part 9
Credibility of the Exchange Rate Policy in Moldova
20
10
0
-10
-20
-30
-40
-50
-60
1994Q1
[9] National Bank of Moldova, 1997 Annual Report, NBM Internet site: http://www.bnm.org
1996Q1
1997Q1
1998Q1
1999Q1
1995Q1
Source: National Bank of Moldova
Note: The NBM has been a net purchaser of USD in 1999, but the
exact data for this period is missing.](https://image.slidesharecdn.com/rc38-141023050422-conversion-gate02/85/CASE-Network-Report-38-Credibility-of-the-Exchange-Rate-Policy-in-Transition-Countries-54-320.jpg)


![59
Credibility of the Exchange Rate Policy in Transition Countries
crisis. In 1996 and partly in 1997 conditions were favorable
for raising capital on the world markets, which made it pos-sible
for Moldova to fall deep into the trap of indebtedness.
In the middle of 1997 the Asian crisis began and the climate
on financial markets changed, especially with respect to
investing in emerging market economies. Radziwi³³ et al.
(1999) note the following facts that preceded the debt cat-astrophe:
– In mid–1997 the IMF stopped disbursing credits to
Moldova, which was followed by the withholding of World
Bank loans. After that Moldova could rely only on a much
more expensive commercial capital. Budget deficit was
financed with the help of the sale of Eurobonds.
– At the end of 1997 Moldova was forced to reschedule
credits from Russia, totaling over $30 mln. In 1998 debt
arrears amounted already to $50 mln and energy payment
arrears to $103 mln. [IMF, 1999]
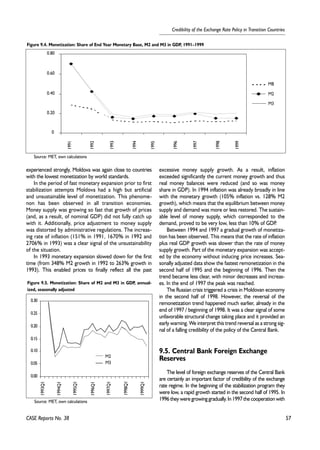
– The spread on Moldovan Eurobonds increased from
380 basic points to 800 at the end of 1997.
– Foreign participation on the T-bill market decreased
from 38% to 22%.
– Interest rates on 3 month T-bills increased from 21%
in 1997 Q3 to 31% in 1998 Q1 in spite of stable (only sea-sonally
fluctuating) inflation.
Beginning in early 1998 Foreign Assets of the NBM,
which had been growing since the start of the stabilization
program, began to leak out. This was immediately accom-panied
by shrinking of domestic currency in circulation on
the liability side of the Central Bank balance sheet.
Direct reasons of the shrinking of Foreign Reserves
can be found in the Balance of Payments. In the beginning
of 1998 the Current Account deficit increased and simul-taneously
the Capital and Financial Account deteriorated.
An outflow of Portfolio investments, which had begun
already in the last quarter of 1997, accelerated. The asset
position under Other Investment, which shows mainly
non-repatriation of export receipts, increased [10] (with
the minus sign in the B.o.P.). Part of the increase of the lia-bilities
position reflects accumulation of arrears. All these
phenomena are a clear signal of an undermined confi-dence
in the stability of the Moldovan economy and,
especially, in its currency.
Another signal of increasing expectations of depreciation
was the growth of deposits' dollarization. Early 1998 wit-nessed
a rapid and unprecedented growth of dollarization.
So, the credibility crisis: contraction of demand for
Moldovan leu and outflow of capital, had begun already
about 8 months before the Russian crisis. Its reasons were,
therefore, mainly internal and were related to unsustainable
public finances.
Table 9.3. Moldova: Budget Deficits (in % of GDP)
CASE Reports No. 38
Figure 9.8. Interest Rates on 3-month T-bills (quarterly weighted
average – % per annum)
120%
100%
80%
60%
40%
20%
0%
1995Q1
1996Q1
1997Q1
1998Q1
1999Q1
1995Q3
1996Q3
1997Q3
1998Q3
1999Q3
Source: MET, own calculations
1993 1994 1995 1996 1997 1998 1999
Budget Deficit (cash) -7.5 -5.9 -5.8 -9.7 -7.5 -3.4 -3.0
Budget Deficit (commitment) -8.9 -8.2 -8.0 -14.3 -4.2 -9.0 -3.1
Source: MET, expenditure arrears – IMF
Table 9.4. Foreign and Domestic Debt 1993–1999
1993 1994 1995 1996 1997 1998 1999
Foreign debt* USD mln 255 633 840 1070 1286 1390 1462
% GDP 21% 55% 58% 63% 66% 82% 129%
Internal debt MDL mln 105 270 477 737 971 1572 1910
% GDP 6% 6% 7% 9% 11% 17% 16%
Source: Ministry of Finance
*Including energy debt
[10] See: A comment on the Balance of Payments data for 1998 in the NBM internet site: http://www.bnm.org](https://image.slidesharecdn.com/rc38-141023050422-conversion-gate02/85/CASE-Network-Report-38-Credibility-of-the-Exchange-Rate-Policy-in-Transition-Countries-59-320.jpg)


![65
Credibility of the Exchange Rate Policy in Transition Countries
stant in the first 3 quarters of 1995. In the model, this
behavior of money is matched by an expectation of a depre-ciation
that is much faster than the potential accrued since
the exchange rate became officially defended. Only the
introduction of the new national currency provided a stim-ulus
for a massive growth of demand for domestic money –
which is reflected in the peak of the "θ" indicator in the last
quarter of 1995.
The interpretation based on the model, leading to the
conclusion that during the first 3 quarters of 1995, when the
exchange rate was fixed, the stabilization program lacked
credibility, is confirmed in other analyses. Kakulia et al.
(2000) point out, that the dollarization, measured as a share
of USD deposits to broad money reached the all time high
in the middle of 1995 (43.8%). Wang (1999) observes in
addition, that inflation started falling before significant cre-dibility
enhancing events took place. The new law on the
central bank, and other administrative changes were intro-duced
only well after inflation started slowing down. When
the formal IMF support, which is another credibility factor,
was initiated, inflation was already on a downward path.
Wang concludes, that "..hyperinflation was stopped by
removing generalized consumer subsidies and tightening of
monetary policy, and not by a sudden rush of credibility or
imposition of an exchange rate anchor." [Wang, 2000, p.1]
As an alternative indicator of credibility, he analyses the gap
between the TICEX exchange rate and the average
exchange rate in the street Foreign Exchange Bureaus. The
gap has been wide since the beginning of 1995 (signaling the
expectation of depreciation) and the two rates converged
on sooner than in October 1995.
Subsequent lack of growth of the money demand, in
spite of a still very low level of monetization, stable
exchange rate and low inflation, is interpreted by the model
as a loss of credibility. Conclusions, similar to those of the
model, are drawn by the analysts of the NBG: Kakulia et al.
(2000) base them on the observation that the growth of fo-reign
currency deposits outpaced that of lari deposits ever
after the low of dollarization in end 1995.
According to the model the credibility performance
has been mixed afterwards. Following a marked slide
down beginning in early 1998, when inflation rose and
monetization fell, a final plunge occurred accompanied by
the dissolution of the stable exchange rate system in the
aftermath of the Russian crisis in 1998. The surveys con-ducted
by the State Department of Statistics in 1998
revealed that 30–40% of respondents predicted an acce-leration
of inflation, and another 30% were classified as
not optimistic in this respect [Kakulia 2000]. Surveys for
earlier periods, or concerning directly the exchange rate
expectations, are not available. The one quoted above can
serve as a rough confirmation of the story told by the
"theta" indicator. Also, the analysts of the NBG explicitly
formulate a similar diagnosis: that the credibility has been
low and did not increase significantly since the currency
reform [Kakulia 2000, p.9–10].
It is worth noting, that the dynamics of the "theta" indica-tor
is very similar to that of foreign reserves of the central
bank.
10.7. Public Finances, Current Account
and Credibility
Public finance situation did contribute to enhancing
credibility of the monetary policy. In the entire period under
examination budget deficits were high, due to notoriously
low tax collection. The foreign debt was creeping upwards
in USD terms, although fast real growth and real apprecia-tion
contributed to its significant reduction in relation to
GDP. In spite of a reasonable and stable ratio of foreign debt
to GDP, the burden was exceptionally high due to a poor
export performance during the entire period.
High budget deficits and problems with tax collection
and expenditure arrears certainly contributed to the weak-ening
of credibility of the exchange rate regime. Kakulia et
al.(2000) stress the importance of the 1998 fiscal crisis in
undermining the confidence in lari.
The persistent deep current account deficit was also
putting the credibility of the regime into question. In princi-ple,
for a relatively small country like Georgia, sustaining a
Table 10.3. Georgia 1995–1999, Budget Deficit (% of GDP)
CASE Reports No. 38
1995 1996 1997 1998 1999
budget deficit commitments -7.9 -7.4 -7.0 -6.5 -6.7
budget deficit cash -6.8 -7.2 -6.3 -5.1 -4.9
Source: IMF Recent Economic Developments, 2000, IMF website
Table 10.4. Georgia 1994–1999, Foreign Debt (USD mln)
1993 1994 1995 1996 1997 1998 1999
total debt outstanding 544 998 1225 1371 1539 1448 1630
total debt in % of GDP 150.0% 60.0% 44.9% 43.6% 47.9% 62.7%
Source: IMF 1998b, IMF website (public information notices), NBG, own calculations](https://image.slidesharecdn.com/rc38-141023050422-conversion-gate02/85/CASE-Network-Report-38-Credibility-of-the-Exchange-Rate-Policy-in-Transition-Countries-65-320.jpg)


This document discusses the credibility of exchange rate policies in transition countries, particularly focusing on Poland, Bulgaria, Estonia, Lithuania, and Latvia. It includes an analysis of stabilization programs, inflation, monetary policy, and various economic indicators influencing credibility. The findings are based on model assumptions, dynamic behaviors, and various assessments across these countries.


