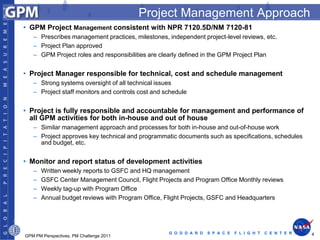
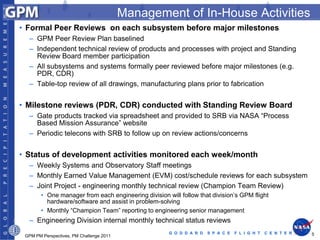
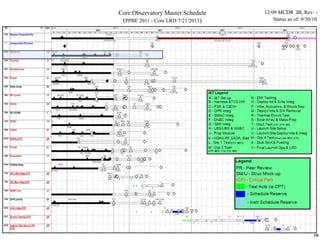
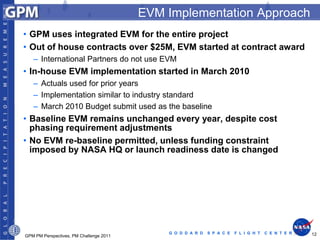
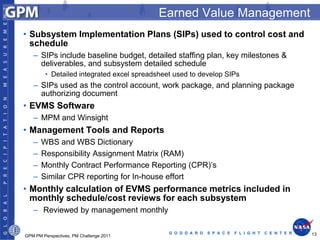
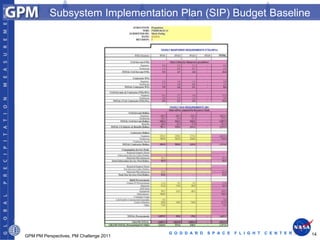
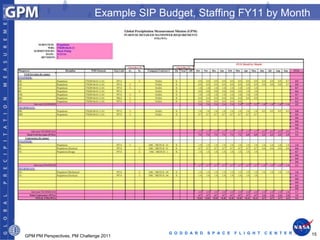
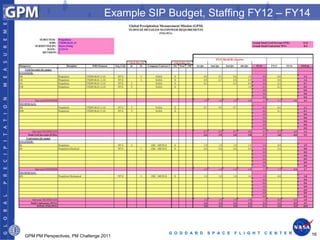
Global Precipitation Measurement
    (GPM) Project Management
     Perspectives on In-House
           Development


PM Challenge
February 2011
                                            Art Azarbarzin
                                            Project Manager
                                            Candace Carlisle
                                            Deputy Project Manager
                                            Jackie Fiora
                                            Deputy Project Manager/Resources


                        G O D D A R D   S P A C E F L I G H T C E N T E R      1
Global Precipitation Measurement Overview
Mission Objective:
•   Improve scientific understanding of the global water
    cycle and fresh water availability
•   Improve the accuracy of precipitation forecasts
•   Provide frequent and complete sampling of the Earth’s
    precipitation
Mission Description (Class B, Category I):
•   Constellation of spacecraft provide global precipitation
    measurement coverage
      – NASA/JAXA Core spacecraft: Provides a microwave
          radiometer (GMI) and dual-frequency precipitation
          radar (DPR) to cross-calibrate entire constellation
            • 65o inclination, 400 km altitude
            • Launch July 2013 on HII-A
            • 3 year mission (5 year propellant)
      – Second GMI instrument to be accommodated on a
          TBD partner-provided Low-Inclination spacecraft:    • Partners
          Complements Core spacecraft and partner assets         – Japanese Aerospace and Exploration (JAXA)
            • ~40o inclination, ~600 km altitude                     • DPR instruments for Core spacecraft
            • Launch late 2014 (TBR)                                 • Launch service for Core spacecraft
      – Partner constellation spacecraft: Provided by            – TBD, LIO Spacecraft and Launch Vehicle
          JAXA, DoD, NOAA, other space agencies                  – Other U.S. and international agencies
•   Ground assets                                                    • Data from radiometers (e.g. IPO NPP, DOD
      – Precipitation Processing System: Data                          DMSP, JAXA GCOM-W, Megha-Tropiques)
          processing, archive, distribution for the entire           • Ground validation partnerships
          constellation of spacecraft                            – Universities
      – Ground validation system: Uses world-wide network of         • Ground validation partnerships
          ground-based measurements to validate space
          measurements and algorithms                                • Science team participation
      – Mission Operations Center for Core Spacecraft
      – Instrument Operation Center for GMI #2
                                                          G O D D A R D   S P A C E   F L I G H T   C E N T E R   2
  GPM PM Perspectives, PM Challenge 2011
GPM Core Observatory
• Orbit: 407 km; 65 degree inclination                Solar Array
                                                                           HGA
                                                                                              Avionics
• 3 year design life with 5 years
  propellant
• Controlled re-entry at end of
  operational life
• GPM Microwave Imager (GMI) :
  Conically Scanned Radiometer (Ball
  Aerospace)
   – 10.6, 18.7, 23.8, 36.5, 89, 166, 183 GHz
• Dual-Frequency Precipitation Radar
  (DPR = KuPR + KaPR): JAXA
   – 13.6, 35.5 GHz
• Spacecraft bus: GSFC in-house                                                                             GMI

  design
   – Aluminum and Composite
   – Modular, fully-redundant avionics                     6.5 m
   – Steerable high-gain antenna on dual-hinged
     boom
   – Solar arrays track the sun
   – 12 thrusters (4 forward, 8 aft)
   – 240 Amp-hour Lithium Ion Battery
   – Size: 13.0m x 6.5m x 5.0m
                                                                                                KuPR
   – Mass: 3850 kg                                                          KaPR
   – Power: ~1950W                                                                     5.0 m
   – Data Rate:~ 300 Kbs (with onboard storage)
                                                  G O D D A R D     S P A C E   F L I G H T   C E N T E R     3
GPM PM Perspectives, PM Challenge 2011
Project Management Approach
• GPM Project Management consistent with NPR 7120.5D/NM 7120-81
   – Prescribes management practices, milestones, independent project-level reviews, etc.
   – Project Plan approved
   – GPM Project roles and responsibilities are clearly defined in the GPM Project Plan


• Project Manager responsible for technical, cost and schedule management
   – Strong systems oversight of all technical issues
   – Project staff monitors and controls cost and schedule


• Project is fully responsible and accountable for management and performance of
  all GPM activities for both in-house and out of house
   – Similar management approach and processes for both in-house and out-of-house work
   – Project approves key technical and programmatic documents such as specifications, schedules
     and budget, etc.


• Monitor and report status of development activities
   –   Written weekly reports to GSFC and HQ management
   –   GSFC Center Management Council, Flight Projects and Program Office Monthly reviews
   –   Weekly tag-up with Program Office
   –   Annual budget reviews with Program Office, Flight Projects, GSFC and Headquarters


                                                   G O D D A R D   S P A C E   F L I G H T   C E N T E R   4
GPM PM Perspectives, PM Challenge 2011
Management of In-House Activities
• Formal Peer Reviews on each subsystem before major milestones
  – GPM Peer Review Plan baselined
  – Independent technical review of products and processes with project and Standing
    Review Board member participation
  – All subsystems and systems formally peer reviewed before major milestones (e.g.
    PDR, CDR)
  – Table-top review of all drawings, manufacturing plans prior to fabrication


• Milestone reviews (PDR, CDR) conducted with Standing Review Board
  – Gate products tracked via spreadsheet and provided to SRB via NASA “Process
    Based Mission Assurance” website
  – Periodic telecons with SRB to follow up on review actions/concerns


• Status of development activities monitored each week/month
  – Weekly Systems and Observatory Staff meetings
  – Monthly Earned Value Management (EVM) cost/schedule reviews for each subsystem
  – Joint Project - engineering monthly technical review (Champion Team Review)
        • One manager from each engineering division will follow that division’s GPM flight
          hardware/software and assist in problem-solving
        • Monthly “Champion Team” reporting to engineering senior management
  – Engineering Division internal monthly technical status reviews
                                                      G O D D A R D   S P A C E   F L I G H T   C E N T E R   5
 GPM PM Perspectives, PM Challenge 2011
DPR Instrument Insight & Interface Management
• JAXA is an international partner
    – Signed Memorandum of Understanding (MOU) in place
    – Export/Import Control Plan baselined
•   Baselined Interface Control Document (ICD)
•   NASA-JAXA Joint Requirements document signed
•   Established S&MA “equivalence”
•   Monthly videocons
•   Exchange of Technical Interface Communications (TICs) and
    Issues
    – Weekly status update
• Face-to-face Technical Interface Meetings at least twice a year
  (US, Japan)
• Project participation in JAXA Interface reviews
    – Interface CDR conducted July 2009
    – Instrument Pre-Environmental Review planned for January 2011
• Monthly JAXA visit by the responsible product Lead

                                         G O D D A R D   S P A C E   F L I G H T   C E N T E R   6
GPM PM Perspectives, PM Challenge 2011
Schedule Implementation Overview
• Single Integrated Master Schedule used to manage the project

• Integrated Master Schedule (IMS) centralized, utilizing MS Project
  2007 tool for all in-house and out-of-house work
   – 3 Levels of Integrated Schedules with Custom Views
   – Organized by Work Breakdown Structure (WBS), Subsystem/Element,
     Lead
   – Schedule Generally based on a 1-8-5 GSFC Holiday Schedule Calendar
   – Activities are Linked to the 7/21/2013 Launch Readiness Date
   – Using Critical Path Method (CPM) and Total Slack is Tracked to Launch


• Critical, Cumulative, & EVMS Milestones are identified and
  Tracked monthly
   – Included in monthly schedule/cost reviews for each subsystem


                                                 G O D D A R D   S P A C E   F L I G H T   C E N T E R   7
GPM PM Perspectives, PM Challenge 2011
Example Subsystem Detailed Schedule


                                         G O D D A R D   S P A C E   F L I G H T   C E N T E R   8
GPM PM Perspectives, PM Challenge 2011
Example Subsystem Intermediate Schedule


                                         G O D D A R D   S P A C E   F L I G H T   C E N T E R   9
GPM PM Perspectives, PM Challenge 2011
Core Observatory Master Schedule    12/09 MCDR BL Rev: -
 (PPBE 2011 - Core LRD 7/21/2013)       Status as of: 9/30/10


                                                           10
Earned Value Management
                                (EVM)
                    Implementation/Management on
                                 GPM


                                         G O D D A R D   S P A C E   F L I G H T   C E N T E R   11
GPM PM Perspectives, PM Challenge 2011
EVM Implementation Approach
• GPM uses integrated EVM for the entire project
• Out of house contracts over $25M, EVM started at contract award
   – International Partners do not use EVM
• In-house EVM implementation started in March 2010
   – Actuals used for prior years
   – Implementation similar to industry standard
   – March 2010 Budget submit used as the baseline
• Baseline EVM remains unchanged every year, despite cost
  phasing requirement adjustments
• No EVM re-baseline permitted, unless funding constraint
  imposed by NASA HQ or launch readiness date is changed


                                             G O D D A R D   S P A C E   F L I G H T   C E N T E R   12
GPM PM Perspectives, PM Challenge 2011
Earned Value Management
• Subsystem Implementation Plans (SIPs) used to control cost and
  schedule
   – SIPs include baseline budget, detailed staffing plan, key milestones &
     deliverables, and subsystem detailed schedule
        • Detailed integrated excel spreadsheet used to develop SIPs
   – SIPs used as the control account, work package, and planning package
     authorizing document
• EVMS Software
   – MPM and Winsight
• Management Tools and Reports
   –   WBS and WBS Dictionary
   –   Responsibility Assignment Matrix (RAM)
   –   Monthly Contract Performance Reporting (CPR)’s
   –   Similar CPR reporting for In-house effort
• Monthly calculation of EVMS performance metrics included in
  monthly schedule/cost reviews for each subsystem
   – Reviewed by management monthly

                                              G O D D A R D   S P A C E   F L I G H T   C E N T E R   13
GPM PM Perspectives, PM Challenge 2011
Subsystem Implementation Plan (SIP) Budget Baseline


                                         G O D D A R D   S P A C E   F L I G H T   C E N T E R   14
GPM PM Perspectives, PM Challenge 2011
Example SIP Budget, Staffing FY11 by Month


                                            G O D D A R D   S P A C E   F L I G H T   C E N T E R   15
GPM PM Perspectives, PM Challenge 2011
Example SIP Budget, Staffing FY12 – FY14


                                               G O D D A R D   S P A C E   F L I G H T   C E N T E R   16
GPM PM Perspectives, PM Challenge 2011
Joint Confidence Level
                               (JCL)Cost and Schedule
                                 Estimation for GPM


                                         G O D D A R D   S P A C E   F L I G H T   C E N T E R   17
GPM PM Perspectives, PM Challenge 2011
GPM JCL Approach
• GPM uses the CEPA tool
   – NASA HQ provided VAI as consultants to assist GPM with JCL
• GPM JCL is top down
   – Captures the plan
        • Plan established at PDR (Nov 2008)
           – Total plan comprised of 24 activities from PDR through launch (July 2013)
        • WBS cost have two parts: Fixed and Variable cost
           – Fixed cost covers the core team that will carried to the end of the program
           – Variable cost covers designers, materials, manufacturing and test
   – Historical performance (actuals) measured PDR through March 2010
        • Actual cost and schedule vs. plan
• JCL analysis performed from April 2010 through launch
   – Inputs based on project’s forecast of cost and schedule performance for
     each of the 24 activities (5x5s), informed by historical performance data
   – The JCL Tool calculates the Fixed cost separately and with any schedule
     slips, it adds the Fixed cost to the total cost impact
        • 1000 sample Monte Carlo Simulation


                                               G O D D A R D   S P A C E   F L I G H T   C E N T E R   18
GPM PM Perspectives, PM Challenge 2011
5x5 set up
• WBS cost have two parts: Fixed and Variable cost
   – Fixed cost covers the core team that will carried to the end of the program
   – Variable cost covers designers, materials, manufacturing and test
• Only variable cost is entered in 5x5s for this tool
• Schedule column reflects how much of a serial impact to LRD
• 5x5 four corners


   – A1 (green) – Best achievable cost and schedule (taking into account current status)
   – A5        ) – Stretch the development due to part delays or other spacecraft
     hardware development for cost efficiency
   – E1 (blue) – Maximum practical amount of money spent to keep activity on schedule
   – E5 (red) - Worst case cost and schedule due to developmental problems
• The JCL Tool calculates the Fixed cost separately and with any
  schedule slips, it adds the Fixed cost to the total cost impact


                                              G O D D A R D   S P A C E   F L I G H T   C E N T E R   19
GPM PM Perspectives, PM Challenge 2011
Example Subsystem– PDR to March 2010 Look (18 Mos Window)
                                    FY09                                         FY10                                                    FY11                               FY12
                                                                                                                                                            FY12           FY13
                        Q1     Q2           Q3          Q4     Q1          Q2               Q3           Q4              Q1        Q2            Q3    Q4    Q1       Q2           Q3        Q4      Q1
PDR               G
                                                             LT Q     F
                                                                                                                  Life Test
             Qual G
             Qual H                                                             Assy             Test

               Flt G
               Flt H                                                                                                 Assy       Test

                 LR     ETU                      Qual                           Flight
                  F    0.2    0.3          0.3      0.3       0.3         0.2            0.2            0.2          0.2          0.2           0.2   0.2
COST              V    0.8    1.0          1.2      1.1       0.9         0.9            0.8            0.7          0.5          0.5           0.5   0.5                           4-10 thru 2013
                  T    1.0    1.3          1.5      1.4       1.2         1.1            1.0            0.9          0.7          0.7           0.7   0.7

                                    5.2                                         4.2                                                      2.8                 1.1           .9               6.7
                                F = 1.1                                         F = .9                                                 F = .8               F = .8     F = .8              F = 2.8
                                V = 4.1                                         V = 3.3                                                V = 2.0              V = .3     V = .1              V = 3.9

3-10              G
                                                                                        F         LT          Q
                                                                                                                                         Life Test
               Flt G                                                                                                                                                                  Schedule
                                                                                                                                                                                   Assessment = a
               Flt H                                                                                                      A/T
                                                                                                                                                                                   Loss of 7.5 Mos
             Qual G                                                                                               Assy
             Qual H                                                                                                                     A/T

                 LR                                                 ETU          Qual               Flight


                  F    0.2    0.2          0.2      0.3       0.3         0.3           0.3             0.3          0.3          0.3           0.3   0.3
COST                   0.8    0.9          0.9      0.9       1.1         1.4           1.2             1.1          1.0          0.9           0.7   0.5
                  V                                                                                                                                                                 4-10 thru 2013
                  T    1.0    1.1          1.1      1.2       1.4         1.7           1.5             1.4          1.3          1.2           1.0   0.8

                                    4.4
                                    7.5                                          6.0
                                                                                10.5                                                     4.3
                                                                                                                                         4.3                 2.2
                                                                                                                                                             1.2           .7
                                                                                                                                                                           .9               9.2
                                F = .9                                          F = 1.3                                                F = 1.3              F = .7     F = .5              F = 3.1
                                V = 3.5                                         V = 4.7                                                V = 3.1              V = .5     V = .2              V = 6.1
                    Historical Performance                                                                                                                                              PDR to go = 3.9
                      Measure for 18 Mos
                           Window                                                                                                                               V$
                                                                                                                                                                                        Roll Thru = 2.4
       Accomplished 10.5 Mos                                                                                                                                                            Total Plan = 6.3
       Lost 7.5 Mos                                                                                                           Performance @ 100%             = 6.3
                                                                                       Roll thru                                             86%             = 7.3
       Value of 7.5 = $2.4M (Var $)                                                     $2.4M                                                                                               @ 100%
                                                                                                                                             72%             = 8.8
       Perform is: Var Accom = 3.5                                                                                                           58%             = 10.9
                                                    = .58                                                                                    44%             = 14.3
                   Var Spent = 6.0

                                                                                                                                                                                                           20
Output from 1000 Monte Carlo Cases


                                            G O D D A R D   S P A C E   F L I G H T   C E N T E R   21
GPM PM Perspectives, PM Challenge 2011
Project Management Perspectives
• AETD (Engineering) Champion team is very successful in
  assisting with keeping the project on track
• Single integrated master schedule, with monthly tracking at
  detailed level is critical in understanding and managing in-house
  progress and working around development problems
• Working with GSFC EVM team and building on LRO experience
  to successfully implement EVM for the GPM Project
• Regular videocons and frequent exchange of technical
  communications (TICs) with JAXA keeps the international
  partnership on track
• Frequent interaction with SRB had mixed success
   – SRB participation in peer reviews meant that key members were informed
     about the design prior to major reviews
   – Additional overhead of follow-up telecons
• Use of top-down CEPA tool for JCL kept the effort manageable
  and simple
   – Project and SRB were in learning mode on JCL and the tool
   – JCL result useful for mitigating potential FY budget shortfalls
                                                G O D D A R D   S P A C E   F L I G H T   C E N T E R   22
GPM PM Perspectives, PM Challenge 2011
Core Observatory Alignment Test


        Flight Structure assembled                    DPR alignment test completed


                                                G O D D A R D   S P A C E   F L I G H T   C E N T E R   23
GPM PM Perspectives, PM Challenge 2011
GPM Lower Bus Structure in Clean Room


                                         G O D D A R D   S P A C E   F L I G H T   C E N T E R   24
GPM PM Perspectives, PM Challenge 2011

Carsile.azarbain

  • 1.
    Global Precipitation Measurement (GPM) Project Management Perspectives on In-House Development PM Challenge February 2011 Art Azarbarzin Project Manager Candace Carlisle Deputy Project Manager Jackie Fiora Deputy Project Manager/Resources G O D D A R D S P A C E F L I G H T C E N T E R 1
  • 2.
    Global Precipitation MeasurementOverview Mission Objective: • Improve scientific understanding of the global water cycle and fresh water availability • Improve the accuracy of precipitation forecasts • Provide frequent and complete sampling of the Earth’s precipitation Mission Description (Class B, Category I): • Constellation of spacecraft provide global precipitation measurement coverage – NASA/JAXA Core spacecraft: Provides a microwave radiometer (GMI) and dual-frequency precipitation radar (DPR) to cross-calibrate entire constellation • 65o inclination, 400 km altitude • Launch July 2013 on HII-A • 3 year mission (5 year propellant) – Second GMI instrument to be accommodated on a TBD partner-provided Low-Inclination spacecraft: • Partners Complements Core spacecraft and partner assets – Japanese Aerospace and Exploration (JAXA) • ~40o inclination, ~600 km altitude • DPR instruments for Core spacecraft • Launch late 2014 (TBR) • Launch service for Core spacecraft – Partner constellation spacecraft: Provided by – TBD, LIO Spacecraft and Launch Vehicle JAXA, DoD, NOAA, other space agencies – Other U.S. and international agencies • Ground assets • Data from radiometers (e.g. IPO NPP, DOD – Precipitation Processing System: Data DMSP, JAXA GCOM-W, Megha-Tropiques) processing, archive, distribution for the entire • Ground validation partnerships constellation of spacecraft – Universities – Ground validation system: Uses world-wide network of • Ground validation partnerships ground-based measurements to validate space measurements and algorithms • Science team participation – Mission Operations Center for Core Spacecraft – Instrument Operation Center for GMI #2 G O D D A R D S P A C E F L I G H T C E N T E R 2 GPM PM Perspectives, PM Challenge 2011
  • 3.
    GPM Core Observatory •Orbit: 407 km; 65 degree inclination Solar Array HGA Avionics • 3 year design life with 5 years propellant • Controlled re-entry at end of operational life • GPM Microwave Imager (GMI) : Conically Scanned Radiometer (Ball Aerospace) – 10.6, 18.7, 23.8, 36.5, 89, 166, 183 GHz • Dual-Frequency Precipitation Radar (DPR = KuPR + KaPR): JAXA – 13.6, 35.5 GHz • Spacecraft bus: GSFC in-house GMI design – Aluminum and Composite – Modular, fully-redundant avionics 6.5 m – Steerable high-gain antenna on dual-hinged boom – Solar arrays track the sun – 12 thrusters (4 forward, 8 aft) – 240 Amp-hour Lithium Ion Battery – Size: 13.0m x 6.5m x 5.0m KuPR – Mass: 3850 kg KaPR – Power: ~1950W 5.0 m – Data Rate:~ 300 Kbs (with onboard storage) G O D D A R D S P A C E F L I G H T C E N T E R 3 GPM PM Perspectives, PM Challenge 2011
  • 4.
    Project Management Approach •GPM Project Management consistent with NPR 7120.5D/NM 7120-81 – Prescribes management practices, milestones, independent project-level reviews, etc. – Project Plan approved – GPM Project roles and responsibilities are clearly defined in the GPM Project Plan • Project Manager responsible for technical, cost and schedule management – Strong systems oversight of all technical issues – Project staff monitors and controls cost and schedule • Project is fully responsible and accountable for management and performance of all GPM activities for both in-house and out of house – Similar management approach and processes for both in-house and out-of-house work – Project approves key technical and programmatic documents such as specifications, schedules and budget, etc. • Monitor and report status of development activities – Written weekly reports to GSFC and HQ management – GSFC Center Management Council, Flight Projects and Program Office Monthly reviews – Weekly tag-up with Program Office – Annual budget reviews with Program Office, Flight Projects, GSFC and Headquarters G O D D A R D S P A C E F L I G H T C E N T E R 4 GPM PM Perspectives, PM Challenge 2011
  • 5.
    Management of In-HouseActivities • Formal Peer Reviews on each subsystem before major milestones – GPM Peer Review Plan baselined – Independent technical review of products and processes with project and Standing Review Board member participation – All subsystems and systems formally peer reviewed before major milestones (e.g. PDR, CDR) – Table-top review of all drawings, manufacturing plans prior to fabrication • Milestone reviews (PDR, CDR) conducted with Standing Review Board – Gate products tracked via spreadsheet and provided to SRB via NASA “Process Based Mission Assurance” website – Periodic telecons with SRB to follow up on review actions/concerns • Status of development activities monitored each week/month – Weekly Systems and Observatory Staff meetings – Monthly Earned Value Management (EVM) cost/schedule reviews for each subsystem – Joint Project - engineering monthly technical review (Champion Team Review) • One manager from each engineering division will follow that division’s GPM flight hardware/software and assist in problem-solving • Monthly “Champion Team” reporting to engineering senior management – Engineering Division internal monthly technical status reviews G O D D A R D S P A C E F L I G H T C E N T E R 5 GPM PM Perspectives, PM Challenge 2011
  • 6.
    DPR Instrument Insight& Interface Management • JAXA is an international partner – Signed Memorandum of Understanding (MOU) in place – Export/Import Control Plan baselined • Baselined Interface Control Document (ICD) • NASA-JAXA Joint Requirements document signed • Established S&MA “equivalence” • Monthly videocons • Exchange of Technical Interface Communications (TICs) and Issues – Weekly status update • Face-to-face Technical Interface Meetings at least twice a year (US, Japan) • Project participation in JAXA Interface reviews – Interface CDR conducted July 2009 – Instrument Pre-Environmental Review planned for January 2011 • Monthly JAXA visit by the responsible product Lead G O D D A R D S P A C E F L I G H T C E N T E R 6 GPM PM Perspectives, PM Challenge 2011
  • 7.
    Schedule Implementation Overview •Single Integrated Master Schedule used to manage the project • Integrated Master Schedule (IMS) centralized, utilizing MS Project 2007 tool for all in-house and out-of-house work – 3 Levels of Integrated Schedules with Custom Views – Organized by Work Breakdown Structure (WBS), Subsystem/Element, Lead – Schedule Generally based on a 1-8-5 GSFC Holiday Schedule Calendar – Activities are Linked to the 7/21/2013 Launch Readiness Date – Using Critical Path Method (CPM) and Total Slack is Tracked to Launch • Critical, Cumulative, & EVMS Milestones are identified and Tracked monthly – Included in monthly schedule/cost reviews for each subsystem G O D D A R D S P A C E F L I G H T C E N T E R 7 GPM PM Perspectives, PM Challenge 2011
  • 8.
    Example Subsystem DetailedSchedule G O D D A R D S P A C E F L I G H T C E N T E R 8 GPM PM Perspectives, PM Challenge 2011
  • 9.
    Example Subsystem IntermediateSchedule G O D D A R D S P A C E F L I G H T C E N T E R 9 GPM PM Perspectives, PM Challenge 2011
  • 10.
    Core Observatory MasterSchedule 12/09 MCDR BL Rev: - (PPBE 2011 - Core LRD 7/21/2013) Status as of: 9/30/10 10
  • 11.
    Earned Value Management (EVM) Implementation/Management on GPM G O D D A R D S P A C E F L I G H T C E N T E R 11 GPM PM Perspectives, PM Challenge 2011
  • 12.
    EVM Implementation Approach •GPM uses integrated EVM for the entire project • Out of house contracts over $25M, EVM started at contract award – International Partners do not use EVM • In-house EVM implementation started in March 2010 – Actuals used for prior years – Implementation similar to industry standard – March 2010 Budget submit used as the baseline • Baseline EVM remains unchanged every year, despite cost phasing requirement adjustments • No EVM re-baseline permitted, unless funding constraint imposed by NASA HQ or launch readiness date is changed G O D D A R D S P A C E F L I G H T C E N T E R 12 GPM PM Perspectives, PM Challenge 2011
  • 13.
    Earned Value Management •Subsystem Implementation Plans (SIPs) used to control cost and schedule – SIPs include baseline budget, detailed staffing plan, key milestones & deliverables, and subsystem detailed schedule • Detailed integrated excel spreadsheet used to develop SIPs – SIPs used as the control account, work package, and planning package authorizing document • EVMS Software – MPM and Winsight • Management Tools and Reports – WBS and WBS Dictionary – Responsibility Assignment Matrix (RAM) – Monthly Contract Performance Reporting (CPR)’s – Similar CPR reporting for In-house effort • Monthly calculation of EVMS performance metrics included in monthly schedule/cost reviews for each subsystem – Reviewed by management monthly G O D D A R D S P A C E F L I G H T C E N T E R 13 GPM PM Perspectives, PM Challenge 2011
  • 14.
    Subsystem Implementation Plan(SIP) Budget Baseline G O D D A R D S P A C E F L I G H T C E N T E R 14 GPM PM Perspectives, PM Challenge 2011
  • 15.
    Example SIP Budget,Staffing FY11 by Month G O D D A R D S P A C E F L I G H T C E N T E R 15 GPM PM Perspectives, PM Challenge 2011
  • 16.
    Example SIP Budget,Staffing FY12 – FY14 G O D D A R D S P A C E F L I G H T C E N T E R 16 GPM PM Perspectives, PM Challenge 2011
  • 17.
    Joint Confidence Level (JCL)Cost and Schedule Estimation for GPM G O D D A R D S P A C E F L I G H T C E N T E R 17 GPM PM Perspectives, PM Challenge 2011
  • 18.
    GPM JCL Approach •GPM uses the CEPA tool – NASA HQ provided VAI as consultants to assist GPM with JCL • GPM JCL is top down – Captures the plan • Plan established at PDR (Nov 2008) – Total plan comprised of 24 activities from PDR through launch (July 2013) • WBS cost have two parts: Fixed and Variable cost – Fixed cost covers the core team that will carried to the end of the program – Variable cost covers designers, materials, manufacturing and test – Historical performance (actuals) measured PDR through March 2010 • Actual cost and schedule vs. plan • JCL analysis performed from April 2010 through launch – Inputs based on project’s forecast of cost and schedule performance for each of the 24 activities (5x5s), informed by historical performance data – The JCL Tool calculates the Fixed cost separately and with any schedule slips, it adds the Fixed cost to the total cost impact • 1000 sample Monte Carlo Simulation G O D D A R D S P A C E F L I G H T C E N T E R 18 GPM PM Perspectives, PM Challenge 2011
  • 19.
    5x5 set up •WBS cost have two parts: Fixed and Variable cost – Fixed cost covers the core team that will carried to the end of the program – Variable cost covers designers, materials, manufacturing and test • Only variable cost is entered in 5x5s for this tool • Schedule column reflects how much of a serial impact to LRD • 5x5 four corners – A1 (green) – Best achievable cost and schedule (taking into account current status) – A5 ) – Stretch the development due to part delays or other spacecraft hardware development for cost efficiency – E1 (blue) – Maximum practical amount of money spent to keep activity on schedule – E5 (red) - Worst case cost and schedule due to developmental problems • The JCL Tool calculates the Fixed cost separately and with any schedule slips, it adds the Fixed cost to the total cost impact G O D D A R D S P A C E F L I G H T C E N T E R 19 GPM PM Perspectives, PM Challenge 2011
  • 20.
    Example Subsystem– PDRto March 2010 Look (18 Mos Window) FY09 FY10 FY11 FY12 FY12 FY13 Q1 Q2 Q3 Q4 Q1 Q2 Q3 Q4 Q1 Q2 Q3 Q4 Q1 Q2 Q3 Q4 Q1 PDR G LT Q F Life Test Qual G Qual H Assy Test Flt G Flt H Assy Test LR ETU Qual Flight F 0.2 0.3 0.3 0.3 0.3 0.2 0.2 0.2 0.2 0.2 0.2 0.2 COST V 0.8 1.0 1.2 1.1 0.9 0.9 0.8 0.7 0.5 0.5 0.5 0.5 4-10 thru 2013 T 1.0 1.3 1.5 1.4 1.2 1.1 1.0 0.9 0.7 0.7 0.7 0.7 5.2 4.2 2.8 1.1 .9 6.7 F = 1.1 F = .9 F = .8 F = .8 F = .8 F = 2.8 V = 4.1 V = 3.3 V = 2.0 V = .3 V = .1 V = 3.9 3-10 G F LT Q Life Test Flt G Schedule Assessment = a Flt H A/T Loss of 7.5 Mos Qual G Assy Qual H A/T LR ETU Qual Flight F 0.2 0.2 0.2 0.3 0.3 0.3 0.3 0.3 0.3 0.3 0.3 0.3 COST 0.8 0.9 0.9 0.9 1.1 1.4 1.2 1.1 1.0 0.9 0.7 0.5 V 4-10 thru 2013 T 1.0 1.1 1.1 1.2 1.4 1.7 1.5 1.4 1.3 1.2 1.0 0.8 4.4 7.5 6.0 10.5 4.3 4.3 2.2 1.2 .7 .9 9.2 F = .9 F = 1.3 F = 1.3 F = .7 F = .5 F = 3.1 V = 3.5 V = 4.7 V = 3.1 V = .5 V = .2 V = 6.1 Historical Performance PDR to go = 3.9 Measure for 18 Mos Window V$ Roll Thru = 2.4 Accomplished 10.5 Mos Total Plan = 6.3 Lost 7.5 Mos Performance @ 100% = 6.3 Roll thru 86% = 7.3 Value of 7.5 = $2.4M (Var $) $2.4M @ 100% 72% = 8.8 Perform is: Var Accom = 3.5 58% = 10.9 = .58 44% = 14.3 Var Spent = 6.0 20
  • 21.
    Output from 1000Monte Carlo Cases G O D D A R D S P A C E F L I G H T C E N T E R 21 GPM PM Perspectives, PM Challenge 2011
  • 22.
    Project Management Perspectives •AETD (Engineering) Champion team is very successful in assisting with keeping the project on track • Single integrated master schedule, with monthly tracking at detailed level is critical in understanding and managing in-house progress and working around development problems • Working with GSFC EVM team and building on LRO experience to successfully implement EVM for the GPM Project • Regular videocons and frequent exchange of technical communications (TICs) with JAXA keeps the international partnership on track • Frequent interaction with SRB had mixed success – SRB participation in peer reviews meant that key members were informed about the design prior to major reviews – Additional overhead of follow-up telecons • Use of top-down CEPA tool for JCL kept the effort manageable and simple – Project and SRB were in learning mode on JCL and the tool – JCL result useful for mitigating potential FY budget shortfalls G O D D A R D S P A C E F L I G H T C E N T E R 22 GPM PM Perspectives, PM Challenge 2011
  • 23.
    Core Observatory AlignmentTest Flight Structure assembled DPR alignment test completed G O D D A R D S P A C E F L I G H T C E N T E R 23 GPM PM Perspectives, PM Challenge 2011
  • 24.
    GPM Lower BusStructure in Clean Room G O D D A R D S P A C E F L I G H T C E N T E R 24 GPM PM Perspectives, PM Challenge 2011