Download as PDF, PPTX
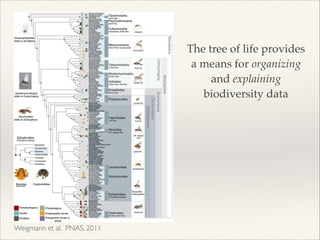
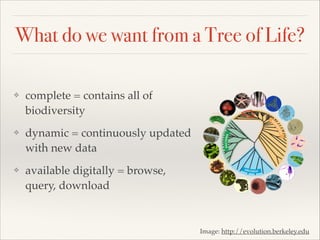
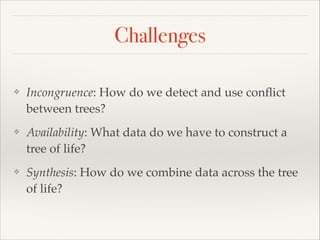
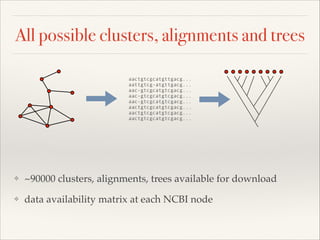
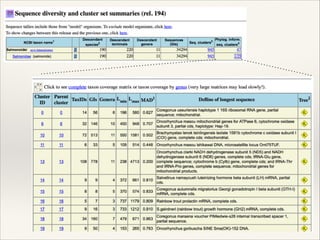
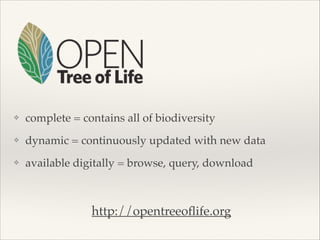
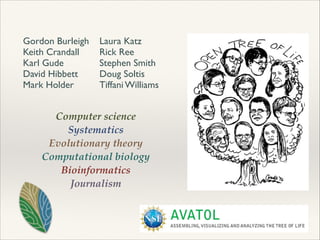
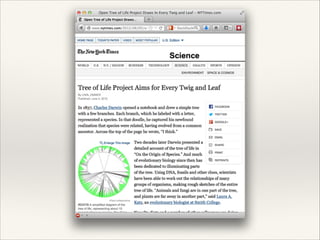
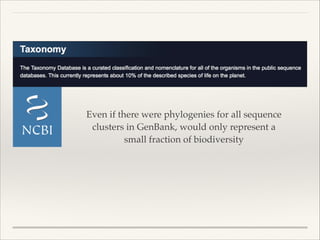
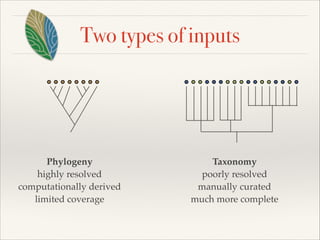
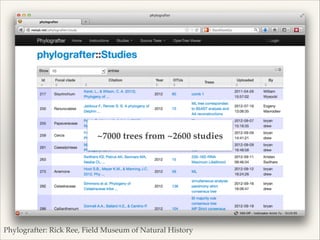
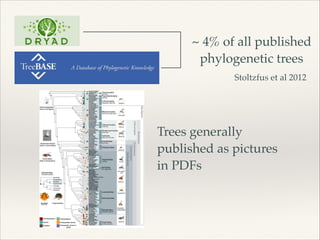
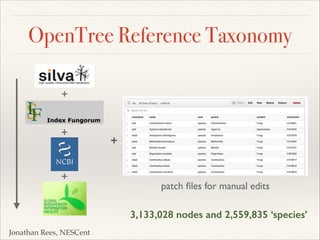
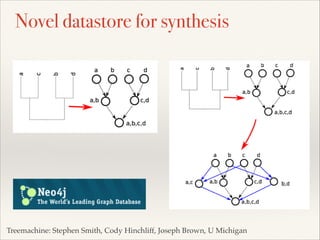
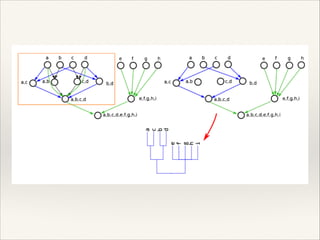
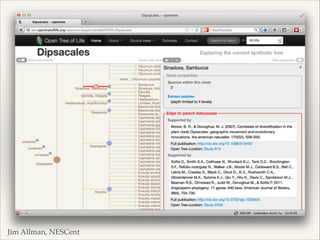
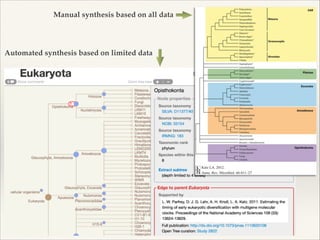
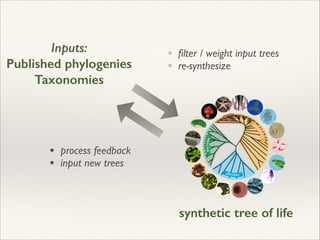
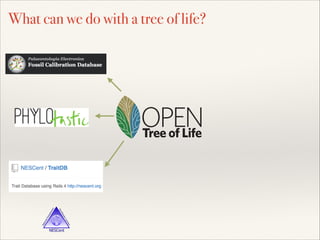
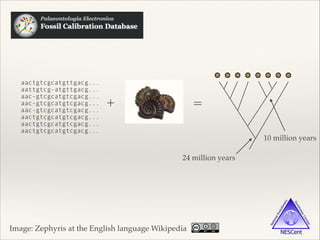
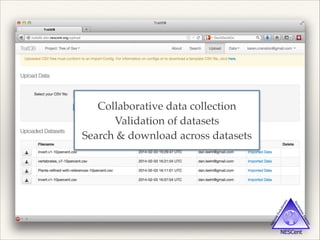
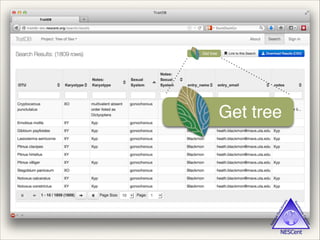
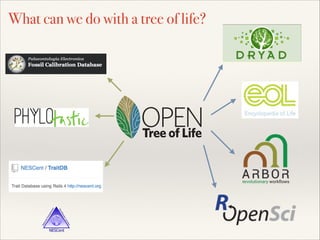

The document discusses the tree of life and efforts to construct a complete digital tree of life. It notes that an ideal tree of life would be complete, continuously updated, and digitally available. Several challenges are outlined, including how to handle incongruences between trees and how to synthesize data across the entire tree. Efforts are underway to synthesize published phylogenetic data and make tree of life resources and data openly available online. Remaining challenges include improving taxonomic coverage, incorporating time information, and enabling community feedback and annotation. The goal is to move beyond a single tree and provide tools to enable custom synthesis and integration with other resources and data.


![Polymer [ बहुलक ] Chemistry Notes PDF - Irfanullah Mehar - JJ Sir Chemistry.pdf](https://cdn.slidesharecdn.com/ss_thumbnails/polymerchemistrynotespdf-irfanullahmehar-jjsirchemistry-260210172118-3f9b37f7-thumbnail.jpg?width=640&height=640&fit=bounds)


