1. Reticulate evolutionary strategies are favoured when pathogens cross host
species barriers.
Eric J. Ma, Nichola J. Hill, Kyle Yuan, Justin Zabilansky, Jonathan A. Runstadler
Department of Biological Engineering & Division of Comparative Medicine, MIT
Research Questions
• How important is reticulate evolution as a process for pathogen evolution?
• What is the role of reticulate evolution in pathogen ecology?
Algorithm
A
B
C
Tree
t
Network
A B C
t
All Edges
x8
Threshold
x8
Max
x8
Source Pair
• Phylogenetic hueristic: search for sources of genetic material.
• Maximize genetic similarity, while minimizing number of sources.
• Heuristic method is akin to “flattening” a phylogenetic tree.
Reassortment
Transmission
or
Influenza Genome Structure Reassortment
1 PB2 2.4 kb
2 PB1 2.4 kb
3 PA 2.2 kb
4 HA 1.8 kb
5 NP 1.6 kb
6 NA 1.5 kb
7 M 1.0 kb
8 NS 0.9 kb
• Segmented genome; can reassort (this is influenza’s reticulate evolution mechanism)
• Multiple subtypes, competition for hosts, but also cooperation via gene sharing.
• Abundant sequence data with matched metadata, densely sampled.
Flu: A Model Pathogen
Introduction
Reassortment Detection
Reassortment Importance
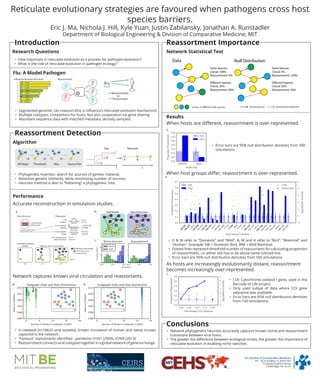
Network Statistical Test
Data Null Distribution
Same Species
Clonal: 100%
Reassortment: 0%
Different Species
Clonal: 20%
Reassortment: 80%
Same Species
Clonal: 0%
Reassortment: 100%
Different Species
Clonal: 50%
Reassortment: 50%
viruses in different host species. clonal descent reassortment descent
Results
• Error bars are 95% null distribution densities from 500
simulations.
When hosts are different, reassortment is over-represented.
• D & W refer to “Domestic” and “Wild”. B, M and H refer to “Bird”, “Mammal” and
“Human”. Example: DB = Domestic Bird, WM = Wild Mammal.
• Dotted lines represent threshold number of reassortants for calculating proportion
of reassortment, i.e. either dot has to be above same-colored line.
• Error bars are 95% null distribution densities from 500 simulations.
When host groups differ, reassortment is over-represented.
• COI: Cytochrome oxidase I gene, used in the
Barcode of Life project.
• Only used subset of data where COI gene
sequence was available.
• Error bars are 95% null distribution densities
from 100 simulations.
As hosts are increasingly evolutionarily distant, reassortment
becomes increasingly over-represented.
Performance
Simulation Process
t=0 t=1 t=2
Virus Structure
high mutation rate
regular mutation rate
initialize replicate, reassort, and mutate
...
Parameters
# of
progeny
# of mutations
(regular)
# of mutations
(high)
μ=1.2
σ2
=0.5
n=300 or 200
p=0.008
min=20
max=60
Normal
Binomial
Uniform
different viral lineages
reassortant virus
two segments
600 bp total
300
200 100
reassortment
# of starting viruses
total # of viruses
1 to 4
20 to 50
a. ReconstructionNull Modelb.
Accurate reconstruction in simulation studies.
Network captures known viral circulation and reassortants.
tt
• In network (n=18632 viral isolates), known circulation of human and swine viruses
captured in the network.
• “Famous” reassortants identified - pandemic H1N1 (2009), H7N9 (2013).
• Reassortment connects viral subtypes together in a global network of gene exchange.
Conclusions
• Network phylogenetic heuristic accurately captures known clonal and reassortment
transitions between viral hosts.
• The greater the difference between ecological niches, the greater the importance of
reticulate evolution in enabling niche switches.