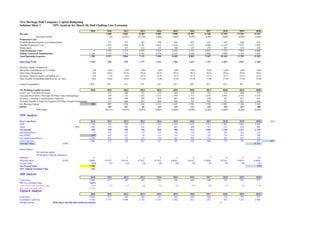
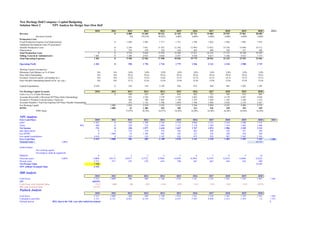
New Heritage Doll Company: Capital Budgeting
Solution Sheet 1 NPV Analysis for Match My Doll Clothing Line Extension
2010 2011 2012 2013 2014 2015 2016 2017 2018 2019 2020
Revenue 4 500 6 860 8 409 9 082 9 808 10 593 11 440 12 355 13 344 14 411
Revenue Growth NA 52,44% 22,58% 8,00% 8,00% 8,00% 8,00% 8,00% 8,00% 8,00%
Production Costs
Fixed Production Expense (excl depreciation) 575 575 587 598 610 622 635 648 660 674
Variable Production Costs 2 035 3 404 4 291 4 669 5 078 5 521 6 000 6 519 7 079 7 685
Depreciation 152 152 152 152 164 178 192 207 224 242
Total Production Costs 0 2 762 4 131 5 029 5 419 5 853 6 321 6 827 7 373 7 963 8 600
Selling, General & Administrative 1 250 1 155 1 735 2 102 2 270 2 452 2 648 2 860 3 089 3 336 3 603
Total Operating Expenses 1 250 3 917 5 866 7 132 7 690 8 305 8 969 9 687 10 462 11 299 12 203
Operating Profit -1 250 583 994 1 277 1 392 1 503 1 623 1 753 1 893 2 045 2 209
Working Capital Assumptions:
Minimum Cash Balance as % of Sales NA 3,0% 3,0% 3,0% 3,0% 3,0% 3,0% 3,0% 3,0% 3,0% 3,0%
Days Sales Outstanding NA 59,2x 59,2x 59,2x 59,2x 59,2x 59,2x 59,2x 59,2x 59,2x 59,2x
Inventory Turnover (prod. cost/ending inv.) NA 7,7x 8,3x 12,7x 12,7x 12,7x 12,7x 12,7x 12,7x 12,7x 12,7x
Days Payable Outstanding (based on tot. op. exp.) 0,0x 30,8x 30,9x 31,0x 31,0x 31,0x 31,0x 31,0x 31,0x 31,0x 31,0x
Capital Expenditures 1 470 952 152 152 334 361 389 421 454 491 530
Net Working Capital Accounts 2010 2011 2012 2013 2014 2015 2016 2017 2018 2019 2020
Cash (=as a % of Sales Revenue) 135 206 252 272 294 318 343 371 400 432
Accounts Receivable (=Revenue/365*Days Sales Outstanding) 729 1 112 1 363 1 472 1 590 1 717 1 855 2 003 2 163 2 336
Inventory (=Prodctn Costs/Inventory Turnover) 360 500 396 427 461 498 538 581 627 677
Accounts Payable (=Total Op Expenses/365*Days Payable Outstanding) 317 484 593 640 692 747 807 871 941 1 016
Net Working Capital 800 907 1 334 1 418 1 531 1 653 1 786 1 929 2 083 2 250 2 429
DNWC 107 427 84 113 122 132 143 154 167 180
NWC/Sales 20,15% 19,45% 16,87% 16,86% 16,86% 16,86% 16,86% 16,86% 16,86% 16,86%
NPV Analysis
Free Cash Flows 2010 2011 2012 2013 2014 2015 2016 2017 2018 2019 2020 2021
EBIT -1 250 583 994 1 277 1 392 1 503 1 623 1 753 1 893 2 045 2 209
Taxes 40% -500 233 398 511 557 601 649 701 757 818 883
Net Income -750 350 596 766 835 902 974 1 052 1 136 1 227 1 325
plus depreciation 0 152 152 152 152 164 178 192 207 224 242
less DNWC 800 107 427 84 113 122 132 143 154 167 180
less capital expenditures 1 470 952 152 152 334 361 389 421 454 491 530
Free Cash Flow -3 020 -557 169 682 541 583 630 680 735 793 857 883
Terminal value 3,00% 16 345
Initial Outlays
Net working capital
Net property, plant & equipment
PERIOD 0 1 2 3 4 5 6 7 8 9 10
Discount factor 8,40% 1,0000 0,9225 0,8510 0,7851 0,7242 0,6681 0,6163 0,5686 0,5245 0,4839 0,4464
Present value -3020 -514 144 536 392 390 388 387 385 384 383
Net Present Value 7 150 7296
NPV without Terminal Value -146
IRR Analysis
2010 2011 2012 2013 2014 2015 2016 2017 2018 2019 2020
Cash Flows -3 020 -557 169 682 541 583 630 680 735 793 857
IRR w/o Terminal Value 7,64%
Cash Flows with Terminal Value -3020 -557 169 682 541 583 630 680 735 793 17202
IRR with Terminal Value 23,99%
Payback Analysis
2010 2011 2012 2013 2014 2015 2016 2017 2018 2019 2020
Cash flows -3 020 -557 169 682 541 583 630 680 735 793 857
Cumulative cash flow -3 020 -3 577 -3 408 -2 726 -2 185 -1 602 -972 -291 443 1 237 2 094
Payback period 2018, that is the 8th after initial investment X
New Heritage Doll Company: Capital Budgeting
Solution Sheet 2 NPV Analyss for Design Your Own Doll
2010 2011 2012 2013 2014 2015 2016 2017 2018 2019 2020 2021
Revenue 0 6 000 14 360 20 222 21 435 22 721 24 084 25 529 27 061 28 685
Revenue Growth NA 139,33% 40,82% 6,00% 6,00% 6,00% 6,00% 6,00% 6,00%
Production Costs
Fixed Production Expense (excl depreciation) 0 1 650 1 683 1 717 1 751 1 786 1 822 1 858 1 895 1 933
Additional development costs (IT personnel)
Variable Production Costs 0 2 250 7 651 11 427 12 182 12 983 13 833 14 736 15 694 16 712
Depreciation 0 310 310 310 436 462 490 520 551 584
Total Production Costs 0 0 4 210 9 644 13 454 14 369 15 231 16 145 17 113 18 140 19 229
Selling, General & Administrative 1 201 0 1 240 2 922 4 044 4 287 4 544 4 817 5 106 5 412 5 737
Total Operating Expenses 1 201 0 5 450 12 566 17 498 18 656 19 775 20 962 22 219 23 553 24 966
Operating Profit -1 201 0 550 1 794 2 724 2 779 2 946 3 123 3 310 3 508 3 719
Working Capital Assumptions:
Minimum Cash Balance as % of Sales NA NA 3,0% 3,0% 3,0% 3,0% 3,0% 3,0% 3,0% 3,0% 3,0%
Days Sales Outstanding NA NA 59,2x 59,2x 59,2x 59,2x 59,2x 59,2x 59,2x 59,2x 59,2x
Inventory Turnover (prod. cost/ending inv.) NA NA 12,2x 12,3x 12,6x 12,7x 12,7x 12,7x 12,7x 12,7x 12,7x
Days Payable Outstanding (based on tot. op. exp.) NA NA 33,7x 33,8x 33,9x 33,9x 33,9x 33,9x 33,9x 33,9x 33,9x
Capital Expenditures 4 610 0 310 310 2 192 826 875 928 983 1 043 1 105
Net Working Capital Accounts 2010 2011 2012 2013 2014 2015 2016 2017 2018 2019 2020
Cash (=as a % of Sales Revenue) 0 180 431 607 643 682 723 766 812 861
Accounts Receivable (=Revenue/365*Days Sales Outstanding) 973 2 328 3 278 3 475 3 683 3 904 4 139 4 387 4 650
Inventory (=Prodctn Costs/Inventory Turnover) 346 786 1 065 1 130 1 197 1 269 1 345 1 426 1 512
Accounts Payable (=Total Op Expenses/365*Days Payable Outstanding) 474 1 135 1 598 1 694 1 796 1 904 2 018 2 139 2 267
Net Working Capital 1 000 1 024 2 410 3 352 3 553 3 766 3 992 4 232 4 486 4 755
DNWC 1 000 24 1 386 942 202 213 226 240 254 269
NWC/Sales 17,07% 16,78% 16,57% 16,58% 16,58% 16,58% 16,58% 16,58% 16,58%
NPV Analysis
Free Cash Flows 2010 2011 2012 2013 2014 2015 2016 2017 2018 2019 2020 2021
EBIT -1 201 0 550 1 794 2 724 2 779 2 946 3 123 3 310 3 508 3 719
Taxes 40% -480 0 220 718 1 089 1 112 1 178 1 249 1 324 1 403 1 488
Net Income -721 0 330 1 077 1 634 1 667 1 767 1 874 1 986 2 105 2 231
plus depreciation 0 0 310 310 310 436 462 490 520 551 584
less DNWC 0 1 000 24 1 386 942 202 213 226 240 254 269
less capital expenditures 4 610 0 310 310 2 192 826 875 928 983 1 043 1 105
Free Cash Flow -5 331 -1 000 306 -309 -1 190 1 076 1 141 1 210 1 283 1 359 1 441 1 484
Terminal value 3,00% 24 737
Initial Outlays
Net working capital
Net property, plant & equipment
PERIOD 0 1 2 3 4 5 6 7 8 9 10
Discount factor 9,00% 1,0000 0,9174 0,8417 0,7722 0,7084 0,6499 0,5963 0,5470 0,5019 0,4604 0,4224
Present value -5 331 -917 258 -239 -843 700 681 662 644 626 609
Net Present Value 7 298 10 449
NPV without Terminal Value -3 152
IRR Analysis
2010 2011 2012 2013 2014 2015 2016 2017 2018 2019 2020
Cash Flows -5 331 -1 000 306 -309 -1 190 1 076 1 141 1 210 1 283 1 359 1 441 1 484
IRR -0,024%
Cash Flows with Terminal Value -5331 -1000 306 -309 -1190 1076 1141 1210 1283 1359 26178
IRR with Terminal Value 18,33%
Payback Analysis
2010 2011 2012 2013 2014 2015 2016 2017 2018 2019 2020
Cash flows -5 331 -1 000 306 -309 -1 190 1 076 1 141 1 210 1 283 1 359 1 441 1 484
Cumulative cash flow -5 331 -6 331 -6 025 -6 334 -7 523 -6 447 -5 305 -4 096 -2 813 -1 454 -13 1 472
Payback period 2021, that is the 11th year after initial investment X

120981064 new-doll

  • 1.
    New Heritage DollCompany: Capital Budgeting Solution Sheet 1 NPV Analysis for Match My Doll Clothing Line Extension 2010 2011 2012 2013 2014 2015 2016 2017 2018 2019 2020 Revenue 4 500 6 860 8 409 9 082 9 808 10 593 11 440 12 355 13 344 14 411 Revenue Growth NA 52,44% 22,58% 8,00% 8,00% 8,00% 8,00% 8,00% 8,00% 8,00% Production Costs Fixed Production Expense (excl depreciation) 575 575 587 598 610 622 635 648 660 674 Variable Production Costs 2 035 3 404 4 291 4 669 5 078 5 521 6 000 6 519 7 079 7 685 Depreciation 152 152 152 152 164 178 192 207 224 242 Total Production Costs 0 2 762 4 131 5 029 5 419 5 853 6 321 6 827 7 373 7 963 8 600 Selling, General & Administrative 1 250 1 155 1 735 2 102 2 270 2 452 2 648 2 860 3 089 3 336 3 603 Total Operating Expenses 1 250 3 917 5 866 7 132 7 690 8 305 8 969 9 687 10 462 11 299 12 203 Operating Profit -1 250 583 994 1 277 1 392 1 503 1 623 1 753 1 893 2 045 2 209 Working Capital Assumptions: Minimum Cash Balance as % of Sales NA 3,0% 3,0% 3,0% 3,0% 3,0% 3,0% 3,0% 3,0% 3,0% 3,0% Days Sales Outstanding NA 59,2x 59,2x 59,2x 59,2x 59,2x 59,2x 59,2x 59,2x 59,2x 59,2x Inventory Turnover (prod. cost/ending inv.) NA 7,7x 8,3x 12,7x 12,7x 12,7x 12,7x 12,7x 12,7x 12,7x 12,7x Days Payable Outstanding (based on tot. op. exp.) 0,0x 30,8x 30,9x 31,0x 31,0x 31,0x 31,0x 31,0x 31,0x 31,0x 31,0x Capital Expenditures 1 470 952 152 152 334 361 389 421 454 491 530 Net Working Capital Accounts 2010 2011 2012 2013 2014 2015 2016 2017 2018 2019 2020 Cash (=as a % of Sales Revenue) 135 206 252 272 294 318 343 371 400 432 Accounts Receivable (=Revenue/365*Days Sales Outstanding) 729 1 112 1 363 1 472 1 590 1 717 1 855 2 003 2 163 2 336 Inventory (=Prodctn Costs/Inventory Turnover) 360 500 396 427 461 498 538 581 627 677 Accounts Payable (=Total Op Expenses/365*Days Payable Outstanding) 317 484 593 640 692 747 807 871 941 1 016 Net Working Capital 800 907 1 334 1 418 1 531 1 653 1 786 1 929 2 083 2 250 2 429 DNWC 107 427 84 113 122 132 143 154 167 180 NWC/Sales 20,15% 19,45% 16,87% 16,86% 16,86% 16,86% 16,86% 16,86% 16,86% 16,86% NPV Analysis Free Cash Flows 2010 2011 2012 2013 2014 2015 2016 2017 2018 2019 2020 2021 EBIT -1 250 583 994 1 277 1 392 1 503 1 623 1 753 1 893 2 045 2 209 Taxes 40% -500 233 398 511 557 601 649 701 757 818 883 Net Income -750 350 596 766 835 902 974 1 052 1 136 1 227 1 325 plus depreciation 0 152 152 152 152 164 178 192 207 224 242 less DNWC 800 107 427 84 113 122 132 143 154 167 180 less capital expenditures 1 470 952 152 152 334 361 389 421 454 491 530 Free Cash Flow -3 020 -557 169 682 541 583 630 680 735 793 857 883 Terminal value 3,00% 16 345 Initial Outlays Net working capital Net property, plant & equipment PERIOD 0 1 2 3 4 5 6 7 8 9 10 Discount factor 8,40% 1,0000 0,9225 0,8510 0,7851 0,7242 0,6681 0,6163 0,5686 0,5245 0,4839 0,4464 Present value -3020 -514 144 536 392 390 388 387 385 384 383 Net Present Value 7 150 7296 NPV without Terminal Value -146 IRR Analysis 2010 2011 2012 2013 2014 2015 2016 2017 2018 2019 2020 Cash Flows -3 020 -557 169 682 541 583 630 680 735 793 857 IRR w/o Terminal Value 7,64% Cash Flows with Terminal Value -3020 -557 169 682 541 583 630 680 735 793 17202 IRR with Terminal Value 23,99% Payback Analysis 2010 2011 2012 2013 2014 2015 2016 2017 2018 2019 2020 Cash flows -3 020 -557 169 682 541 583 630 680 735 793 857 Cumulative cash flow -3 020 -3 577 -3 408 -2 726 -2 185 -1 602 -972 -291 443 1 237 2 094 Payback period 2018, that is the 8th after initial investment X
  • 2.
    New Heritage DollCompany: Capital Budgeting Solution Sheet 2 NPV Analyss for Design Your Own Doll 2010 2011 2012 2013 2014 2015 2016 2017 2018 2019 2020 2021 Revenue 0 6 000 14 360 20 222 21 435 22 721 24 084 25 529 27 061 28 685 Revenue Growth NA 139,33% 40,82% 6,00% 6,00% 6,00% 6,00% 6,00% 6,00% Production Costs Fixed Production Expense (excl depreciation) 0 1 650 1 683 1 717 1 751 1 786 1 822 1 858 1 895 1 933 Additional development costs (IT personnel) Variable Production Costs 0 2 250 7 651 11 427 12 182 12 983 13 833 14 736 15 694 16 712 Depreciation 0 310 310 310 436 462 490 520 551 584 Total Production Costs 0 0 4 210 9 644 13 454 14 369 15 231 16 145 17 113 18 140 19 229 Selling, General & Administrative 1 201 0 1 240 2 922 4 044 4 287 4 544 4 817 5 106 5 412 5 737 Total Operating Expenses 1 201 0 5 450 12 566 17 498 18 656 19 775 20 962 22 219 23 553 24 966 Operating Profit -1 201 0 550 1 794 2 724 2 779 2 946 3 123 3 310 3 508 3 719 Working Capital Assumptions: Minimum Cash Balance as % of Sales NA NA 3,0% 3,0% 3,0% 3,0% 3,0% 3,0% 3,0% 3,0% 3,0% Days Sales Outstanding NA NA 59,2x 59,2x 59,2x 59,2x 59,2x 59,2x 59,2x 59,2x 59,2x Inventory Turnover (prod. cost/ending inv.) NA NA 12,2x 12,3x 12,6x 12,7x 12,7x 12,7x 12,7x 12,7x 12,7x Days Payable Outstanding (based on tot. op. exp.) NA NA 33,7x 33,8x 33,9x 33,9x 33,9x 33,9x 33,9x 33,9x 33,9x Capital Expenditures 4 610 0 310 310 2 192 826 875 928 983 1 043 1 105 Net Working Capital Accounts 2010 2011 2012 2013 2014 2015 2016 2017 2018 2019 2020 Cash (=as a % of Sales Revenue) 0 180 431 607 643 682 723 766 812 861 Accounts Receivable (=Revenue/365*Days Sales Outstanding) 973 2 328 3 278 3 475 3 683 3 904 4 139 4 387 4 650 Inventory (=Prodctn Costs/Inventory Turnover) 346 786 1 065 1 130 1 197 1 269 1 345 1 426 1 512 Accounts Payable (=Total Op Expenses/365*Days Payable Outstanding) 474 1 135 1 598 1 694 1 796 1 904 2 018 2 139 2 267 Net Working Capital 1 000 1 024 2 410 3 352 3 553 3 766 3 992 4 232 4 486 4 755 DNWC 1 000 24 1 386 942 202 213 226 240 254 269 NWC/Sales 17,07% 16,78% 16,57% 16,58% 16,58% 16,58% 16,58% 16,58% 16,58% NPV Analysis Free Cash Flows 2010 2011 2012 2013 2014 2015 2016 2017 2018 2019 2020 2021 EBIT -1 201 0 550 1 794 2 724 2 779 2 946 3 123 3 310 3 508 3 719 Taxes 40% -480 0 220 718 1 089 1 112 1 178 1 249 1 324 1 403 1 488 Net Income -721 0 330 1 077 1 634 1 667 1 767 1 874 1 986 2 105 2 231 plus depreciation 0 0 310 310 310 436 462 490 520 551 584 less DNWC 0 1 000 24 1 386 942 202 213 226 240 254 269 less capital expenditures 4 610 0 310 310 2 192 826 875 928 983 1 043 1 105 Free Cash Flow -5 331 -1 000 306 -309 -1 190 1 076 1 141 1 210 1 283 1 359 1 441 1 484 Terminal value 3,00% 24 737 Initial Outlays Net working capital Net property, plant & equipment PERIOD 0 1 2 3 4 5 6 7 8 9 10 Discount factor 9,00% 1,0000 0,9174 0,8417 0,7722 0,7084 0,6499 0,5963 0,5470 0,5019 0,4604 0,4224 Present value -5 331 -917 258 -239 -843 700 681 662 644 626 609 Net Present Value 7 298 10 449 NPV without Terminal Value -3 152 IRR Analysis 2010 2011 2012 2013 2014 2015 2016 2017 2018 2019 2020 Cash Flows -5 331 -1 000 306 -309 -1 190 1 076 1 141 1 210 1 283 1 359 1 441 1 484 IRR -0,024% Cash Flows with Terminal Value -5331 -1000 306 -309 -1190 1076 1141 1210 1283 1359 26178 IRR with Terminal Value 18,33% Payback Analysis 2010 2011 2012 2013 2014 2015 2016 2017 2018 2019 2020 Cash flows -5 331 -1 000 306 -309 -1 190 1 076 1 141 1 210 1 283 1 359 1 441 1 484 Cumulative cash flow -5 331 -6 331 -6 025 -6 334 -7 523 -6 447 -5 305 -4 096 -2 813 -1 454 -13 1 472 Payback period 2021, that is the 11th year after initial investment X