Download to read offline

![M Hom Choudhury et al Int. Journal of Engineering Research and Applications
ISSN : 2248-9622, Vol. 4, Issue 2( Version 5), February 2014, pp.09-18
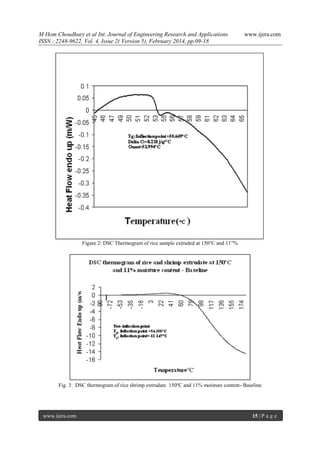
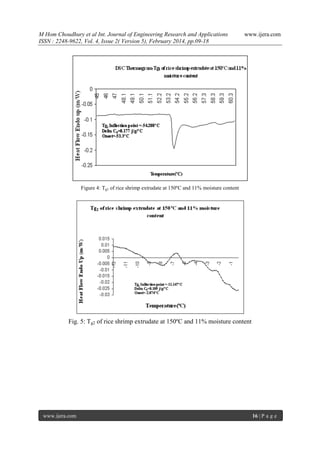
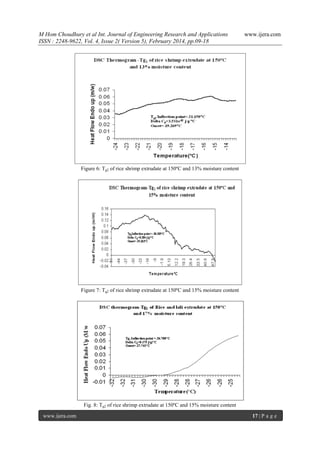
(i.e optimum process moisture condition). This is
clearly explained in the present study, where it was
estimated that Tg+36ºC values at 11%, 13% and 17%
moisture conditions are 25C, 15C & 9C (as Tg
value correspond to -11C, -21C & -27C
respectively at 11%, 13% and 17% moisture
condition) which is lower than product temperature
(50C) and higher than the T g+36ºC value obtained at
15% process moisture condition (0C) (as Tg value at
15% moisture condition was at -36C). Thus, at 15%
moisture condition, the difference of product
temperature (Tp-50C) with Tg+36ºC value (i.e 0C)
is highest and highest increase in cell size was
observed which in turn predict highest expansion
volume at that process moisture condition. Thus,
extrudates obtained at 15% moisture condition are
typical glassy polymers, while the extrudates
obtained at lower and higher moisture condition
become rubbery. Thus, the location of the protein
glass transition temperature (Tg2) controls the
physical state of the product. (Alavi et al, 1999).
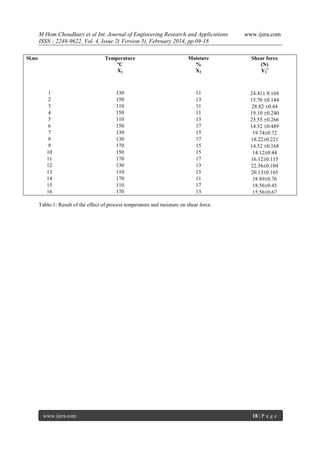
Upon direct examination by texture analyzer, the
product obtained at optimum temperature condition
(at 150 C) and 15% moisture condition were found
brittle and glassy as also evident from lowest shear
force value (14.12 N) (Table 1), while the extrudate
obtained at 11, 13 & 17% moisture (Shear force
value of 19.12, 15.76, 14.52 N respectively as
recorded from Table1) was rubbery. In the present
study, the most expanded, greatest volume and lowest
stress were obtained at 150ºC barrel temperature and
15% moisture. The determined shear force value of
the extrudate varies between 14.12-28.82 N.
Thus Tg2 value of protein dictated the
physical state of the product. The same also validated
with the shear force value obtained by texture
analyser. Protein glass transition temperature has
significant impact on food product design and
process control.
Acknowledgements:
We gratefully acknowledge Central Research
Facility, Indian Institute of Technology, Kharagpur
and Subhas Mukherjee. Memorial research Institute,
Kolkata, Basic Technology Kolkata providing us
technical and instrumental support for carried out the
research work.
References
[1]
[2]
[3]
[4]
[5]
[6]
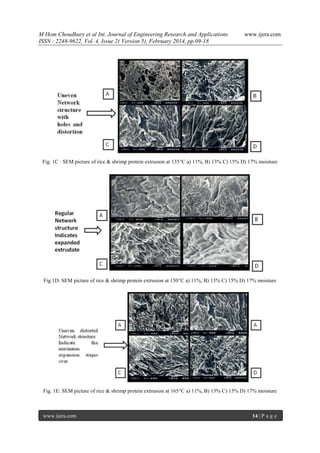
VII. Conclusion
In the carbohydrate –protein complex
extruded system, starch and proteins were immiscible
and retained their own glass transition. The
immiscibility of the system was clearly illustrated on
thermogram with two different glass transition
temperatures. Texture of matrix was dictated by the
location of the protein phase glass transition. Thus
the state diagram provides valuable information,
which can be used as predictive tools for food
product design. Microstructural analysis performed
by Scanning Electron microscopy revealed
symmetrical fashioned network like structure at
150C and 15% moisture.
[7]
[8]
[9]
www.ijera.com
www.ijera.com
Alavi, S.H., B.K. Gogoi, M. Khan, B.J.
Bowman and S.S.H. Rizvi, 1999. Structural
properties of protein-stabilized starch-based
supercritical fluid extrudates. Food Res. Int.,
32:
107-118.
http://www.ingentaconnect.com/content/els/
09639969/1999/00000032/00000002/art000
63
Brake NC. Fennema 1999. Glass transition
values of muscle tissue .J Food Sci 64
(1):10-15
Brent, J.L., S.J. Mulvaney, C. Cohen and
J.A. Bartsch, 1997. Thermomechanical glass
transition of extruded cereal melts. J. Cereal
Sci.,
26:
301-312.
http://www.sciencedirect.com/science/article
/pii/S0733521097901405
D’Cruz, N.M. and L.N. Bell, 2005. Thermal
unfolding of gelatin in solids as affected by
the glass transition. J. Food Sci., 70: E64E68.
Della Valle, G., P. Colonna, A. Patria and B.
Vergnes, 1996. Influence of amylose content
on the viscous behavior of low hydrated
molten starches. J. Rheol., 40: 347-362.
Fan, J., J.R. Mitchell and J.M.V. Blanshard,
1994. A computer simulation of the
dynamics of bubble growth and shrinkage
during extrudate expansion. J. Food Eng.,
23: 337-356.
Lillie, M.A. and J.M. Gosline, 1993. The
Effects of Swelling Solvents on the Glass
Transition in Elastin and other Proteins. In:
The Glassy State in Foods, Blanshard,
J.M.V. and P.J. Lillford (Eds.). Nottingham
University
Press,
Loughborrough,
Leicestershire, pp: 281-302.
Matveev, Y.I., V.Y. Grinberg and V.B.
Tolstoguzov, 2000. The plasticizing effect
of water on proteins, polysaccharides and
their mixtures. Glassy state of biopolymers
food and seeds. Food Hydrocolloids, 14:
425-437.
Moraru C.I., Kokini J.LNucleation and
Expansion During Extrusion and Microwave
12 | P a g e](https://image.slidesharecdn.com/c42050918-140304032130-phpapp01/85/C42050918-4-320.jpg)
![M Hom Choudhury et al Int. Journal of Engineering Research and Applications
ISSN : 2248-9622, Vol. 4, Issue 2( Version 5), February 2014, pp.09-18
[10]
Heating of Cereal Foods, Comprehensive
Reviews In Food Science And Food Safety
2003—Vol. 2, 120-138
Roos, Y. and M. Karel, 1991. Water and
molecular weight effects on glass transitions
in
amorphous
carbohydrates
and
[11]
www.ijera.com
carbohydrate solutions. J. Food Sci., 56:
1676-1681.
Slade, L. and H. Levine, 1993. Water
relationships
in
starch
transitions.
Carbohydr.
Polym.,
21:
105131.http://www.sciencedirect.com/science/a
rticle/pii/014486179390006P
[12] USDA National Nutrient Database for Standard
Reference, Release 15 (August 2002)
Fig 1A: SEM picture of Rice & Shrimp Protein unextruded
Figure 1B: SEM picture of Rice & Shrimp protein Extrusion at 120 C B) 11% C) 13% D) 15% E) 17%
moisture
www.ijera.com
13 | P a g e](https://image.slidesharecdn.com/c42050918-140304032130-phpapp01/85/C42050918-5-320.jpg)

This study focuses on the thermal and microstructural properties of an extruded snack made from a rice and chapra (shrimp) mixture, aiming to analyze its glass transition temperature and microstructural behavior. Using differential scanning calorimetry and scanning electron microscopy, the research identifies that the texture and structure of the extrudate vary with moisture content, with optimal results obtained at 15% moisture. Findings reveal distinct phase behavior and structural arrangements critical for food process design and the stability of the extrudate.


![Invitacion Misa 22 De Febrero B[1].P](https://cdn.slidesharecdn.com/ss_thumbnails/invitacion-misa-22-de-febrero-b1p-1234833691126744-2-thumbnail.jpg?width=640&height=640&fit=bounds)


