SlideShare a Scribd company logo
Essential idea: Changes in community structure affect
and are affected by organisms.
C.2 Communities and Ecosystems
Essential idea: Changes in community
Birds-of-Paradise found in Indonesia which is
part of the Coral Triangle, one of the most
stable ecosystems on the Earth
Understandings, Applications and Skills
Statement Guidance
C.2 U.1 Most species occupy different trophic levels in multiple food chains.
C.2 U.2 A food web shows all the possible food chains in a community.
C.2 U.3 The percentage of ingested energy converted to biomass is dependent on the
respiration rate.
C.2 U.4 The type of stable ecosystem that will emerge in an area is predictable based on
climate.
C.2 U.5 In closed ecosystems energy but not matter is exchanged with the surroundings.
C.2 U.6 Disturbance influences the structure and rate of change within ecosystems.
C.2.A1 Conversion ratio in sustainable food production practices.
C.2.A2 Consideration of one example of how humans interfere with nutrient cycling
C.2.S1 Comparison of pyramids of energy from different ecosystems.
C.2.S2 Analysis of a climograph showing the relationship between temperature, rainfall
and the type of ecosystem.
C.2.S3 Construction of Gersmehl diagrams to show the inter-relationships between
nutrient stores and flows between taiga, desert and tropical rainforest.
C.2.S4 Analysis of data showing primary succession.
C.2.S5 Investigation into the effect of an environmental disturbance on an ecosystem. Examples of aspects to
investigate in the ecosystem
could be species diversity,
nutrient cycling, water
movement, erosion, leaf area
index, among others.
C.2 U.1 Most species occupy different trophic levels in multiple food
chains.
• A food chain is a linear
network of links in a food
web starting from producer
organisms (such
as grass or trees which use
radiation from the sun to make
their food) and ending at apex
predator species (like a
Loin), detrivores (like earthwor
ms or woodlice),
or decomposer species (such
as fungi or bacteria).
• A food chain also shows how
the organisms are related with
each other by the food they
eat. Each level of a food chain
represents a different trophic
level.
A food web is a diagram that shows how food chains are linked together into more
complex feeding relationships within a community. There can be more than one
producer in a food web, and consumers can occupy multiple positions (trophic levels)
C.2 U.2 A food web shows all the possible food chains in a community.
Energy: is an Open system on Earth
C.2 U.3 The percentage of ingested energy converted to biomass is
dependent on the respiration rate.
ECOSYSTEMS AND ENERGY FLOW
• The concept of energy flow
in ecosystems is a
cornerstone of ecology.
• Energy flow in ecosystems is
based on the assumption
that the laws of
thermodynamics apply to all
observable nature and thus
apply to trophic levels.
Two Laws of Matter and Energy
1. Matter and energy can not
be created or destroyed. The
law of conservation of matter
and energy.
2. When energy is changed
from one form to another
some is always degraded into
heat. Energy transfer is never
100% efficient.
Less then 0.5% of the Suns energy is converted into biomass. Only 5%
to 20% of that assimilated energy passes between trophic levels
Gross production: is the energy converted by plants into biomass
Net production: is the energy available to the heterotrophic component of the ecosystem
minus plant respiration during metabolic activities.
C.2 U.3 The percentage of ingested energy converted to biomass is
dependent on the respiration rate.
Net Production (NP) = Gross Production (GP) – Respiration (R)
or
NP = GP – R
Units = kJ m-2year-1
Example: Calculate the values of net production using the equation above
• Gross Production = 809 kJ/m2yr
• Respiration = 729 kJ/m2yr
809-729 = 80
• Net Production = 80 kJ/m2yr
I: food ingested by a consumer
A: a portion is assimilated across the
gut wall, convert nutrient to body
biomass (digestion, absorption)
E: remainder is expelled from the
body as waste products (egested
energy). animal excrete small portion
as nitrogen-containing compounds
(as ammonia, urea, uric acid)
(excreted energy)
R: of the energy assimilated, part is
used for respiration (respired energy)
P: remainder goes to production
(new growth and reproduction)
C.2 U.3 The percentage of ingested energy converted to biomass is
dependent on the respiration rate.
Energy use is a complex process. Not all consumers have the same efficiency
A simple model of energy flow through consumer
C.2 U.3 The percentage of ingested energy converted to biomass is
dependent on the respiration rate.
Energy decreases in each successive trophic level
C.2 S.1 Comparison of pyramids of energy from different ecosystems.
source of data: http://users.rcn.com/jkimball.ma.ultranet/BiologyPages/N/NetProductivity.html
To understand
why analyze the
energy pyramids
of the different
ecosystems.
Net productivity of different ecosystems varies greatly
C.2 S.1 Comparison of pyramids of energy from different ecosystems.
1. High primary
productivity (by
producers) means
more energy is
available to the
ecosystem.
3. Higher the primary productivity and greater the
effeciency of energy transfer mean that more energy is
available at high trophic levels. This can support longer the
food chains, hence and more trophic levels increasing net
productivity. Ecosystems rarely have more than 4 or 5
trophic levels.
2. The higher the
efficiency of energy
transfer between
trophic levels the
higher the net
productivity. Energy
transfer is typically
10%.
Reasons for high net productivity of an ecosystem
(4 trophic levels)
(5 trophic levels)
C.2 S.1 Comparison of pyramids of energy from different ecosystems.
Biogeochemical Cycles: (Are a closed system on Earth)
What is a Biogeochemical Cycle?
– Only so much matter on earth because it is acts as a closed
system.
• Energy enters as sunlight, but no matter usually exits or enters.
• Open system: Energy AND matter are exchanged.
– These cycles act as a way to recycle matter within the
biosphere from one form to another.
C.2 U.5 In closed ecosystems energy but not matter is exchanged with
the surroundings.
Energy Vs. Matter
• Energy is TRANSFERRED
– One-way flow of energy through food-chains and food webs.
• Energy from sun goes to plants, which then goes to consumers.
– Each trophic level loses ~90% of energy as heat.
– Only 10% of energy is used for life processes.
• Matter is TRANSFORMED
– This is why we have biogeochemical cycles.
– Only have a given amount of matter because Earth is a closed
ecosystem.
C.2 U.5 In closed ecosystems energy but not matter is exchanged with
the surroundings.
Nutrient Cycles
• Carbon - key ingredient in living tissue
– “Carbon-based” life forms
• Nitrogen - required for amino acids used in protein
synthesis
– What are our sources of protein?
– What do we use proteins for?
• Phosphorus - required for DNA and RNA
– Why is this important?
C.2 U.5 In closed ecosystems energy but not matter is exchanged with
the surroundings.
C.2 A.1 Conversion ratio in sustainable food production practices.
In commercial (animal) food production, farmers measure the food conversion ratio
(FCR). It is a measure of an animal's efficiency in converting feed mass into the desired output.
For dairy cows, for example, the output is milk, whereas animals raised for meat, for example,
pigs the output is the mass gained by the animal.
mass of the food eaten (g)
(increase in) desired output (g)
(per specified time period)FCR =
http://en.wikipedia.org/wiki/Feed_conversion_ratio
Animal FCR
Beef Cattle 5 - 20
Pigs 3 - 3.2
Sheep 4 - 6
Poultry 1.4 - 2
Salmon 1.2 - 3
The lower the FCR the more efficient
the method of food production.
It is calculated by:
http://en.wikipedia.org/wiki/Feed_conversion_ratio
A good (low) FCR is obtained by
minimizing the losses of energy by
respiration, for example:
• Restricting animal movement
• Slaughtering the animal at a young
age (older animals have higher FCRs
as they grow more slowly)
• Optimizing feed so it is efficiently
digested
How ethical are the practices that lead to a low FCR?
What is more important, efficient food production or the ethical
treatment of animals?
C.2 A.1 Conversion ratio in sustainable food production practices.
Animal FCR
Beef Cattle 5 - 20
Pigs 3 - 3.2
Sheep 4 - 6
Poultry 1.4 - 2
Salmon 1.2 - 3
C.2 A.2 Consideration of one example of how humans interfere with nutrient cycling.
Humans practices can accelerate the the flow of matter into and out of ecosystems. This
by implication (and often design) alters the nutrient cycling in ecosystems.
Phosphate
mined and
converted to
fertilizer.
Nitrate fertilizer
produced from
atmospheric
Nitrogen
(by the Haber
process)
Agriculture
Harvesting
of crops
Water run-off
(leaching) from
agricultural fields
results in build-
up of
phosphates and
nitrates in
waterways and
leads to
eutrophication.
Some Agents of Disturbance
• Fire
• Floods
• Drought
• Large Herbivores
• Storms
• Volcanoes
• Human Activity
C.2 U.6 Disturbance influences the structure and rate of change within
ecosystems.
Disturbances are events such as floods, fire, droughts, overgrazing,
and human activity that damage communities, remove organisms
from them, and alter resource availability
C.2 S.5 Investigation into the effect of an environmental disturbance on
an ecosystem.
C.2 S.5 Investigation into the effect of an environmental disturbance on
an ecosystem.
Your investigation should compare a site undergoing secondary succession with a primary ecosystem. This
can be extended to look at the various stages of secondary succession if local sites allow.
Ways of measuring the affect of
succession include:
• Species diversity
• Stem/Seedling density
• Biomass
• Canopy coverage / light
intensity at the surface
• Depth/Volume of leaf litter
• Soil nutrient levels
https://khorra.files.wordpress.co
m/2013/02/moving-glacier.jpg
Primary Succession
• Begins in a place without any soil:
Sides of volcanoes
Landslides
Flooding
• First, lichens that do not need soil
to survive grow on rocks
• Next, mosses grow to hold newly
made soil
• Known as PIONEER SPECIES
Ecological Succession
• Natural, gradual changes in the types of species that live in an area
• Can be primary or secondary
• The gradual replacement of one plant community by another over time
C.2 U.6 Disturbance influences the structure and rate of change within
ecosystems.
Secondary Succession
• Begins in a place that already has soil and was once the home of
living organisms
• Occurs faster and has different pioneer species than primary
succession
• Example: after forest fires
C.2 U.6 Disturbance influences the structure and rate of change within
ecosystems.
Climax Community
• A stable group of plants and animals that is the end result of the
succession process
• Does not always mean big trees
– Grasses in prairies
– Cacti in deserts
C.2 U.6 Disturbance influences the structure and rate of change within
ecosystems.
C.2 S.4 Analysis of data showing primary succession.
Changes over time in total plant species
richness over time at select sites on Mount
Saint Helens, WA
http://www.nature.com/scitable/knowledge
/library/succession-a-closer-look-13256638
Use the examples to analyze data showing
primary succession
http://wps.pearsoncustom.com/
wps/media/objects/2128/21794
41/28_03.html
Biome is a geographical area that has a particular climate and sustains a specific
community of plants and animals (i.e. a type of ecosystem)
Biosphere is the total of
all areas where living things
are found (i.e. the totality of
biomes)
• The main factors affecting the distribution of biomes is temperature and rainfall
• These factors will vary according to latitude and longitude, elevation and proximity to the sea
• Temperature is influential because it affects the rate of metabolism – the phases in the life cycles
of many organisms are temperature dependent
• In the same way, the availability of fresh water (both in the soil and in rivers and lakes) is critical to
the growth and nutrition of organisms
• Rainfall and warmer temperatures are more common near the equator and less common at the
poles
http://ib.bioninja.com.au/options/option-g-ecology-and-conser/g2-ecosystems-and-biomes.html
C.2 S.2 Analysis of a climograph showing the relationship between
temperature, rainfall and the type of ecosystem.
The six major types of biome/ecosystem are outlined in the table below
C.2 S.2 Analysis of a climograph showing the relationship between
temperature, rainfall and the type of ecosystem.
Biome Temperature Rainfall Vegetation
Desert Hot (>30oC)in the day
Cold (<0oC) at night
Low Precipitation
Less than 30cm per year
Xerophytes
Adapted to water
conservation
Grassland Warm (20oC-30oC) Seasonal Droughts
Medium amount of rain
Grass with widely spaced
trees
Fires prevent trees from
invading
Shrub land Moderate (20oC-30oC) Rainy winters, dry
summers
Dry, woody shrubs
Regrow quickly
Coniferous Forrest
(Taiga)
Cold (0oC-15oC) Low Precipitation
Wet due to lack of
evaporation
Epiphytes, tall trees and
undergrowth
Large diversity in species
Tropical Rainforest Hot (20oC-30oC) High Precipitation
Over 250cm per year
Tundra Freezing (<0oC) Little Precipitation Small close to the ground
(e.g. mosses)
Perennial plants grow in
the summer
http://cispatm.pbworks.com/f/1209212862/biome_graph.jpg
n.b. The biomes in regions within the dashed line are strongly
influenced by other factors (e.g. seasonality of drought, fire,
animal grazing).
A climograph is a diagram which
shows the relative combination of
temperature and precipitation in an
area.
This modified climograph (first
developed by Robert Whittaker)
shows the stable
ecosystems/biomes that arise as a
result of the relative combination
of temperature and precipitation.
It is a graphical representation of
the biome summary table (last
slide).
C.2 S.2 Analysis of a climograph showing the relationship between
temperature, rainfall and the type of ecosystem.
C.2 S.3 Construction of Gersmehl diagrams to show the inter-relationships between
nutrient stores and flows between taiga, desert and tropical rainforest.
http://commons.wikimedia.org/wiki/File:Nutrient_cycle.svg
Gersmehl diagrams were first developed in 1976, by P.F. Gersmehl, to show the
differences in nutrient flow and storage between different ecosystems
Sinks for nutrient storage:
• Biomass (flora and fauna)
• Litter
• Soil
http://commons.wikimedia.org/wiki/File:Nutrient_cycle.svg
Gersmehl diagrams were first developed in 1976, by P.F. Gersmehl, to show the
differences in nutrient flow and storage between different ecosystems
Nutrient inputs into the ecosystem:
• Nutrients dissolved in raindrops
• Nutrients from weathered rock
Nutrient outputs (losses) from the ecosystem:
• Nutrients lost through surface runoff
• Nutrients lost through leaching
C.2 S.3 Construction of Gersmehl diagrams to show the inter-relationships between
nutrient stores and flows between taiga, desert and tropical rainforest.
http://commons.wikimedia.org/wiki/File:Nutrient_cycle.svg
When used to analyze a particular
ecosystem:
• Diameter of sinks are proportional
to the mass of nutrients stored in
each sink
• the thickness of the arrows are
proportional to the rate of
nutrient flow
Gersmehl diagrams were first developed in 1976, by P.F. Gersmehl, to show the
differences in nutrient flow and storage between different ecosystems
Flows between the sinks:
• Littering (including withering, defoliation,
excretion, unconsumed parts left over, dead
bodies of animals, and so on) *
• Decomposition of the litter into inorganic
nutrients, which are then stored in the soil
• Nutrient uptake by plants
Human interactions are not considered – do not confuse
littering with dropping trash
*
C.2 S.3 Construction of Gersmehl diagrams to show the inter-relationships between
nutrient stores and flows between taiga, desert and tropical rainforest.
• Litter (pine needles) is
the main store
• Slow rate of nutrient
transfer between
stores
• Soil is the main store
• Slow rate of nutrient
transfer between
stores (except for the
transfer from biomass
to litter)
• Biomass is the main
store (soil is nutrient
poor)
• Fast rate of nutrient
transfer between
stores
tagia
(temperate forest)
desert tropical rainforest
Image source: Allott, A. (2014). Biology: Course companion. S.l.: Oxford University Press.
C.2 S.3 Construction of Gersmehl diagrams to show the inter-relationships between
nutrient stores and flows between taiga, desert and tropical rainforest.
C.2 U.4 The type of stable ecosystem that will emerge in an area is
predictable based on climate.
• The Coral Triangle is a geographical term used to describe the region that possesses the
world’s highest levels of marine biodiversity.
• The answer to why areas like the Coral Triangle harbor the world’s highest levels of
marine biodiversity begins not with the individual organisms, but with geologic
processes that began hundreds of millions of years ago. Plate tectonics, continental drift,
and the advance and retreat of glaciers. Glacial periods have covered the Earth with ice
at least 21 different times over the past several million years creating one of the most
stable climate on Earth.
C.2 U.4 The type of stable ecosystem that will emerge in an area is
predictable based on climate.
More than 3,000 species of fish
live in the Coral Triangle,
including the largest fish -
the whale shark, and
the coelacanth. It also
provides habitat to six out of the
world's seven marine turtle
species.
This great biodiversity is thought
to be due to an extended period
of little to no climate change
C.2 U.4 The type of stable ecosystem that will emerge in an area is
predictable based on climate.
Borneo lowland rain forest is
a tropical and subtropical of
the large island
of Borneo located in the
Coral Triangle. It supports
approximately 10,000 plant
species, 380 bird species and
several mammal species,
which include the Orangutan
Bibliography / Acknowledgments

More Related Content

What's hot

4.3 carbon cycle
4.3 carbon cycle4.3 carbon cycle
4.3 carbon cycle
Bob Smullen
 
4.2 energy flow
4.2 energy flow4.2 energy flow
4.2 energy flow
dabagus
 
4.1 species, communities and ecosystems
4.1 species, communities and ecosystems 4.1 species, communities and ecosystems
4.1 species, communities and ecosystems
Bob Smullen
 
C.1-C.6 Ecology and Conservation Notes
C.1-C.6 Ecology and Conservation NotesC.1-C.6 Ecology and Conservation Notes
C.1-C.6 Ecology and Conservation Notes
Youki Kotani
 
IB Biology 7.2-7.3 Slides: AHL Transcription & Translation
IB Biology 7.2-7.3 Slides: AHL Transcription & TranslationIB Biology 7.2-7.3 Slides: AHL Transcription & Translation
IB Biology 7.2-7.3 Slides: AHL Transcription & Translation
Jacob Cedarbaum
 
IB Biology 2.8 Slides: Respiration
IB Biology 2.8 Slides: RespirationIB Biology 2.8 Slides: Respiration
IB Biology 2.8 Slides: Respiration
Jacob Cedarbaum
 
4.2 energy flow
4.2 energy flow4.2 energy flow
4.2 energy flow
Bob Smullen
 
7.2 transcription & gene expression
7.2 transcription & gene expression7.2 transcription & gene expression
7.2 transcription & gene expression
Bob Smullen
 
Topic 3.1
Topic 3.1 Topic 3.1
Topic 3.1
Michael Smith
 
Organisms and their environments
Organisms and their environmentsOrganisms and their environments
Organisms and their environmentshilary farlow
 
IB Biology 4.3-4.4 Slides: Carbon Cycle & Climate Change
IB Biology 4.3-4.4 Slides: Carbon Cycle & Climate ChangeIB Biology 4.3-4.4 Slides: Carbon Cycle & Climate Change
IB Biology 4.3-4.4 Slides: Carbon Cycle & Climate Change
Jacob Cedarbaum
 
IB Biology 2.6 & 7.1 Slides: DNA Structure
IB Biology 2.6 & 7.1 Slides: DNA StructureIB Biology 2.6 & 7.1 Slides: DNA Structure
IB Biology 2.6 & 7.1 Slides: DNA Structure
Jacob Cedarbaum
 
IB Biology 1.5 Slides: Origins of Cells
IB Biology 1.5 Slides: Origins of CellsIB Biology 1.5 Slides: Origins of Cells
IB Biology 1.5 Slides: Origins of Cells
Jacob Cedarbaum
 
IB Biology 2.4 & 7.3 Slides: Proteins
IB Biology 2.4 & 7.3 Slides: ProteinsIB Biology 2.4 & 7.3 Slides: Proteins
IB Biology 2.4 & 7.3 Slides: Proteins
Jacob Cedarbaum
 
2.2. Communities and ecosystems
2.2. Communities and ecosystems 2.2. Communities and ecosystems
2.2. Communities and ecosystems
Miltiadis Kitsos
 
8.3 photosynthesis
8.3 photosynthesis8.3 photosynthesis
8.3 photosynthesis
lucascw
 
C.6 nitrogen cycle .pptx
C.6 nitrogen cycle .pptxC.6 nitrogen cycle .pptx
C.6 nitrogen cycle .pptx
Bob Smullen
 
IB Biology 5.3 Slides: Classification & Taxonomy
IB Biology 5.3 Slides: Classification & TaxonomyIB Biology 5.3 Slides: Classification & Taxonomy
IB Biology 5.3 Slides: Classification & Taxonomy
Jacob Cedarbaum
 
IB Biology 3.3 meiosis
IB Biology 3.3 meiosisIB Biology 3.3 meiosis
IB Biology 3.3 meiosis
Bob Smullen
 

What's hot (20)

4.3 carbon cycle
4.3 carbon cycle4.3 carbon cycle
4.3 carbon cycle
 
4.2 energy flow
4.2 energy flow4.2 energy flow
4.2 energy flow
 
4.1 species, communities and ecosystems
4.1 species, communities and ecosystems 4.1 species, communities and ecosystems
4.1 species, communities and ecosystems
 
C.1-C.6 Ecology and Conservation Notes
C.1-C.6 Ecology and Conservation NotesC.1-C.6 Ecology and Conservation Notes
C.1-C.6 Ecology and Conservation Notes
 
IB Biology 7.2-7.3 Slides: AHL Transcription & Translation
IB Biology 7.2-7.3 Slides: AHL Transcription & TranslationIB Biology 7.2-7.3 Slides: AHL Transcription & Translation
IB Biology 7.2-7.3 Slides: AHL Transcription & Translation
 
IB Biology 2.8 Slides: Respiration
IB Biology 2.8 Slides: RespirationIB Biology 2.8 Slides: Respiration
IB Biology 2.8 Slides: Respiration
 
4.2 energy flow
4.2 energy flow4.2 energy flow
4.2 energy flow
 
7.2 transcription & gene expression
7.2 transcription & gene expression7.2 transcription & gene expression
7.2 transcription & gene expression
 
Topic 3.1
Topic 3.1 Topic 3.1
Topic 3.1
 
Organisms and their environments
Organisms and their environmentsOrganisms and their environments
Organisms and their environments
 
IB Biology 4.3-4.4 Slides: Carbon Cycle & Climate Change
IB Biology 4.3-4.4 Slides: Carbon Cycle & Climate ChangeIB Biology 4.3-4.4 Slides: Carbon Cycle & Climate Change
IB Biology 4.3-4.4 Slides: Carbon Cycle & Climate Change
 
IB Biology 2.6 & 7.1 Slides: DNA Structure
IB Biology 2.6 & 7.1 Slides: DNA StructureIB Biology 2.6 & 7.1 Slides: DNA Structure
IB Biology 2.6 & 7.1 Slides: DNA Structure
 
Topic 1 systems and models
Topic 1 systems and modelsTopic 1 systems and models
Topic 1 systems and models
 
IB Biology 1.5 Slides: Origins of Cells
IB Biology 1.5 Slides: Origins of CellsIB Biology 1.5 Slides: Origins of Cells
IB Biology 1.5 Slides: Origins of Cells
 
IB Biology 2.4 & 7.3 Slides: Proteins
IB Biology 2.4 & 7.3 Slides: ProteinsIB Biology 2.4 & 7.3 Slides: Proteins
IB Biology 2.4 & 7.3 Slides: Proteins
 
2.2. Communities and ecosystems
2.2. Communities and ecosystems 2.2. Communities and ecosystems
2.2. Communities and ecosystems
 
8.3 photosynthesis
8.3 photosynthesis8.3 photosynthesis
8.3 photosynthesis
 
C.6 nitrogen cycle .pptx
C.6 nitrogen cycle .pptxC.6 nitrogen cycle .pptx
C.6 nitrogen cycle .pptx
 
IB Biology 5.3 Slides: Classification & Taxonomy
IB Biology 5.3 Slides: Classification & TaxonomyIB Biology 5.3 Slides: Classification & Taxonomy
IB Biology 5.3 Slides: Classification & Taxonomy
 
IB Biology 3.3 meiosis
IB Biology 3.3 meiosisIB Biology 3.3 meiosis
IB Biology 3.3 meiosis
 

Viewers also liked

Ecology Optional Topic Student Notes
Ecology Optional Topic Student NotesEcology Optional Topic Student Notes
Ecology Optional Topic Student Notes
Bob Smullen
 
2.6 structure of DNA and RNA
2.6 structure of DNA and RNA2.6 structure of DNA and RNA
2.6 structure of DNA and RNA
Bob Smullen
 
DP Biology Option C.1 Species and Communities
DP Biology Option C.1 Species and CommunitiesDP Biology Option C.1 Species and Communities
DP Biology Option C.1 Species and Communities
R. Price
 
IB Biology Genetics 2015
IB Biology Genetics 2015IB Biology Genetics 2015
IB Biology Genetics 2015
Bob Smullen
 
4 and Option C Ecology optional topic
4 and Option C Ecology optional topic4 and Option C Ecology optional topic
4 and Option C Ecology optional topic
Bob Smullen
 
2.2 water
2.2 water 2.2 water
2.2 water
Bob Smullen
 
2.1 molecules to metabolism me
2.1 molecules to metabolism me2.1 molecules to metabolism me
2.1 molecules to metabolism me
Bob Smullen
 
2.5 enzymes
2.5 enzymes 2.5 enzymes
2.5 enzymes
Bob Smullen
 
IB Biology Evolution 2015
IB Biology Evolution 2015IB Biology Evolution 2015
IB Biology Evolution 2015
Bob Smullen
 
2.4 proteins
2.4 proteins2.4 proteins
2.4 proteins
Bob Smullen
 
2.8 cellular respiration
2.8 cellular respiration 2.8 cellular respiration
2.8 cellular respiration
Bob Smullen
 
2.3 carbohydrates and lipids
2.3 carbohydrates and lipids2.3 carbohydrates and lipids
2.3 carbohydrates and lipids
Bob Smullen
 
2.7 dna replication, transcription, and translation
2.7 dna replication, transcription, and translation2.7 dna replication, transcription, and translation
2.7 dna replication, transcription, and translation
Bob Smullen
 
Forensic Science: Topic 2 crime scene
Forensic Science: Topic 2 crime sceneForensic Science: Topic 2 crime scene
Forensic Science: Topic 2 crime sceneBob Smullen
 
9.4 plant reproduction
9.4 plant reproduction9.4 plant reproduction
9.4 plant reproduction
Bob Smullen
 
Protein synthesis Running Dictation
Protein synthesis Running DictationProtein synthesis Running Dictation
Protein synthesis Running Dictation
Stephen Taylor
 
Ecosystems and Biomes
Ecosystems and BiomesEcosystems and Biomes
Ecosystems and Biomes
Stephen Taylor
 
10.2 inheritance
10.2 inheritance10.2 inheritance
10.2 inheritance
Bob Smullen
 
10.1 meiosis
10.1 meiosis10.1 meiosis
10.1 meiosis
Bob Smullen
 

Viewers also liked (20)

Ecology Optional Topic Student Notes
Ecology Optional Topic Student NotesEcology Optional Topic Student Notes
Ecology Optional Topic Student Notes
 
2.6 structure of DNA and RNA
2.6 structure of DNA and RNA2.6 structure of DNA and RNA
2.6 structure of DNA and RNA
 
DP Biology Option C.1 Species and Communities
DP Biology Option C.1 Species and CommunitiesDP Biology Option C.1 Species and Communities
DP Biology Option C.1 Species and Communities
 
IB Biology Genetics 2015
IB Biology Genetics 2015IB Biology Genetics 2015
IB Biology Genetics 2015
 
4 and Option C Ecology optional topic
4 and Option C Ecology optional topic4 and Option C Ecology optional topic
4 and Option C Ecology optional topic
 
Impression evidence
Impression evidenceImpression evidence
Impression evidence
 
2.2 water
2.2 water 2.2 water
2.2 water
 
2.1 molecules to metabolism me
2.1 molecules to metabolism me2.1 molecules to metabolism me
2.1 molecules to metabolism me
 
2.5 enzymes
2.5 enzymes 2.5 enzymes
2.5 enzymes
 
IB Biology Evolution 2015
IB Biology Evolution 2015IB Biology Evolution 2015
IB Biology Evolution 2015
 
2.4 proteins
2.4 proteins2.4 proteins
2.4 proteins
 
2.8 cellular respiration
2.8 cellular respiration 2.8 cellular respiration
2.8 cellular respiration
 
2.3 carbohydrates and lipids
2.3 carbohydrates and lipids2.3 carbohydrates and lipids
2.3 carbohydrates and lipids
 
2.7 dna replication, transcription, and translation
2.7 dna replication, transcription, and translation2.7 dna replication, transcription, and translation
2.7 dna replication, transcription, and translation
 
Forensic Science: Topic 2 crime scene
Forensic Science: Topic 2 crime sceneForensic Science: Topic 2 crime scene
Forensic Science: Topic 2 crime scene
 
9.4 plant reproduction
9.4 plant reproduction9.4 plant reproduction
9.4 plant reproduction
 
Protein synthesis Running Dictation
Protein synthesis Running DictationProtein synthesis Running Dictation
Protein synthesis Running Dictation
 
Ecosystems and Biomes
Ecosystems and BiomesEcosystems and Biomes
Ecosystems and Biomes
 
10.2 inheritance
10.2 inheritance10.2 inheritance
10.2 inheritance
 
10.1 meiosis
10.1 meiosis10.1 meiosis
10.1 meiosis
 

Similar to C.2 communities and ecosystem

Concepts of trophic structure, food chain and food web. energy flow in ecosys...
Concepts of trophic structure, food chain and food web. energy flow in ecosys...Concepts of trophic structure, food chain and food web. energy flow in ecosys...
Concepts of trophic structure, food chain and food web. energy flow in ecosys...
SenjutiSaha1
 
ENERGY FLOW MODELS.pdf
ENERGY FLOW MODELS.pdfENERGY FLOW MODELS.pdf
ENERGY FLOW MODELS.pdf
RavindraChoudhary57
 
ENERGY FLOW MODELS.pdf
ENERGY FLOW MODELS.pdfENERGY FLOW MODELS.pdf
ENERGY FLOW MODELS.pdf
RavindraChoudhary57
 
ecosystem -2 energyflow.pdf
ecosystem -2 energyflow.pdfecosystem -2 energyflow.pdf
ecosystem -2 energyflow.pdf
Mansi Rastogi
 
efficency of trophic levels
efficency of trophic levelsefficency of trophic levels
efficency of trophic levelsKhaleen
 
Ecosystem: for students studying environmental Biology
Ecosystem: for students studying environmental BiologyEcosystem: for students studying environmental Biology
Ecosystem: for students studying environmental Biology
Gauri Haval
 
Structure Of The Ecosystem
Structure Of The EcosystemStructure Of The Ecosystem
Structure Of The Ecosystem
Logos Academy
 
Energy Flow in Environment : Ecological Energetics
Energy Flow in Environment : Ecological EnergeticsEnergy Flow in Environment : Ecological Energetics
Energy Flow in Environment : Ecological Energetics
Kamlesh Patel
 
Topic 4.2. Energy flow
Topic 4.2. Energy flowTopic 4.2. Energy flow
Topic 4.2. Energy flow
Miltiadis Kitsos
 
Functional aspects of ecosystem
Functional aspects of ecosystemFunctional aspects of ecosystem
Functional aspects of ecosystem
EmaSushan
 
Topic 8: Ecology Option C Part 1
Topic 8: Ecology Option C Part 1Topic 8: Ecology Option C Part 1
Topic 8: Ecology Option C Part 1
Bob Smullen
 
Energy flow by using energy models in ecosystem
Energy flow by using energy models  in ecosystemEnergy flow by using energy models  in ecosystem
Energy flow by using energy models in ecosystem
Anchal Garg
 
Energy Budget.pdf
Energy Budget.pdfEnergy Budget.pdf
Energy Budget.pdf
RavindraChoudhary57
 
Seminar presentation ecological energy flow in eco system
Seminar presentation ecological energy flow in eco system Seminar presentation ecological energy flow in eco system
Seminar presentation ecological energy flow in eco system
ABHISHEKKUMARPANDEY66
 
Ecosystem
EcosystemEcosystem
Ecosystem
yash srivastava
 
2 dynamicsofecosystem-121129013419-phpapp01
2 dynamicsofecosystem-121129013419-phpapp012 dynamicsofecosystem-121129013419-phpapp01
2 dynamicsofecosystem-121129013419-phpapp01
Amit Jha
 
Energy in Ecosystem pattern of flow of energy through the ecosystem and food ...
Energy in Ecosystem pattern of flow of energy through the ecosystem and food ...Energy in Ecosystem pattern of flow of energy through the ecosystem and food ...
Energy in Ecosystem pattern of flow of energy through the ecosystem and food ...
Mozakkir Azad
 
PPT2.3 Food chains food web.ppt
PPT2.3 Food chains food web.pptPPT2.3 Food chains food web.ppt
PPT2.3 Food chains food web.ppt
Sathwik62
 

Similar to C.2 communities and ecosystem (20)

Concepts of trophic structure, food chain and food web. energy flow in ecosys...
Concepts of trophic structure, food chain and food web. energy flow in ecosys...Concepts of trophic structure, food chain and food web. energy flow in ecosys...
Concepts of trophic structure, food chain and food web. energy flow in ecosys...
 
ENERGY FLOW MODELS.pdf
ENERGY FLOW MODELS.pdfENERGY FLOW MODELS.pdf
ENERGY FLOW MODELS.pdf
 
ENERGY FLOW MODELS.pdf
ENERGY FLOW MODELS.pdfENERGY FLOW MODELS.pdf
ENERGY FLOW MODELS.pdf
 
ecosystem -2 energyflow.pdf
ecosystem -2 energyflow.pdfecosystem -2 energyflow.pdf
ecosystem -2 energyflow.pdf
 
Ecosystem
 Ecosystem Ecosystem
Ecosystem
 
Communities
CommunitiesCommunities
Communities
 
efficency of trophic levels
efficency of trophic levelsefficency of trophic levels
efficency of trophic levels
 
Ecosystem: for students studying environmental Biology
Ecosystem: for students studying environmental BiologyEcosystem: for students studying environmental Biology
Ecosystem: for students studying environmental Biology
 
Structure Of The Ecosystem
Structure Of The EcosystemStructure Of The Ecosystem
Structure Of The Ecosystem
 
Energy Flow in Environment : Ecological Energetics
Energy Flow in Environment : Ecological EnergeticsEnergy Flow in Environment : Ecological Energetics
Energy Flow in Environment : Ecological Energetics
 
Topic 4.2. Energy flow
Topic 4.2. Energy flowTopic 4.2. Energy flow
Topic 4.2. Energy flow
 
Functional aspects of ecosystem
Functional aspects of ecosystemFunctional aspects of ecosystem
Functional aspects of ecosystem
 
Topic 8: Ecology Option C Part 1
Topic 8: Ecology Option C Part 1Topic 8: Ecology Option C Part 1
Topic 8: Ecology Option C Part 1
 
Energy flow by using energy models in ecosystem
Energy flow by using energy models  in ecosystemEnergy flow by using energy models  in ecosystem
Energy flow by using energy models in ecosystem
 
Energy Budget.pdf
Energy Budget.pdfEnergy Budget.pdf
Energy Budget.pdf
 
Seminar presentation ecological energy flow in eco system
Seminar presentation ecological energy flow in eco system Seminar presentation ecological energy flow in eco system
Seminar presentation ecological energy flow in eco system
 
Ecosystem
EcosystemEcosystem
Ecosystem
 
2 dynamicsofecosystem-121129013419-phpapp01
2 dynamicsofecosystem-121129013419-phpapp012 dynamicsofecosystem-121129013419-phpapp01
2 dynamicsofecosystem-121129013419-phpapp01
 
Energy in Ecosystem pattern of flow of energy through the ecosystem and food ...
Energy in Ecosystem pattern of flow of energy through the ecosystem and food ...Energy in Ecosystem pattern of flow of energy through the ecosystem and food ...
Energy in Ecosystem pattern of flow of energy through the ecosystem and food ...
 
PPT2.3 Food chains food web.ppt
PPT2.3 Food chains food web.pptPPT2.3 Food chains food web.ppt
PPT2.3 Food chains food web.ppt
 

More from Bob Smullen

1. complete stats notes
1. complete stats notes1. complete stats notes
1. complete stats notes
Bob Smullen
 
Topic One: Cell
Topic One: CellTopic One: Cell
Topic One: Cell
Bob Smullen
 
Endocrine System
Endocrine SystemEndocrine System
Endocrine System
Bob Smullen
 
IB Biology Human Reproduction
IB Biology Human Reproduction IB Biology Human Reproduction
IB Biology Human Reproduction
Bob Smullen
 
Topic 8: Ecology Option C Part 2
Topic 8: Ecology Option C Part 2Topic 8: Ecology Option C Part 2
Topic 8: Ecology Option C Part 2
Bob Smullen
 
Topic 7: Plant Science
Topic 7: Plant ScienceTopic 7: Plant Science
Topic 7: Plant Science
Bob Smullen
 
Topic 6: Evolution
Topic 6: Evolution Topic 6: Evolution
Topic 6: Evolution
Bob Smullen
 
Topic Five: Genetics
Topic Five: GeneticsTopic Five: Genetics
Topic Five: Genetics
Bob Smullen
 
Topic 3: Nucleic Acid
Topic 3: Nucleic AcidTopic 3: Nucleic Acid
Topic 3: Nucleic Acid
Bob Smullen
 
Topic 2: Biochemistry
Topic 2: Biochemistry Topic 2: Biochemistry
Topic 2: Biochemistry
Bob Smullen
 
11.3 kidney
11.3 kidney11.3 kidney
11.3 kidney
Bob Smullen
 
11.2 Movement
11.2 Movement 11.2 Movement
11.2 Movement
Bob Smullen
 
6.5 neurons and synapses
6.5 neurons and synapses 6.5 neurons and synapses
6.5 neurons and synapses
Bob Smullen
 
Immune system hl
Immune system hlImmune system hl
Immune system hl
Bob Smullen
 
Ia headings
Ia headingsIa headings
Ia headings
Bob Smullen
 
6.2 and 6.4 transport and respiration
6.2 and 6.4  transport and respiration6.2 and 6.4  transport and respiration
6.2 and 6.4 transport and respiration
Bob Smullen
 
6.1 digestion HL Year One
6.1 digestion HL Year One6.1 digestion HL Year One
6.1 digestion HL Year One
Bob Smullen
 
9.3 plant growth
9.3 plant growth9.3 plant growth
9.3 plant growth
Bob Smullen
 

More from Bob Smullen (18)

1. complete stats notes
1. complete stats notes1. complete stats notes
1. complete stats notes
 
Topic One: Cell
Topic One: CellTopic One: Cell
Topic One: Cell
 
Endocrine System
Endocrine SystemEndocrine System
Endocrine System
 
IB Biology Human Reproduction
IB Biology Human Reproduction IB Biology Human Reproduction
IB Biology Human Reproduction
 
Topic 8: Ecology Option C Part 2
Topic 8: Ecology Option C Part 2Topic 8: Ecology Option C Part 2
Topic 8: Ecology Option C Part 2
 
Topic 7: Plant Science
Topic 7: Plant ScienceTopic 7: Plant Science
Topic 7: Plant Science
 
Topic 6: Evolution
Topic 6: Evolution Topic 6: Evolution
Topic 6: Evolution
 
Topic Five: Genetics
Topic Five: GeneticsTopic Five: Genetics
Topic Five: Genetics
 
Topic 3: Nucleic Acid
Topic 3: Nucleic AcidTopic 3: Nucleic Acid
Topic 3: Nucleic Acid
 
Topic 2: Biochemistry
Topic 2: Biochemistry Topic 2: Biochemistry
Topic 2: Biochemistry
 
11.3 kidney
11.3 kidney11.3 kidney
11.3 kidney
 
11.2 Movement
11.2 Movement 11.2 Movement
11.2 Movement
 
6.5 neurons and synapses
6.5 neurons and synapses 6.5 neurons and synapses
6.5 neurons and synapses
 
Immune system hl
Immune system hlImmune system hl
Immune system hl
 
Ia headings
Ia headingsIa headings
Ia headings
 
6.2 and 6.4 transport and respiration
6.2 and 6.4  transport and respiration6.2 and 6.4  transport and respiration
6.2 and 6.4 transport and respiration
 
6.1 digestion HL Year One
6.1 digestion HL Year One6.1 digestion HL Year One
6.1 digestion HL Year One
 
9.3 plant growth
9.3 plant growth9.3 plant growth
9.3 plant growth
 

Recently uploaded

(May 29th, 2024) Advancements in Intravital Microscopy- Insights for Preclini...
(May 29th, 2024) Advancements in Intravital Microscopy- Insights for Preclini...(May 29th, 2024) Advancements in Intravital Microscopy- Insights for Preclini...
(May 29th, 2024) Advancements in Intravital Microscopy- Insights for Preclini...
Scintica Instrumentation
 
role of pramana in research.pptx in science
role of pramana in research.pptx in sciencerole of pramana in research.pptx in science
role of pramana in research.pptx in science
sonaliswain16
 
Hemoglobin metabolism_pathophysiology.pptx
Hemoglobin metabolism_pathophysiology.pptxHemoglobin metabolism_pathophysiology.pptx
Hemoglobin metabolism_pathophysiology.pptx
muralinath2
 
Nutraceutical market, scope and growth: Herbal drug technology
Nutraceutical market, scope and growth: Herbal drug technologyNutraceutical market, scope and growth: Herbal drug technology
Nutraceutical market, scope and growth: Herbal drug technology
Lokesh Patil
 
SCHIZOPHRENIA Disorder/ Brain Disorder.pdf
SCHIZOPHRENIA Disorder/ Brain Disorder.pdfSCHIZOPHRENIA Disorder/ Brain Disorder.pdf
SCHIZOPHRENIA Disorder/ Brain Disorder.pdf
SELF-EXPLANATORY
 
erythropoiesis-I_mechanism& clinical significance.pptx
erythropoiesis-I_mechanism& clinical significance.pptxerythropoiesis-I_mechanism& clinical significance.pptx
erythropoiesis-I_mechanism& clinical significance.pptx
muralinath2
 
Circulatory system_ Laplace law. Ohms law.reynaults law,baro-chemo-receptors-...
Circulatory system_ Laplace law. Ohms law.reynaults law,baro-chemo-receptors-...Circulatory system_ Laplace law. Ohms law.reynaults law,baro-chemo-receptors-...
Circulatory system_ Laplace law. Ohms law.reynaults law,baro-chemo-receptors-...
muralinath2
 
ESR_factors_affect-clinic significance-Pathysiology.pptx
ESR_factors_affect-clinic significance-Pathysiology.pptxESR_factors_affect-clinic significance-Pathysiology.pptx
ESR_factors_affect-clinic significance-Pathysiology.pptx
muralinath2
 
extra-chromosomal-inheritance[1].pptx.pdfpdf
extra-chromosomal-inheritance[1].pptx.pdfpdfextra-chromosomal-inheritance[1].pptx.pdfpdf
extra-chromosomal-inheritance[1].pptx.pdfpdf
DiyaBiswas10
 
THE IMPORTANCE OF MARTIAN ATMOSPHERE SAMPLE RETURN.
THE IMPORTANCE OF MARTIAN ATMOSPHERE SAMPLE RETURN.THE IMPORTANCE OF MARTIAN ATMOSPHERE SAMPLE RETURN.
THE IMPORTANCE OF MARTIAN ATMOSPHERE SAMPLE RETURN.
Sérgio Sacani
 
platelets- lifespan -Clot retraction-disorders.pptx
platelets- lifespan -Clot retraction-disorders.pptxplatelets- lifespan -Clot retraction-disorders.pptx
platelets- lifespan -Clot retraction-disorders.pptx
muralinath2
 
EY - Supply Chain Services 2018_template.pptx
EY - Supply Chain Services 2018_template.pptxEY - Supply Chain Services 2018_template.pptx
EY - Supply Chain Services 2018_template.pptx
AlguinaldoKong
 
Body fluids_tonicity_dehydration_hypovolemia_hypervolemia.pptx
Body fluids_tonicity_dehydration_hypovolemia_hypervolemia.pptxBody fluids_tonicity_dehydration_hypovolemia_hypervolemia.pptx
Body fluids_tonicity_dehydration_hypovolemia_hypervolemia.pptx
muralinath2
 
in vitro propagation of plants lecture note.pptx
in vitro propagation of plants lecture note.pptxin vitro propagation of plants lecture note.pptx
in vitro propagation of plants lecture note.pptx
yusufzako14
 
Unveiling the Energy Potential of Marshmallow Deposits.pdf
Unveiling the Energy Potential of Marshmallow Deposits.pdfUnveiling the Energy Potential of Marshmallow Deposits.pdf
Unveiling the Energy Potential of Marshmallow Deposits.pdf
Erdal Coalmaker
 
Earliest Galaxies in the JADES Origins Field: Luminosity Function and Cosmic ...
Earliest Galaxies in the JADES Origins Field: Luminosity Function and Cosmic ...Earliest Galaxies in the JADES Origins Field: Luminosity Function and Cosmic ...
Earliest Galaxies in the JADES Origins Field: Luminosity Function and Cosmic ...
Sérgio Sacani
 
Comparing Evolved Extractive Text Summary Scores of Bidirectional Encoder Rep...
Comparing Evolved Extractive Text Summary Scores of Bidirectional Encoder Rep...Comparing Evolved Extractive Text Summary Scores of Bidirectional Encoder Rep...
Comparing Evolved Extractive Text Summary Scores of Bidirectional Encoder Rep...
University of Maribor
 
Comparative structure of adrenal gland in vertebrates
Comparative structure of adrenal gland in vertebratesComparative structure of adrenal gland in vertebrates
Comparative structure of adrenal gland in vertebrates
sachin783648
 
Orion Air Quality Monitoring Systems - CWS
Orion Air Quality Monitoring Systems - CWSOrion Air Quality Monitoring Systems - CWS
Orion Air Quality Monitoring Systems - CWS
Columbia Weather Systems
 
Observation of Io’s Resurfacing via Plume Deposition Using Ground-based Adapt...
Observation of Io’s Resurfacing via Plume Deposition Using Ground-based Adapt...Observation of Io’s Resurfacing via Plume Deposition Using Ground-based Adapt...
Observation of Io’s Resurfacing via Plume Deposition Using Ground-based Adapt...
Sérgio Sacani
 

Recently uploaded (20)

(May 29th, 2024) Advancements in Intravital Microscopy- Insights for Preclini...
(May 29th, 2024) Advancements in Intravital Microscopy- Insights for Preclini...(May 29th, 2024) Advancements in Intravital Microscopy- Insights for Preclini...
(May 29th, 2024) Advancements in Intravital Microscopy- Insights for Preclini...
 
role of pramana in research.pptx in science
role of pramana in research.pptx in sciencerole of pramana in research.pptx in science
role of pramana in research.pptx in science
 
Hemoglobin metabolism_pathophysiology.pptx
Hemoglobin metabolism_pathophysiology.pptxHemoglobin metabolism_pathophysiology.pptx
Hemoglobin metabolism_pathophysiology.pptx
 
Nutraceutical market, scope and growth: Herbal drug technology
Nutraceutical market, scope and growth: Herbal drug technologyNutraceutical market, scope and growth: Herbal drug technology
Nutraceutical market, scope and growth: Herbal drug technology
 
SCHIZOPHRENIA Disorder/ Brain Disorder.pdf
SCHIZOPHRENIA Disorder/ Brain Disorder.pdfSCHIZOPHRENIA Disorder/ Brain Disorder.pdf
SCHIZOPHRENIA Disorder/ Brain Disorder.pdf
 
erythropoiesis-I_mechanism& clinical significance.pptx
erythropoiesis-I_mechanism& clinical significance.pptxerythropoiesis-I_mechanism& clinical significance.pptx
erythropoiesis-I_mechanism& clinical significance.pptx
 
Circulatory system_ Laplace law. Ohms law.reynaults law,baro-chemo-receptors-...
Circulatory system_ Laplace law. Ohms law.reynaults law,baro-chemo-receptors-...Circulatory system_ Laplace law. Ohms law.reynaults law,baro-chemo-receptors-...
Circulatory system_ Laplace law. Ohms law.reynaults law,baro-chemo-receptors-...
 
ESR_factors_affect-clinic significance-Pathysiology.pptx
ESR_factors_affect-clinic significance-Pathysiology.pptxESR_factors_affect-clinic significance-Pathysiology.pptx
ESR_factors_affect-clinic significance-Pathysiology.pptx
 
extra-chromosomal-inheritance[1].pptx.pdfpdf
extra-chromosomal-inheritance[1].pptx.pdfpdfextra-chromosomal-inheritance[1].pptx.pdfpdf
extra-chromosomal-inheritance[1].pptx.pdfpdf
 
THE IMPORTANCE OF MARTIAN ATMOSPHERE SAMPLE RETURN.
THE IMPORTANCE OF MARTIAN ATMOSPHERE SAMPLE RETURN.THE IMPORTANCE OF MARTIAN ATMOSPHERE SAMPLE RETURN.
THE IMPORTANCE OF MARTIAN ATMOSPHERE SAMPLE RETURN.
 
platelets- lifespan -Clot retraction-disorders.pptx
platelets- lifespan -Clot retraction-disorders.pptxplatelets- lifespan -Clot retraction-disorders.pptx
platelets- lifespan -Clot retraction-disorders.pptx
 
EY - Supply Chain Services 2018_template.pptx
EY - Supply Chain Services 2018_template.pptxEY - Supply Chain Services 2018_template.pptx
EY - Supply Chain Services 2018_template.pptx
 
Body fluids_tonicity_dehydration_hypovolemia_hypervolemia.pptx
Body fluids_tonicity_dehydration_hypovolemia_hypervolemia.pptxBody fluids_tonicity_dehydration_hypovolemia_hypervolemia.pptx
Body fluids_tonicity_dehydration_hypovolemia_hypervolemia.pptx
 
in vitro propagation of plants lecture note.pptx
in vitro propagation of plants lecture note.pptxin vitro propagation of plants lecture note.pptx
in vitro propagation of plants lecture note.pptx
 
Unveiling the Energy Potential of Marshmallow Deposits.pdf
Unveiling the Energy Potential of Marshmallow Deposits.pdfUnveiling the Energy Potential of Marshmallow Deposits.pdf
Unveiling the Energy Potential of Marshmallow Deposits.pdf
 
Earliest Galaxies in the JADES Origins Field: Luminosity Function and Cosmic ...
Earliest Galaxies in the JADES Origins Field: Luminosity Function and Cosmic ...Earliest Galaxies in the JADES Origins Field: Luminosity Function and Cosmic ...
Earliest Galaxies in the JADES Origins Field: Luminosity Function and Cosmic ...
 
Comparing Evolved Extractive Text Summary Scores of Bidirectional Encoder Rep...
Comparing Evolved Extractive Text Summary Scores of Bidirectional Encoder Rep...Comparing Evolved Extractive Text Summary Scores of Bidirectional Encoder Rep...
Comparing Evolved Extractive Text Summary Scores of Bidirectional Encoder Rep...
 
Comparative structure of adrenal gland in vertebrates
Comparative structure of adrenal gland in vertebratesComparative structure of adrenal gland in vertebrates
Comparative structure of adrenal gland in vertebrates
 
Orion Air Quality Monitoring Systems - CWS
Orion Air Quality Monitoring Systems - CWSOrion Air Quality Monitoring Systems - CWS
Orion Air Quality Monitoring Systems - CWS
 
Observation of Io’s Resurfacing via Plume Deposition Using Ground-based Adapt...
Observation of Io’s Resurfacing via Plume Deposition Using Ground-based Adapt...Observation of Io’s Resurfacing via Plume Deposition Using Ground-based Adapt...
Observation of Io’s Resurfacing via Plume Deposition Using Ground-based Adapt...
 

C.2 communities and ecosystem

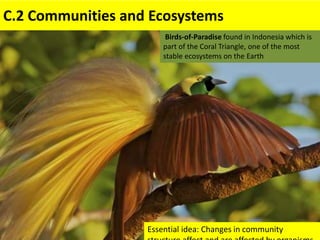
  • 1. Essential idea: Changes in community structure affect and are affected by organisms. C.2 Communities and Ecosystems Essential idea: Changes in community Birds-of-Paradise found in Indonesia which is part of the Coral Triangle, one of the most stable ecosystems on the Earth
  • 2. Understandings, Applications and Skills Statement Guidance C.2 U.1 Most species occupy different trophic levels in multiple food chains. C.2 U.2 A food web shows all the possible food chains in a community. C.2 U.3 The percentage of ingested energy converted to biomass is dependent on the respiration rate. C.2 U.4 The type of stable ecosystem that will emerge in an area is predictable based on climate. C.2 U.5 In closed ecosystems energy but not matter is exchanged with the surroundings. C.2 U.6 Disturbance influences the structure and rate of change within ecosystems. C.2.A1 Conversion ratio in sustainable food production practices. C.2.A2 Consideration of one example of how humans interfere with nutrient cycling C.2.S1 Comparison of pyramids of energy from different ecosystems. C.2.S2 Analysis of a climograph showing the relationship between temperature, rainfall and the type of ecosystem. C.2.S3 Construction of Gersmehl diagrams to show the inter-relationships between nutrient stores and flows between taiga, desert and tropical rainforest. C.2.S4 Analysis of data showing primary succession. C.2.S5 Investigation into the effect of an environmental disturbance on an ecosystem. Examples of aspects to investigate in the ecosystem could be species diversity, nutrient cycling, water movement, erosion, leaf area index, among others.
  • 3. C.2 U.1 Most species occupy different trophic levels in multiple food chains. • A food chain is a linear network of links in a food web starting from producer organisms (such as grass or trees which use radiation from the sun to make their food) and ending at apex predator species (like a Loin), detrivores (like earthwor ms or woodlice), or decomposer species (such as fungi or bacteria). • A food chain also shows how the organisms are related with each other by the food they eat. Each level of a food chain represents a different trophic level.
  • 4. A food web is a diagram that shows how food chains are linked together into more complex feeding relationships within a community. There can be more than one producer in a food web, and consumers can occupy multiple positions (trophic levels) C.2 U.2 A food web shows all the possible food chains in a community.
  • 5. Energy: is an Open system on Earth
  • 6. C.2 U.3 The percentage of ingested energy converted to biomass is dependent on the respiration rate. ECOSYSTEMS AND ENERGY FLOW • The concept of energy flow in ecosystems is a cornerstone of ecology. • Energy flow in ecosystems is based on the assumption that the laws of thermodynamics apply to all observable nature and thus apply to trophic levels. Two Laws of Matter and Energy 1. Matter and energy can not be created or destroyed. The law of conservation of matter and energy. 2. When energy is changed from one form to another some is always degraded into heat. Energy transfer is never 100% efficient.
  • 7. Less then 0.5% of the Suns energy is converted into biomass. Only 5% to 20% of that assimilated energy passes between trophic levels Gross production: is the energy converted by plants into biomass Net production: is the energy available to the heterotrophic component of the ecosystem minus plant respiration during metabolic activities. C.2 U.3 The percentage of ingested energy converted to biomass is dependent on the respiration rate. Net Production (NP) = Gross Production (GP) – Respiration (R) or NP = GP – R Units = kJ m-2year-1 Example: Calculate the values of net production using the equation above • Gross Production = 809 kJ/m2yr • Respiration = 729 kJ/m2yr 809-729 = 80 • Net Production = 80 kJ/m2yr
  • 8. I: food ingested by a consumer A: a portion is assimilated across the gut wall, convert nutrient to body biomass (digestion, absorption) E: remainder is expelled from the body as waste products (egested energy). animal excrete small portion as nitrogen-containing compounds (as ammonia, urea, uric acid) (excreted energy) R: of the energy assimilated, part is used for respiration (respired energy) P: remainder goes to production (new growth and reproduction) C.2 U.3 The percentage of ingested energy converted to biomass is dependent on the respiration rate. Energy use is a complex process. Not all consumers have the same efficiency A simple model of energy flow through consumer
  • 9. C.2 U.3 The percentage of ingested energy converted to biomass is dependent on the respiration rate. Energy decreases in each successive trophic level
  • 10. C.2 S.1 Comparison of pyramids of energy from different ecosystems.
  • 11. C.2 S.1 Comparison of pyramids of energy from different ecosystems.
  • 12. C.2 S.1 Comparison of pyramids of energy from different ecosystems.
  • 13. C.2 S.1 Comparison of pyramids of energy from different ecosystems.
  • 14. C.2 S.1 Comparison of pyramids of energy from different ecosystems.
  • 15. C.2 S.1 Comparison of pyramids of energy from different ecosystems.
  • 16. C.2 S.1 Comparison of pyramids of energy from different ecosystems.
  • 17. C.2 S.1 Comparison of pyramids of energy from different ecosystems.
  • 18. C.2 S.1 Comparison of pyramids of energy from different ecosystems.
  • 19. source of data: http://users.rcn.com/jkimball.ma.ultranet/BiologyPages/N/NetProductivity.html To understand why analyze the energy pyramids of the different ecosystems. Net productivity of different ecosystems varies greatly C.2 S.1 Comparison of pyramids of energy from different ecosystems.
  • 20. 1. High primary productivity (by producers) means more energy is available to the ecosystem. 3. Higher the primary productivity and greater the effeciency of energy transfer mean that more energy is available at high trophic levels. This can support longer the food chains, hence and more trophic levels increasing net productivity. Ecosystems rarely have more than 4 or 5 trophic levels. 2. The higher the efficiency of energy transfer between trophic levels the higher the net productivity. Energy transfer is typically 10%. Reasons for high net productivity of an ecosystem (4 trophic levels) (5 trophic levels) C.2 S.1 Comparison of pyramids of energy from different ecosystems.
  • 21. Biogeochemical Cycles: (Are a closed system on Earth) What is a Biogeochemical Cycle? – Only so much matter on earth because it is acts as a closed system. • Energy enters as sunlight, but no matter usually exits or enters. • Open system: Energy AND matter are exchanged. – These cycles act as a way to recycle matter within the biosphere from one form to another. C.2 U.5 In closed ecosystems energy but not matter is exchanged with the surroundings.
  • 22. Energy Vs. Matter • Energy is TRANSFERRED – One-way flow of energy through food-chains and food webs. • Energy from sun goes to plants, which then goes to consumers. – Each trophic level loses ~90% of energy as heat. – Only 10% of energy is used for life processes. • Matter is TRANSFORMED – This is why we have biogeochemical cycles. – Only have a given amount of matter because Earth is a closed ecosystem. C.2 U.5 In closed ecosystems energy but not matter is exchanged with the surroundings.
  • 23. Nutrient Cycles • Carbon - key ingredient in living tissue – “Carbon-based” life forms • Nitrogen - required for amino acids used in protein synthesis – What are our sources of protein? – What do we use proteins for? • Phosphorus - required for DNA and RNA – Why is this important? C.2 U.5 In closed ecosystems energy but not matter is exchanged with the surroundings.
  • 24. C.2 A.1 Conversion ratio in sustainable food production practices. In commercial (animal) food production, farmers measure the food conversion ratio (FCR). It is a measure of an animal's efficiency in converting feed mass into the desired output. For dairy cows, for example, the output is milk, whereas animals raised for meat, for example, pigs the output is the mass gained by the animal. mass of the food eaten (g) (increase in) desired output (g) (per specified time period)FCR = http://en.wikipedia.org/wiki/Feed_conversion_ratio Animal FCR Beef Cattle 5 - 20 Pigs 3 - 3.2 Sheep 4 - 6 Poultry 1.4 - 2 Salmon 1.2 - 3 The lower the FCR the more efficient the method of food production. It is calculated by:
  • 25. http://en.wikipedia.org/wiki/Feed_conversion_ratio A good (low) FCR is obtained by minimizing the losses of energy by respiration, for example: • Restricting animal movement • Slaughtering the animal at a young age (older animals have higher FCRs as they grow more slowly) • Optimizing feed so it is efficiently digested How ethical are the practices that lead to a low FCR? What is more important, efficient food production or the ethical treatment of animals? C.2 A.1 Conversion ratio in sustainable food production practices. Animal FCR Beef Cattle 5 - 20 Pigs 3 - 3.2 Sheep 4 - 6 Poultry 1.4 - 2 Salmon 1.2 - 3
  • 26. C.2 A.2 Consideration of one example of how humans interfere with nutrient cycling. Humans practices can accelerate the the flow of matter into and out of ecosystems. This by implication (and often design) alters the nutrient cycling in ecosystems. Phosphate mined and converted to fertilizer. Nitrate fertilizer produced from atmospheric Nitrogen (by the Haber process) Agriculture Harvesting of crops Water run-off (leaching) from agricultural fields results in build- up of phosphates and nitrates in waterways and leads to eutrophication.
  • 27. Some Agents of Disturbance • Fire • Floods • Drought • Large Herbivores • Storms • Volcanoes • Human Activity C.2 U.6 Disturbance influences the structure and rate of change within ecosystems. Disturbances are events such as floods, fire, droughts, overgrazing, and human activity that damage communities, remove organisms from them, and alter resource availability
  • 28. C.2 S.5 Investigation into the effect of an environmental disturbance on an ecosystem.
  • 29. C.2 S.5 Investigation into the effect of an environmental disturbance on an ecosystem. Your investigation should compare a site undergoing secondary succession with a primary ecosystem. This can be extended to look at the various stages of secondary succession if local sites allow. Ways of measuring the affect of succession include: • Species diversity • Stem/Seedling density • Biomass • Canopy coverage / light intensity at the surface • Depth/Volume of leaf litter • Soil nutrient levels https://khorra.files.wordpress.co m/2013/02/moving-glacier.jpg
  • 30. Primary Succession • Begins in a place without any soil: Sides of volcanoes Landslides Flooding • First, lichens that do not need soil to survive grow on rocks • Next, mosses grow to hold newly made soil • Known as PIONEER SPECIES Ecological Succession • Natural, gradual changes in the types of species that live in an area • Can be primary or secondary • The gradual replacement of one plant community by another over time C.2 U.6 Disturbance influences the structure and rate of change within ecosystems.
  • 31. Secondary Succession • Begins in a place that already has soil and was once the home of living organisms • Occurs faster and has different pioneer species than primary succession • Example: after forest fires C.2 U.6 Disturbance influences the structure and rate of change within ecosystems.
  • 32. Climax Community • A stable group of plants and animals that is the end result of the succession process • Does not always mean big trees – Grasses in prairies – Cacti in deserts C.2 U.6 Disturbance influences the structure and rate of change within ecosystems.
  • 33. C.2 S.4 Analysis of data showing primary succession. Changes over time in total plant species richness over time at select sites on Mount Saint Helens, WA http://www.nature.com/scitable/knowledge /library/succession-a-closer-look-13256638 Use the examples to analyze data showing primary succession http://wps.pearsoncustom.com/ wps/media/objects/2128/21794 41/28_03.html
  • 34. Biome is a geographical area that has a particular climate and sustains a specific community of plants and animals (i.e. a type of ecosystem) Biosphere is the total of all areas where living things are found (i.e. the totality of biomes) • The main factors affecting the distribution of biomes is temperature and rainfall • These factors will vary according to latitude and longitude, elevation and proximity to the sea • Temperature is influential because it affects the rate of metabolism – the phases in the life cycles of many organisms are temperature dependent • In the same way, the availability of fresh water (both in the soil and in rivers and lakes) is critical to the growth and nutrition of organisms • Rainfall and warmer temperatures are more common near the equator and less common at the poles http://ib.bioninja.com.au/options/option-g-ecology-and-conser/g2-ecosystems-and-biomes.html C.2 S.2 Analysis of a climograph showing the relationship between temperature, rainfall and the type of ecosystem.
  • 35. The six major types of biome/ecosystem are outlined in the table below C.2 S.2 Analysis of a climograph showing the relationship between temperature, rainfall and the type of ecosystem. Biome Temperature Rainfall Vegetation Desert Hot (>30oC)in the day Cold (<0oC) at night Low Precipitation Less than 30cm per year Xerophytes Adapted to water conservation Grassland Warm (20oC-30oC) Seasonal Droughts Medium amount of rain Grass with widely spaced trees Fires prevent trees from invading Shrub land Moderate (20oC-30oC) Rainy winters, dry summers Dry, woody shrubs Regrow quickly Coniferous Forrest (Taiga) Cold (0oC-15oC) Low Precipitation Wet due to lack of evaporation Epiphytes, tall trees and undergrowth Large diversity in species Tropical Rainforest Hot (20oC-30oC) High Precipitation Over 250cm per year Tundra Freezing (<0oC) Little Precipitation Small close to the ground (e.g. mosses) Perennial plants grow in the summer
  • 36. The six major types of biome/ecosystem are outlined in the table below C.2 S.2 Analysis of a climograph showing the relationship between temperature, rainfall and the type of ecosystem. Biome Temperature Rainfall Vegetation Desert Hot (>30oC)in the day Cold (<0oC) at night Low Precipitation Less than 30cm per year Xerophytes Adapted to water conservation Grassland Warm (20oC-30oC) Seasonal Droughts Medium amount of rain Grass with widely spaced trees Fires prevent trees from invading Shrub land Moderate (20oC-30oC) Rainy winters, dry summers Dry, woody shrubs Regrow quickly Coniferous Forrest (Taiga) Cold (0oC-15oC) Low Precipitation Wet due to lack of evaporation Epiphytes, tall trees and undergrowth Large diversity in species Tropical Rainforest Hot (20oC-30oC) High Precipitation Over 250cm per year Tundra Freezing (<0oC) Little Precipitation Small close to the ground (e.g. mosses) Perennial plants grow in the summer
  • 37. http://cispatm.pbworks.com/f/1209212862/biome_graph.jpg n.b. The biomes in regions within the dashed line are strongly influenced by other factors (e.g. seasonality of drought, fire, animal grazing). A climograph is a diagram which shows the relative combination of temperature and precipitation in an area. This modified climograph (first developed by Robert Whittaker) shows the stable ecosystems/biomes that arise as a result of the relative combination of temperature and precipitation. It is a graphical representation of the biome summary table (last slide). C.2 S.2 Analysis of a climograph showing the relationship between temperature, rainfall and the type of ecosystem.
  • 38. http://cispatm.pbworks.com/f/1209212862/biome_graph.jpg n.b. The biomes in regions within the dashed line are strongly influenced by other factors (e.g. seasonality of drought, fire, animal grazing). A climograph is a diagram which shows the relative combination of temperature and precipitation in an area. This modified climograph (first developed by Robert Whittaker) shows the stable ecosystems/biomes that arise as a result of the relative combination of temperature and precipitation. It is a graphical representation of the biome summary table (last slide). C.2 S.2 Analysis of a climograph showing the relationship between temperature, rainfall and the type of ecosystem.
  • 39. C.2 S.3 Construction of Gersmehl diagrams to show the inter-relationships between nutrient stores and flows between taiga, desert and tropical rainforest. http://commons.wikimedia.org/wiki/File:Nutrient_cycle.svg Gersmehl diagrams were first developed in 1976, by P.F. Gersmehl, to show the differences in nutrient flow and storage between different ecosystems Sinks for nutrient storage: • Biomass (flora and fauna) • Litter • Soil
  • 40. http://commons.wikimedia.org/wiki/File:Nutrient_cycle.svg Gersmehl diagrams were first developed in 1976, by P.F. Gersmehl, to show the differences in nutrient flow and storage between different ecosystems Nutrient inputs into the ecosystem: • Nutrients dissolved in raindrops • Nutrients from weathered rock Nutrient outputs (losses) from the ecosystem: • Nutrients lost through surface runoff • Nutrients lost through leaching C.2 S.3 Construction of Gersmehl diagrams to show the inter-relationships between nutrient stores and flows between taiga, desert and tropical rainforest.
  • 41. http://commons.wikimedia.org/wiki/File:Nutrient_cycle.svg When used to analyze a particular ecosystem: • Diameter of sinks are proportional to the mass of nutrients stored in each sink • the thickness of the arrows are proportional to the rate of nutrient flow Gersmehl diagrams were first developed in 1976, by P.F. Gersmehl, to show the differences in nutrient flow and storage between different ecosystems Flows between the sinks: • Littering (including withering, defoliation, excretion, unconsumed parts left over, dead bodies of animals, and so on) * • Decomposition of the litter into inorganic nutrients, which are then stored in the soil • Nutrient uptake by plants Human interactions are not considered – do not confuse littering with dropping trash * C.2 S.3 Construction of Gersmehl diagrams to show the inter-relationships between nutrient stores and flows between taiga, desert and tropical rainforest.
  • 42. • Litter (pine needles) is the main store • Slow rate of nutrient transfer between stores • Soil is the main store • Slow rate of nutrient transfer between stores (except for the transfer from biomass to litter) • Biomass is the main store (soil is nutrient poor) • Fast rate of nutrient transfer between stores tagia (temperate forest) desert tropical rainforest Image source: Allott, A. (2014). Biology: Course companion. S.l.: Oxford University Press. C.2 S.3 Construction of Gersmehl diagrams to show the inter-relationships between nutrient stores and flows between taiga, desert and tropical rainforest.
  • 43. C.2 U.4 The type of stable ecosystem that will emerge in an area is predictable based on climate. • The Coral Triangle is a geographical term used to describe the region that possesses the world’s highest levels of marine biodiversity. • The answer to why areas like the Coral Triangle harbor the world’s highest levels of marine biodiversity begins not with the individual organisms, but with geologic processes that began hundreds of millions of years ago. Plate tectonics, continental drift, and the advance and retreat of glaciers. Glacial periods have covered the Earth with ice at least 21 different times over the past several million years creating one of the most stable climate on Earth.
  • 44. C.2 U.4 The type of stable ecosystem that will emerge in an area is predictable based on climate. More than 3,000 species of fish live in the Coral Triangle, including the largest fish - the whale shark, and the coelacanth. It also provides habitat to six out of the world's seven marine turtle species. This great biodiversity is thought to be due to an extended period of little to no climate change
  • 45. C.2 U.4 The type of stable ecosystem that will emerge in an area is predictable based on climate. Borneo lowland rain forest is a tropical and subtropical of the large island of Borneo located in the Coral Triangle. It supports approximately 10,000 plant species, 380 bird species and several mammal species, which include the Orangutan