Visit to a blind student's school🧑🦯🧑🦯(community medicine)
Ia headings
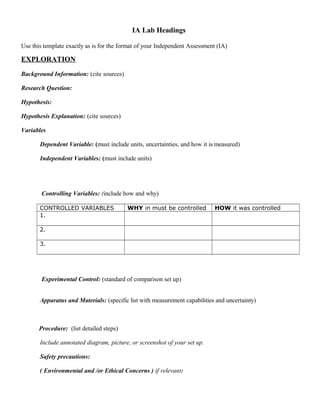
1. IA Lab Headings
Use this template exactly as is for the format of your Independent Assessment (IA)
EXPLORATION
Background Information: (cite sources)
Research Question:
Hypothesis:
Hypothesis Explanation: (cite sources)
Variables
Dependent Variable: (must include units, uncertainties, and how it is measured)
Independent Variables: (must include units)
Controlling Variables: (include how and why)
CONTROLLED VARIABLES WHY in must be controlled HOW it was controlled
1.
2.
3.
Experimental Control: (standard of comparison set up)
Apparatus and Materials: (specific list with measurement capabilities and uncertainty)
Procedure: (list detailed steps)
Include annotated diagram, picture, or screenshot of your set up.
Safety precautions:
( Environmental and /or Ethical Concerns ) if relevant:
2. ANALYSIS
Qualitative Data: Observations by use of the senses made during the experiment these are NOT
numerical values.
Quantitative Data: ( raw data tables with uncertainty +/- and units)
Processed Data: (additional data chart with processed data, MUST include Null/ Alt/ and Conclusion
for T-Tests!!!)
Graphic Representation of Processed Data: (excel generated graph of PROCESSED data NOT raw
quantitative data.)
Evaluation
Conclusion: (Describe and justify with your data and reasoning of using the statistical tests that
you used and researched science contexts and studies. Cite sources)
Evaluation of Methodology: (identify sources of error and limitations to your ability to control your
variables- what could have impacted your results???)
Improvements and Extensions: (parallel your sources of error and limitations with methods to
improve. Also include further investigation extension possibilities)
REFERENCES AND CITATION
3. Degrees of precision
If you use a ruler, graduated in millimetres, to measure an object (e.g. the length of a leaf) you will probably
find the edges of the object lie close to a millimetre division but probably not right on it. Recording the leaf is
"4.5cm-and-a-bit" long is not very useful. The accepted rule is that the degree of precision is ± the smallest
division on the instrument, in this case one millimetre. So the leaf in this example is 4.5cm ± 0.1cm. The
degree of precision will influence the instrument that you choose to make a measurement. For example if you
used the same ruler to measure an object 0.5cm long the degree of precision (± 0.1cm) is 20% of the
measurement, this is very large error margin and, so, it is not very precise. Therefore, we must choose an
appropriate instrument for measuring
Presenting Tables in Lab Reports
Table 1. Effect of temperature on the growth of Oak trees seedlings (±.5° C. ±1 mm)
Temperature (± .5° C) Growth in 48 h (±1 mm)
10 22
15 33
1. Title must have a table number before title. (above)
2. Headings must include units in parentheses.
3. Do not include units in the table beside the numbers. Show uncertainties.
4. There should only be horizontal lines in the table. Do not use vertical lines to divide the columns,
put spaces between the columns to keep them separate.
Presenting Graphs in Lab Reports
Figure 1: Effect of temperature on the growth of Oak
seedlings
0
5
10
15
20
25
30
0 5 10 15 20 25 30 35 40
Temperature (Celsius)
Growthin48h(mm)
1. Title must have a figure number before title. (Figures should go BELOW)
2. All units must be in axes titles in parentheses. Do not forget axes labels.
3. Avoid using color. Use different line patterns for separate plots on same graph.
4. Must have a key for all lines in graph.