The document provides lesson materials on tables and graphs, including:
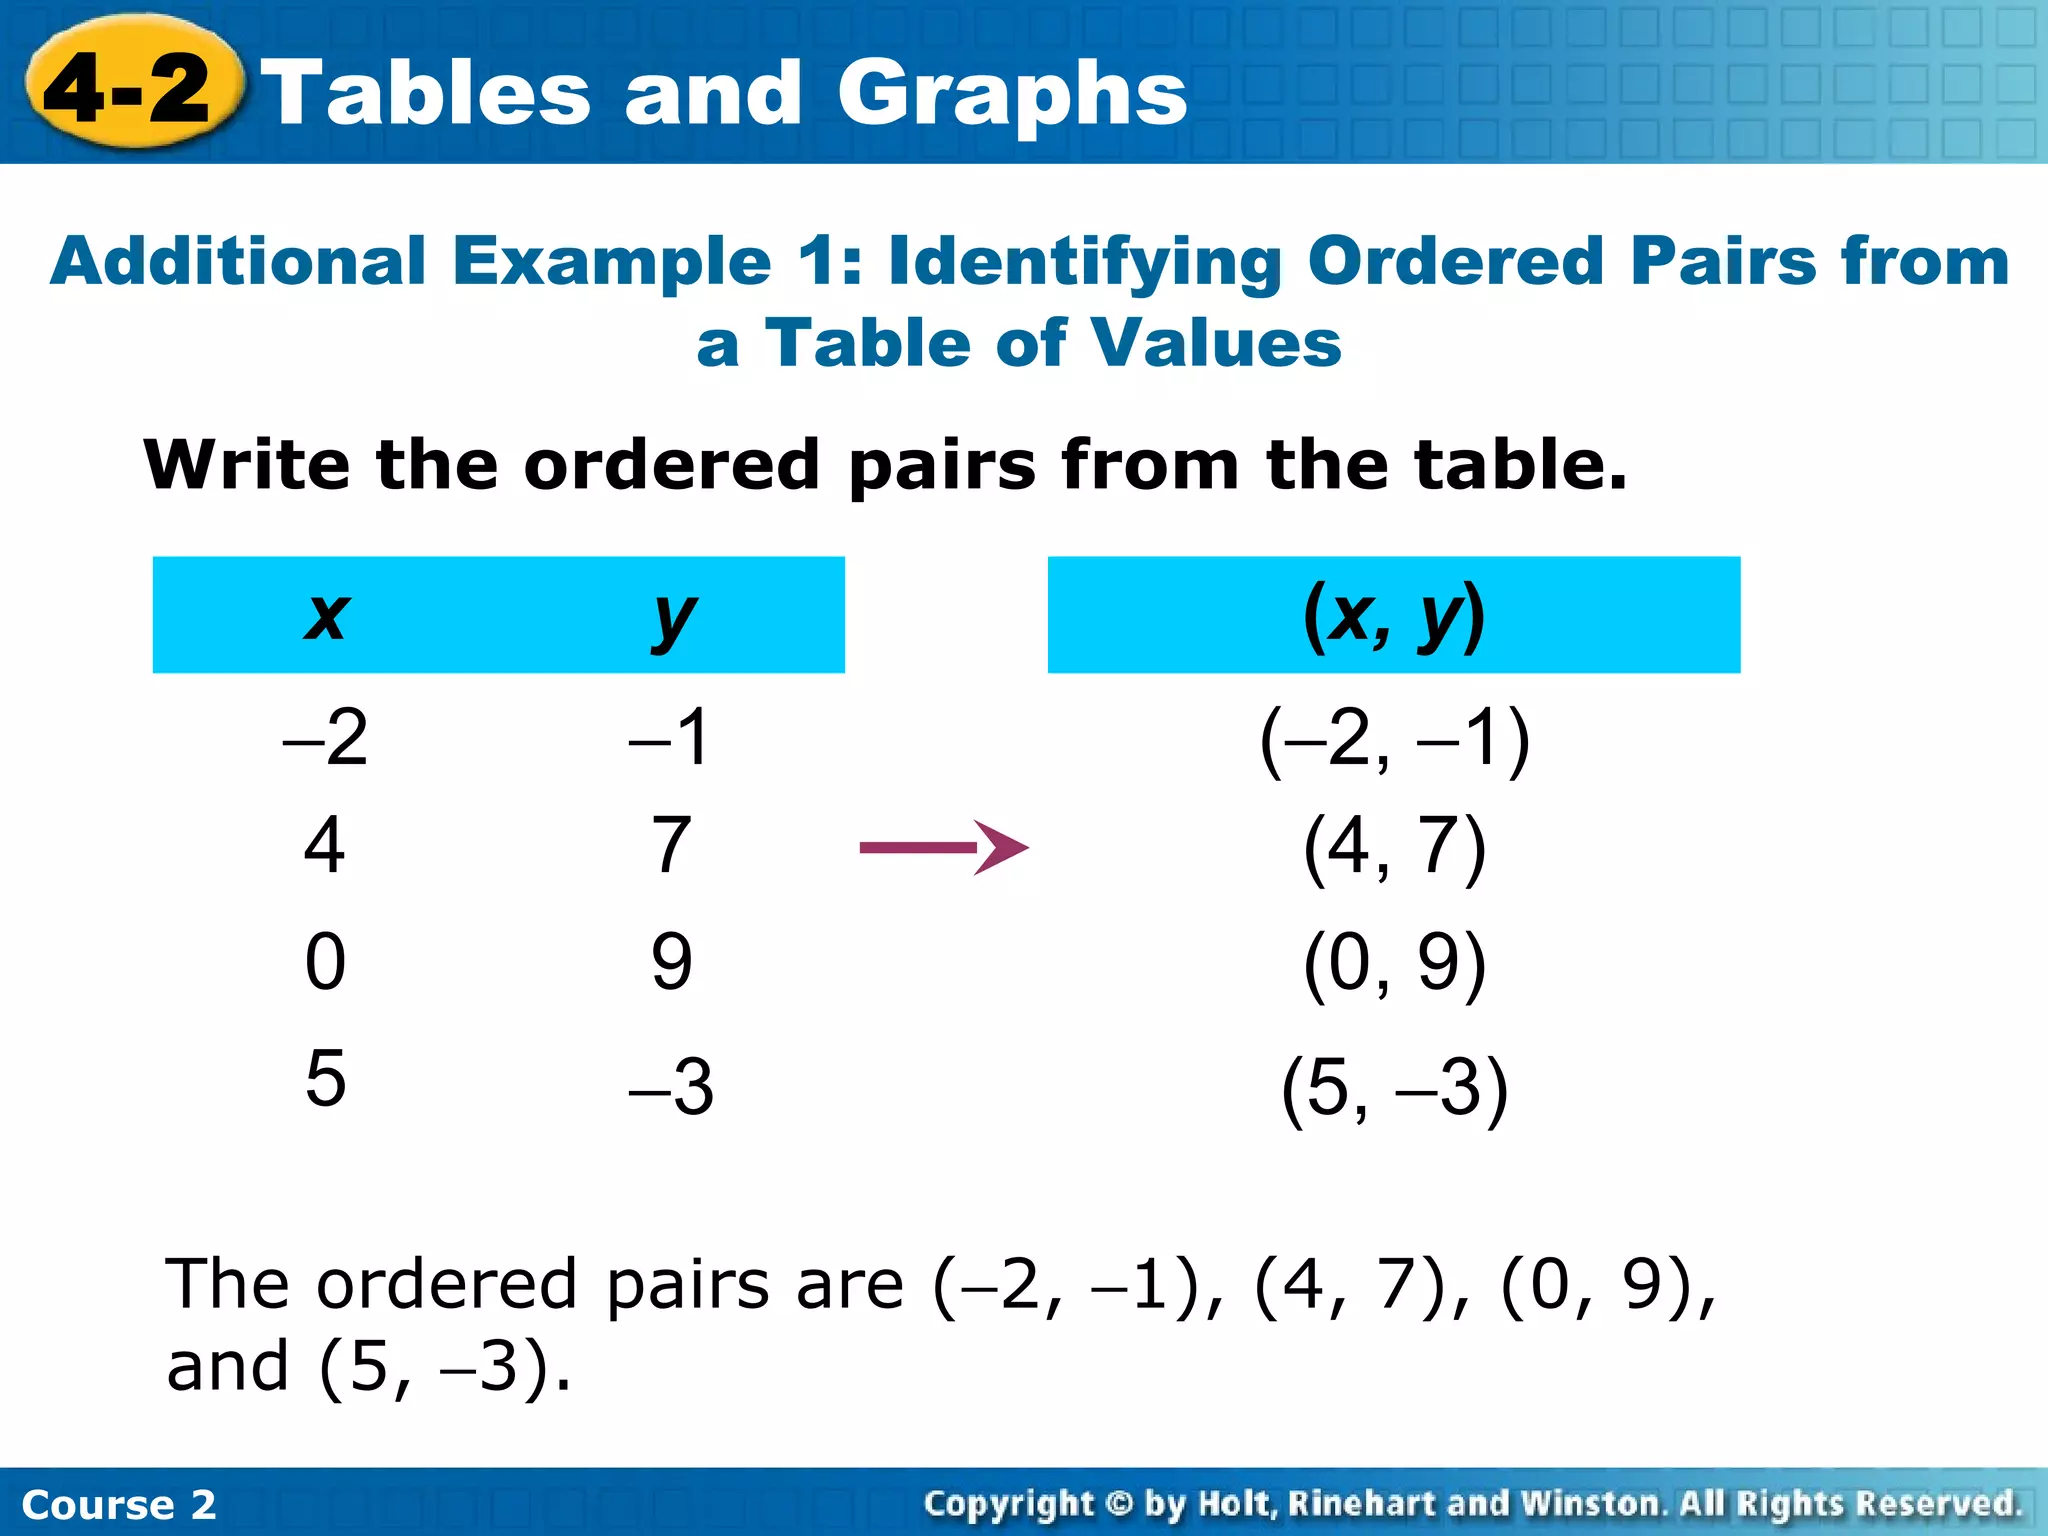
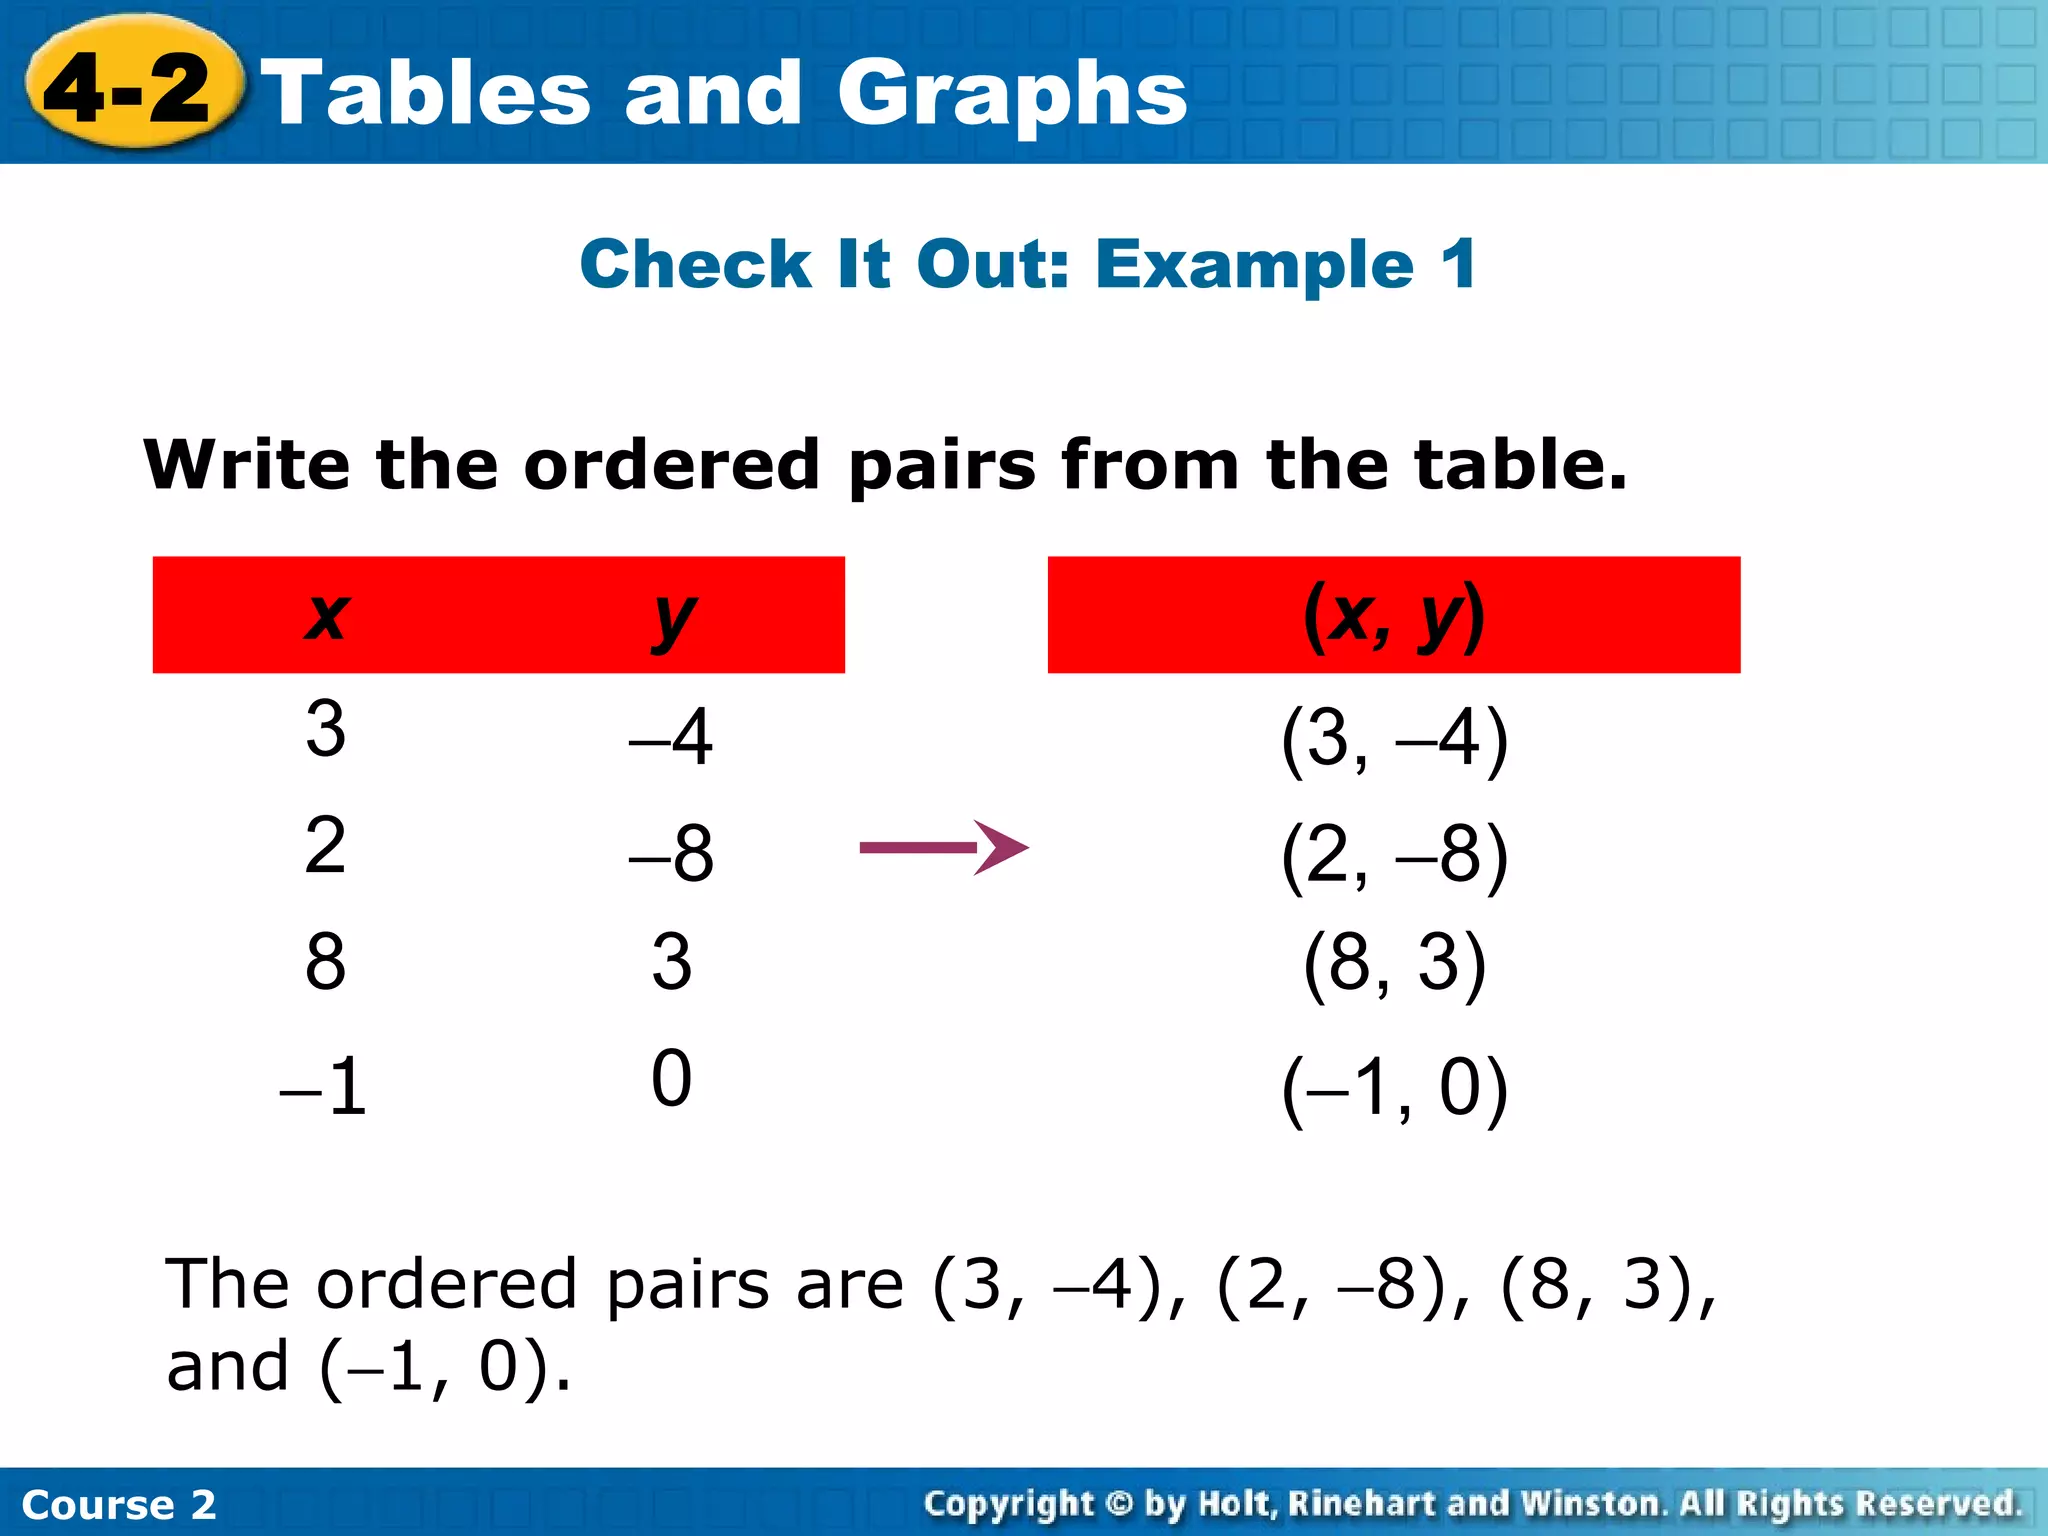
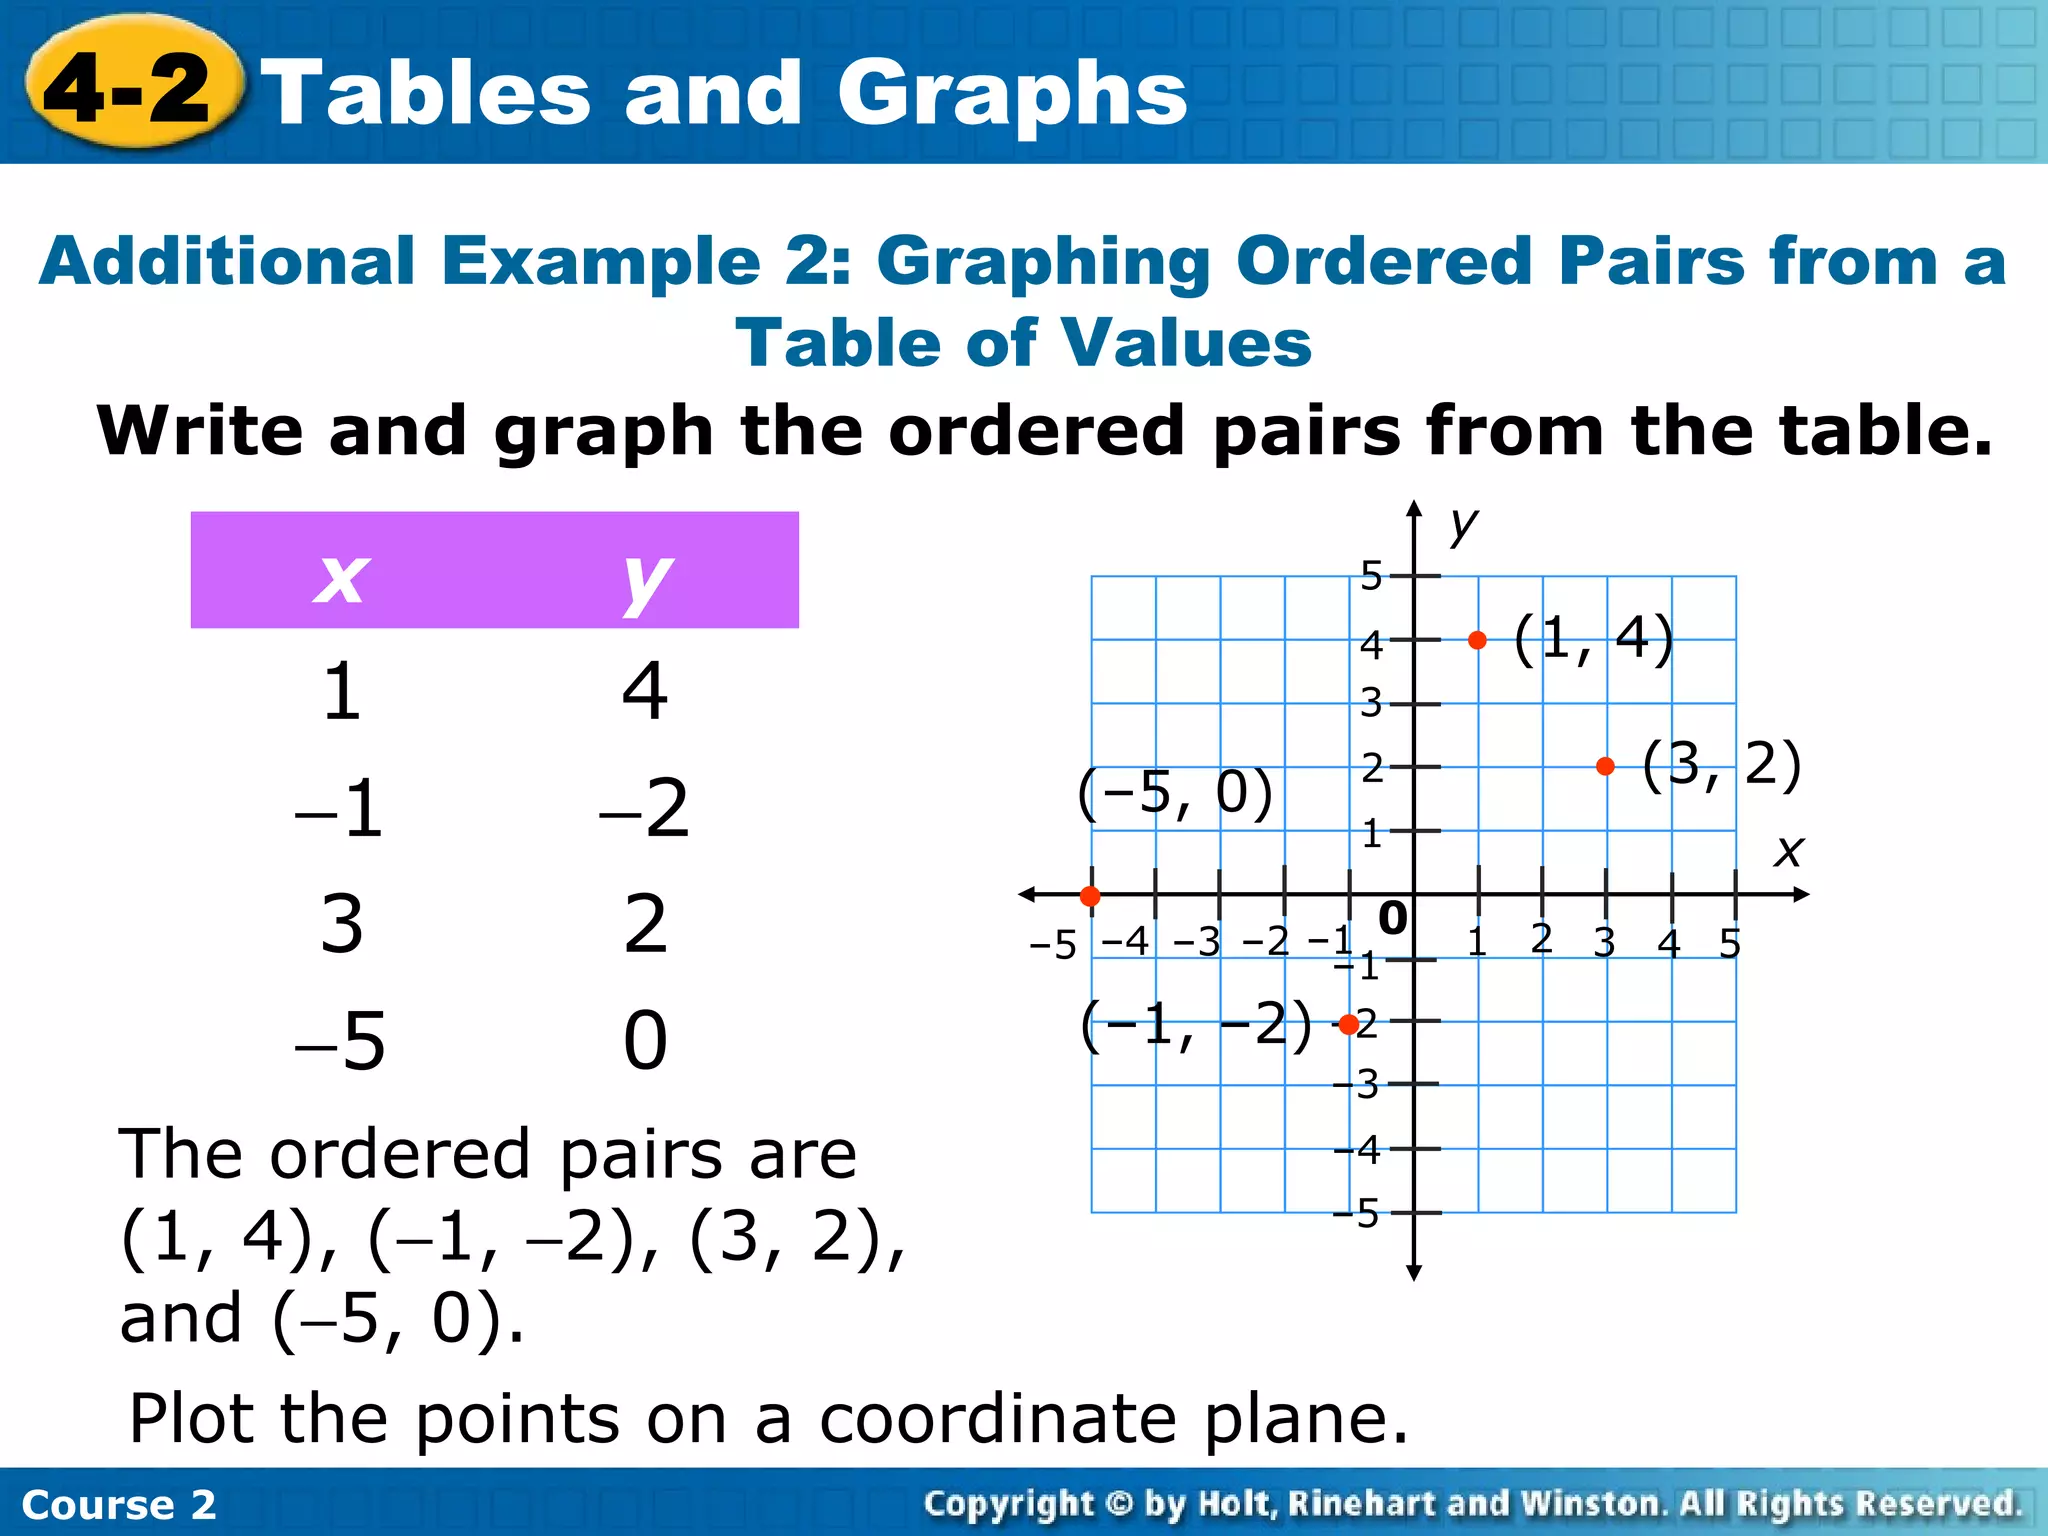
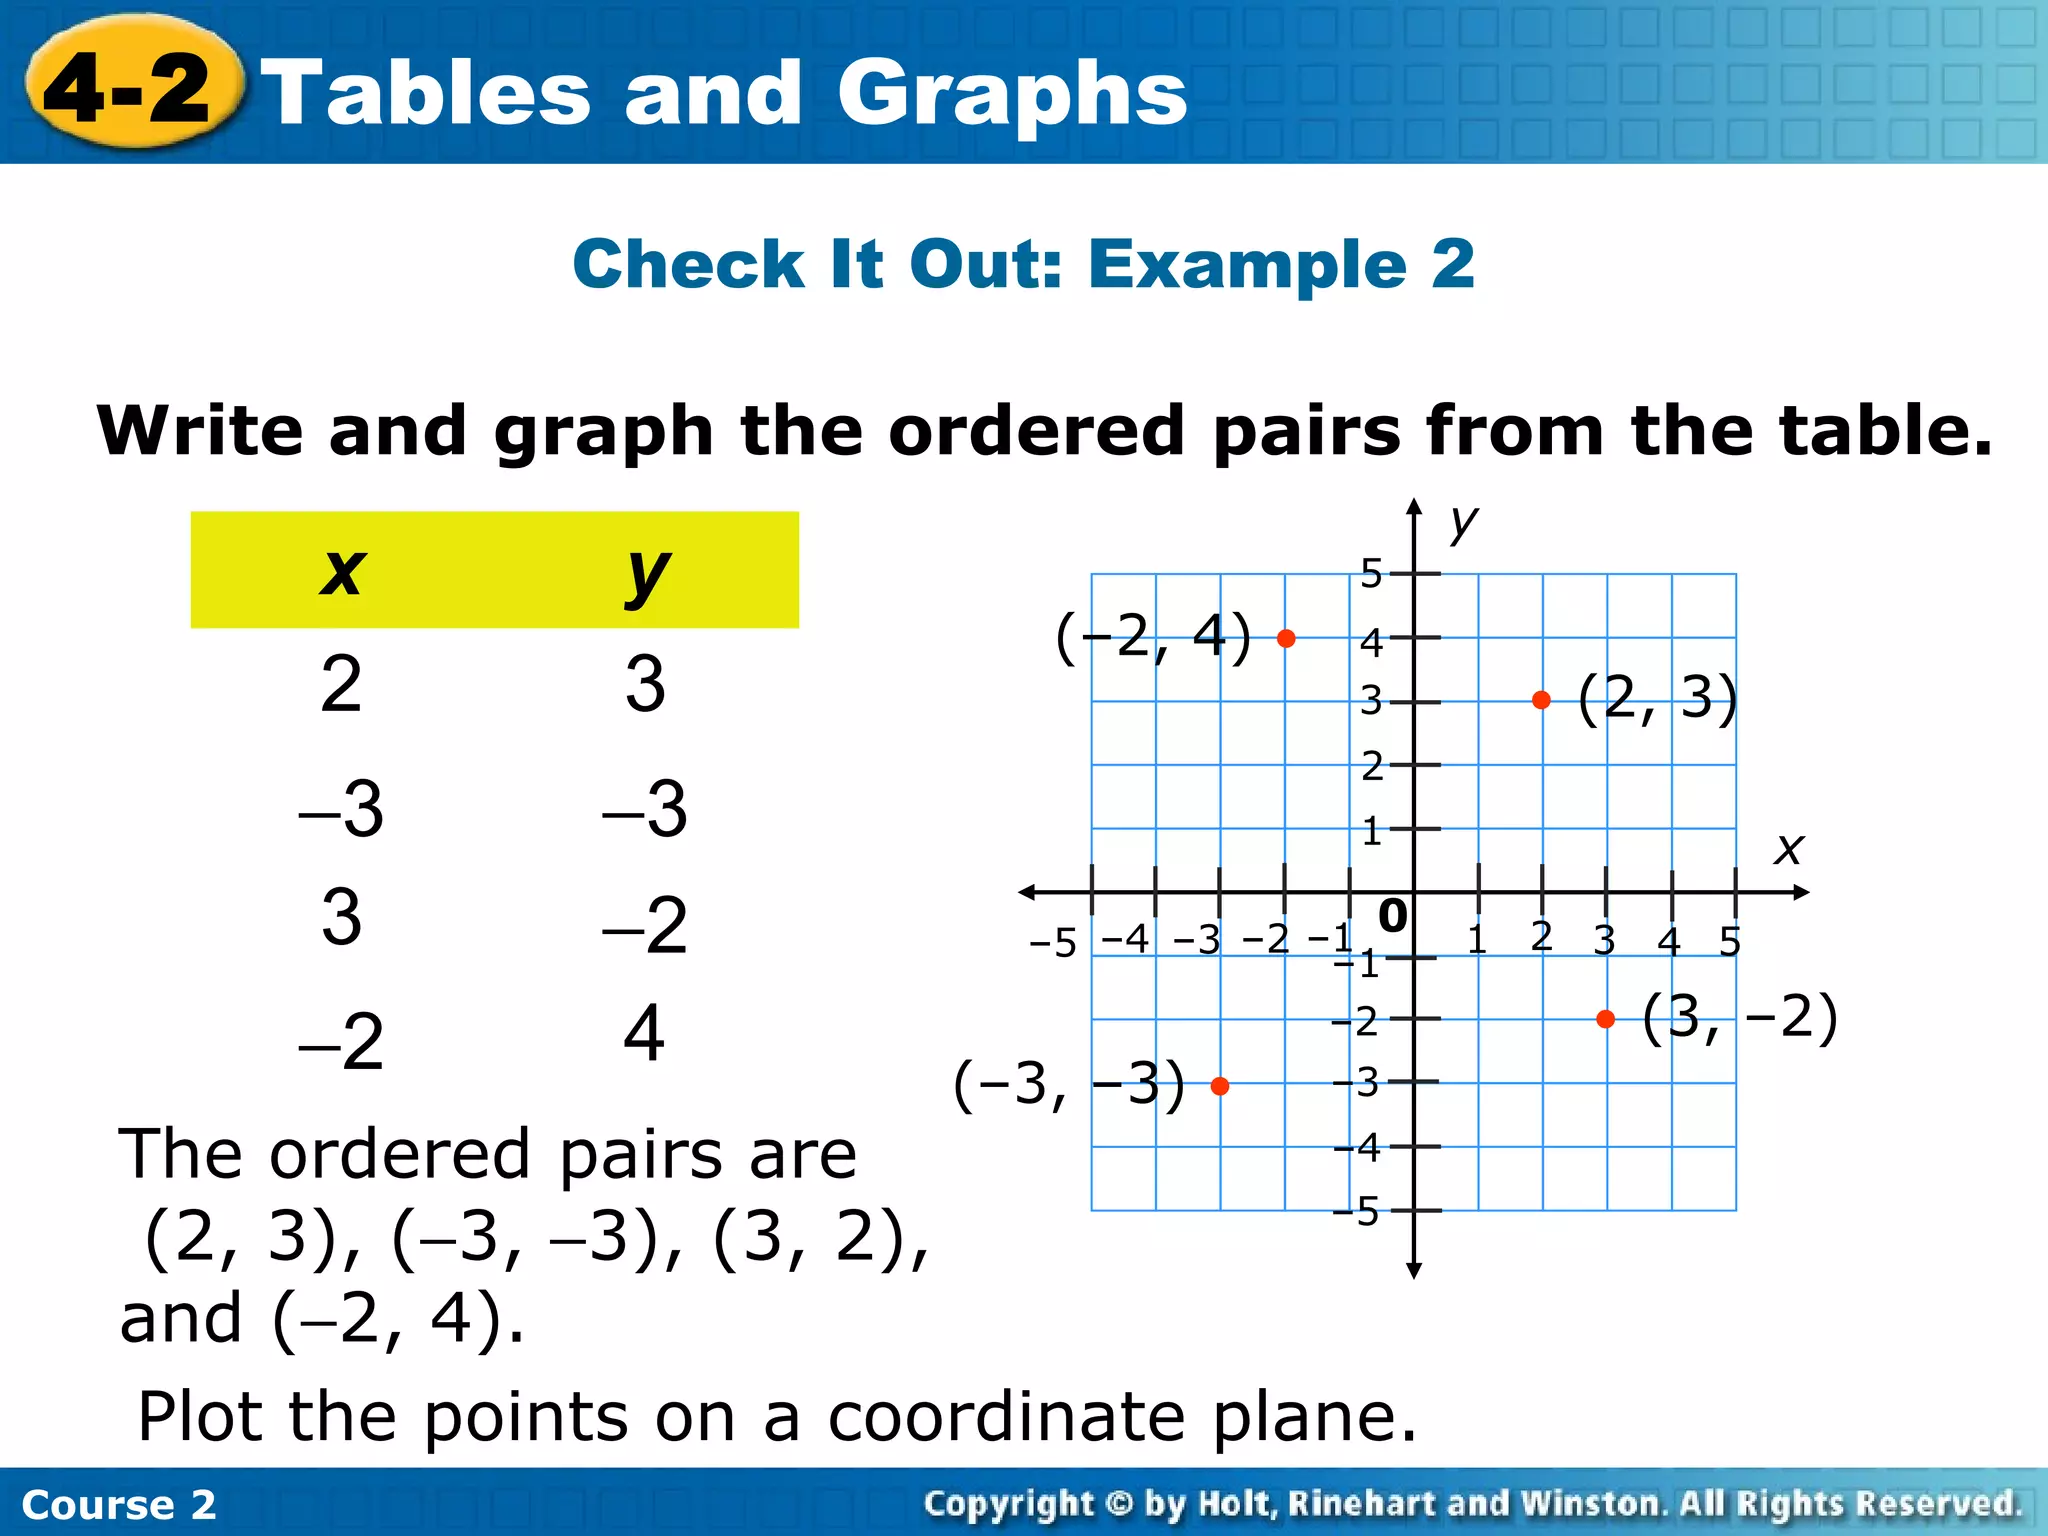
- Examples of identifying ordered pairs from tables and graphing the points on a coordinate plane. The examples show a direct relationship between variables.
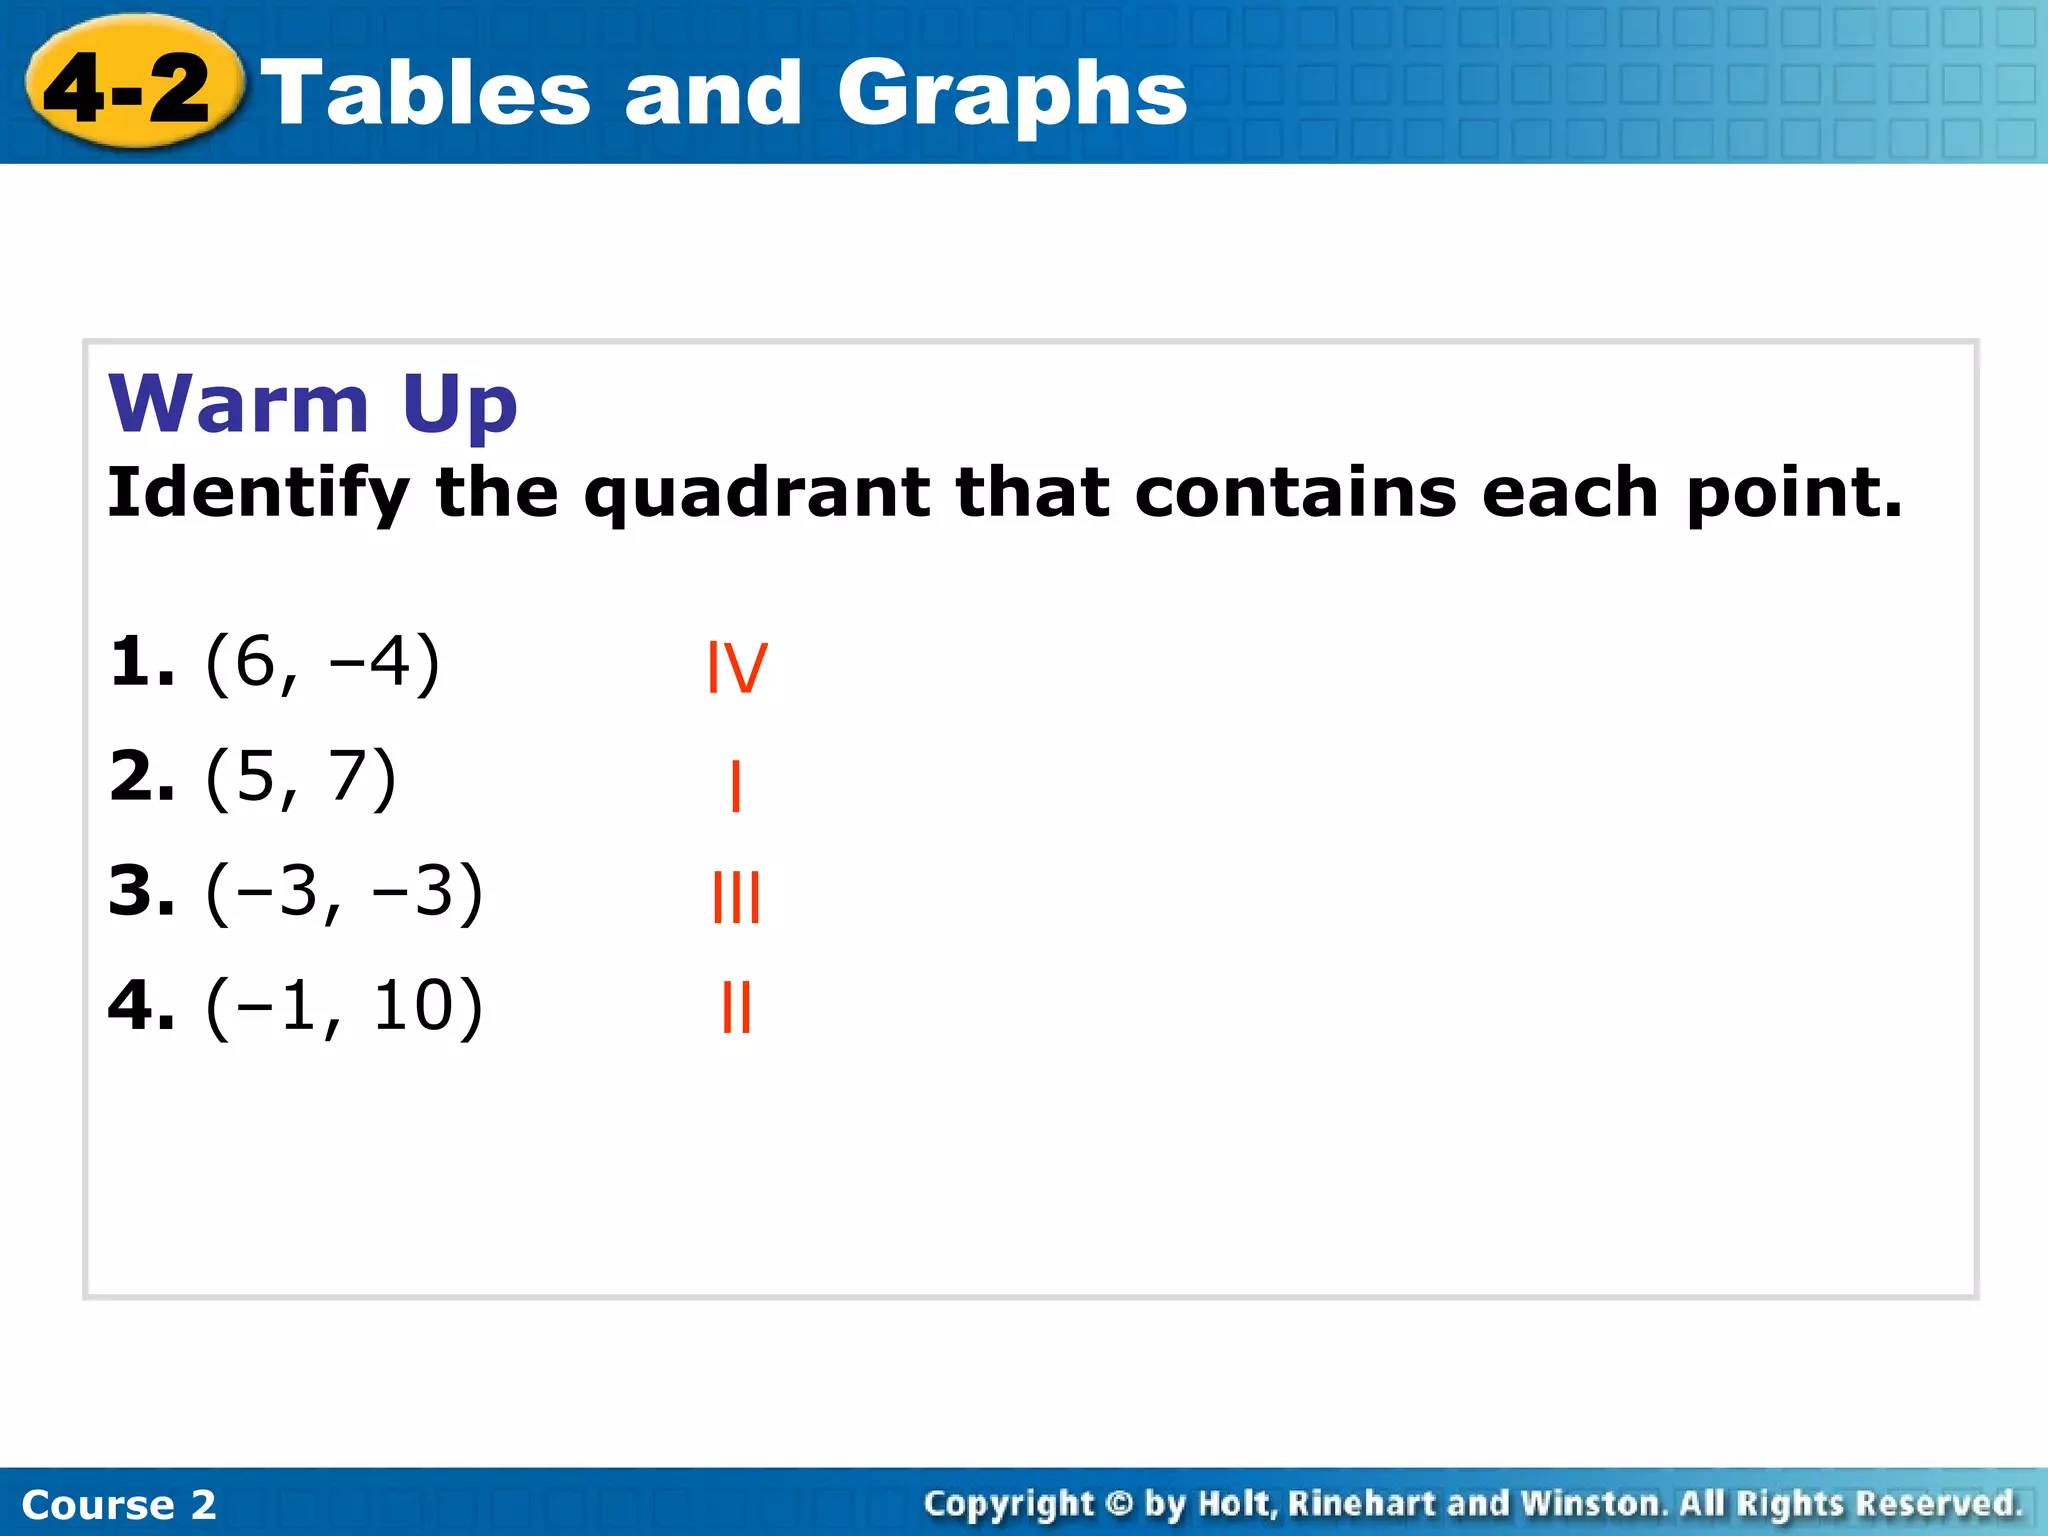
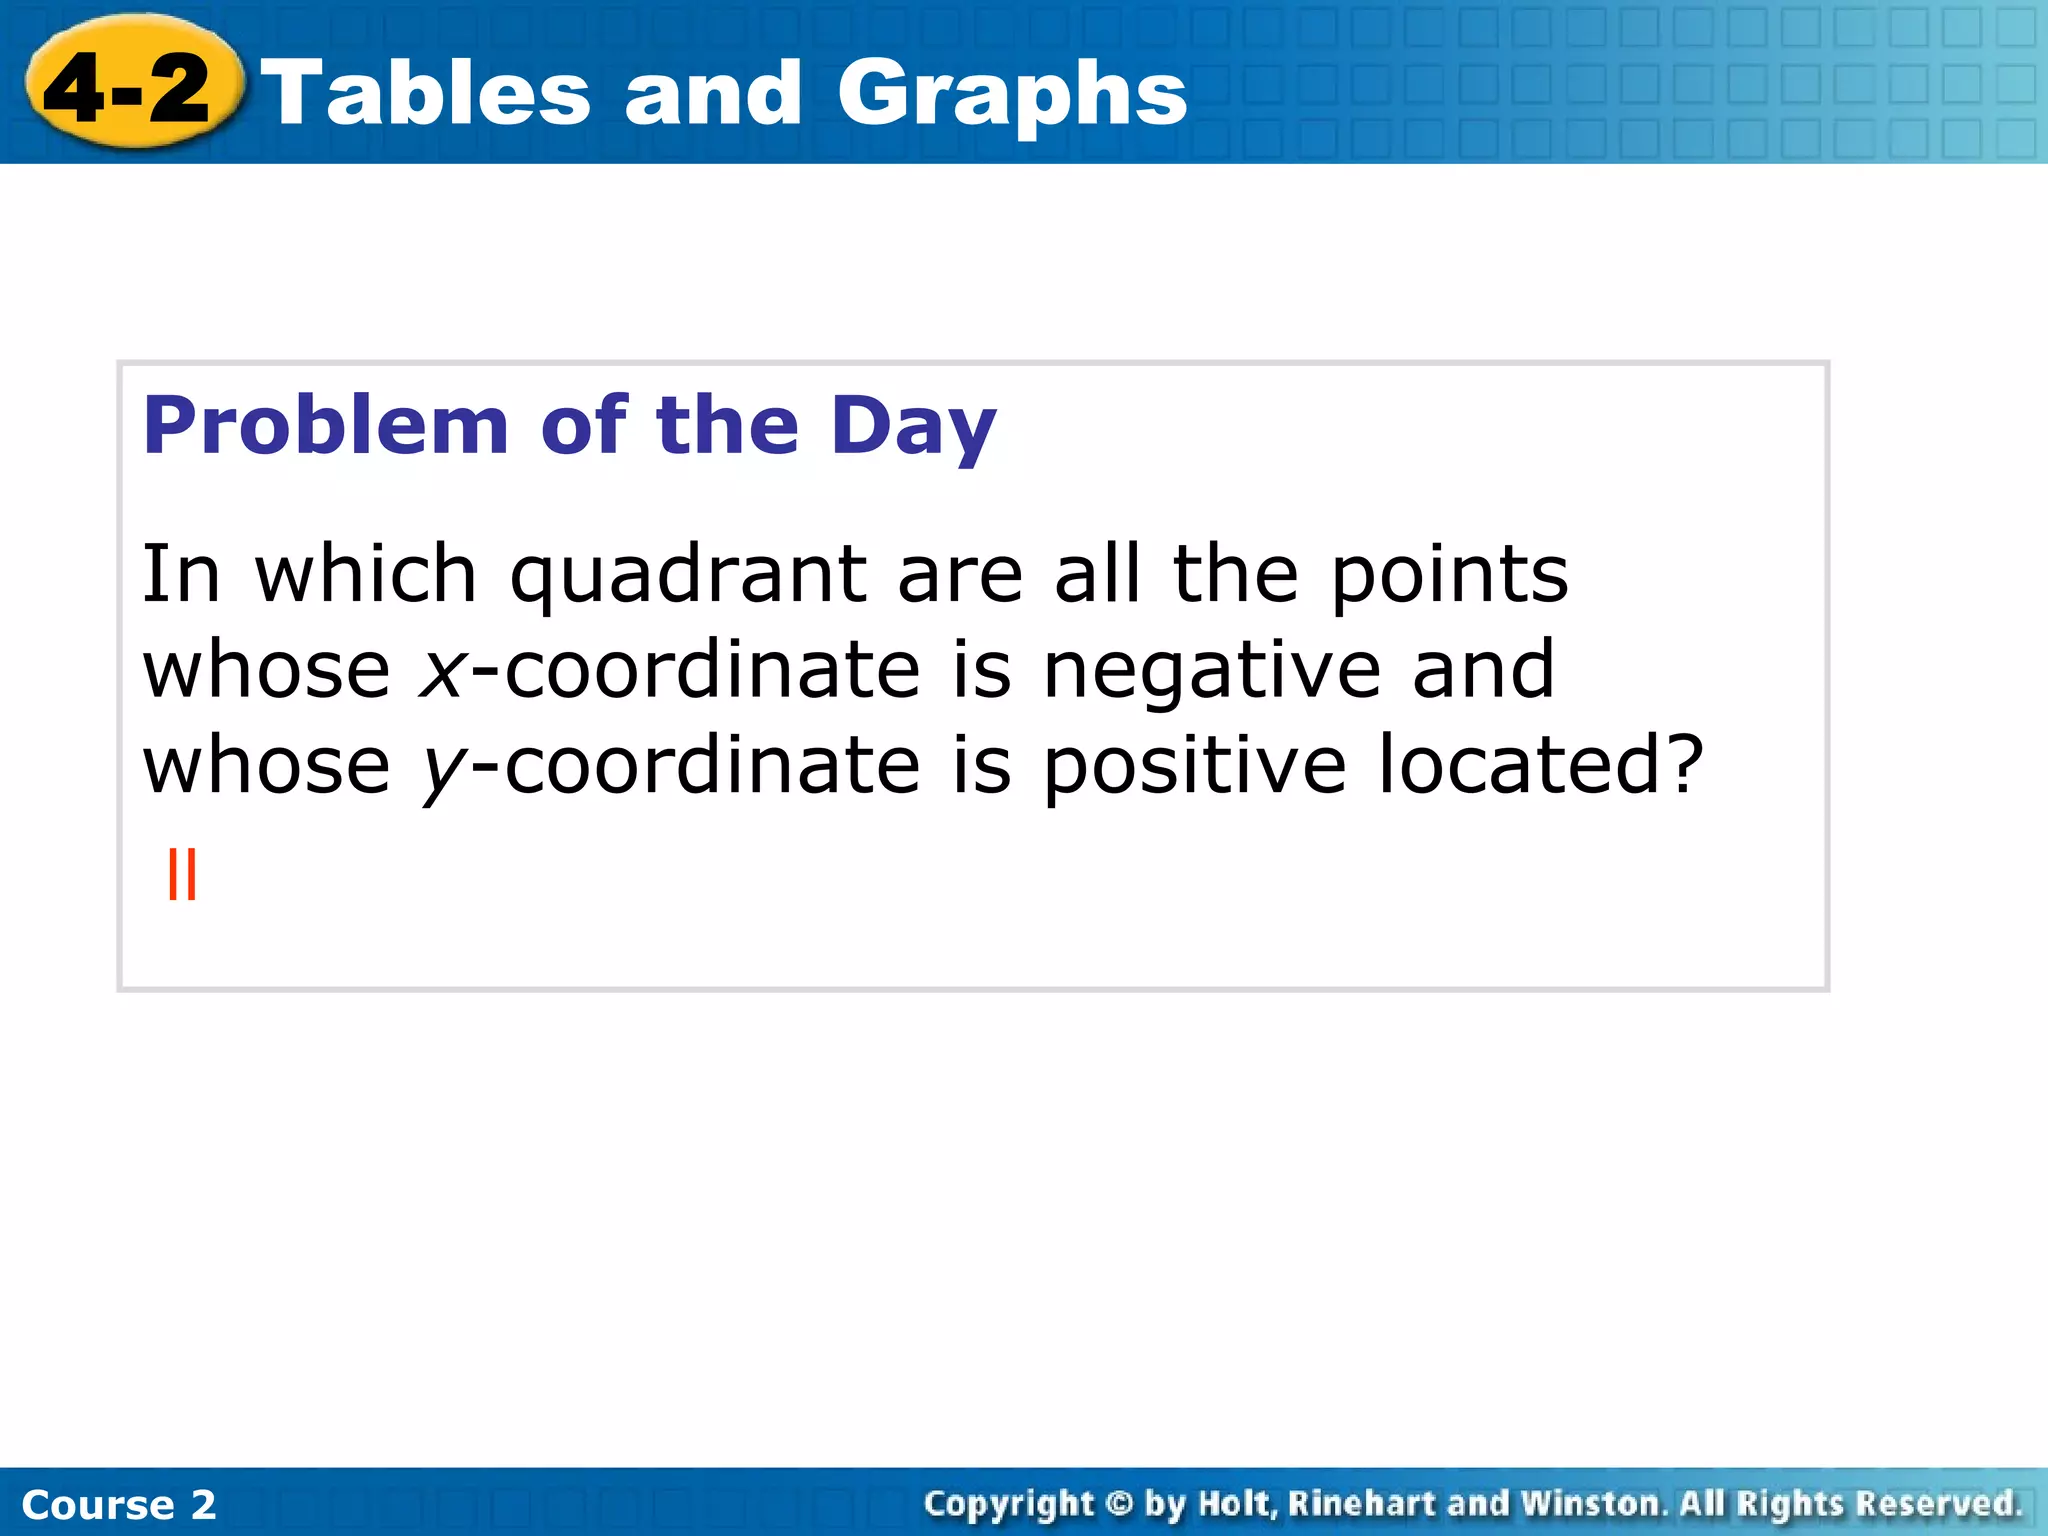
- A warm up on identifying points in quadrants.
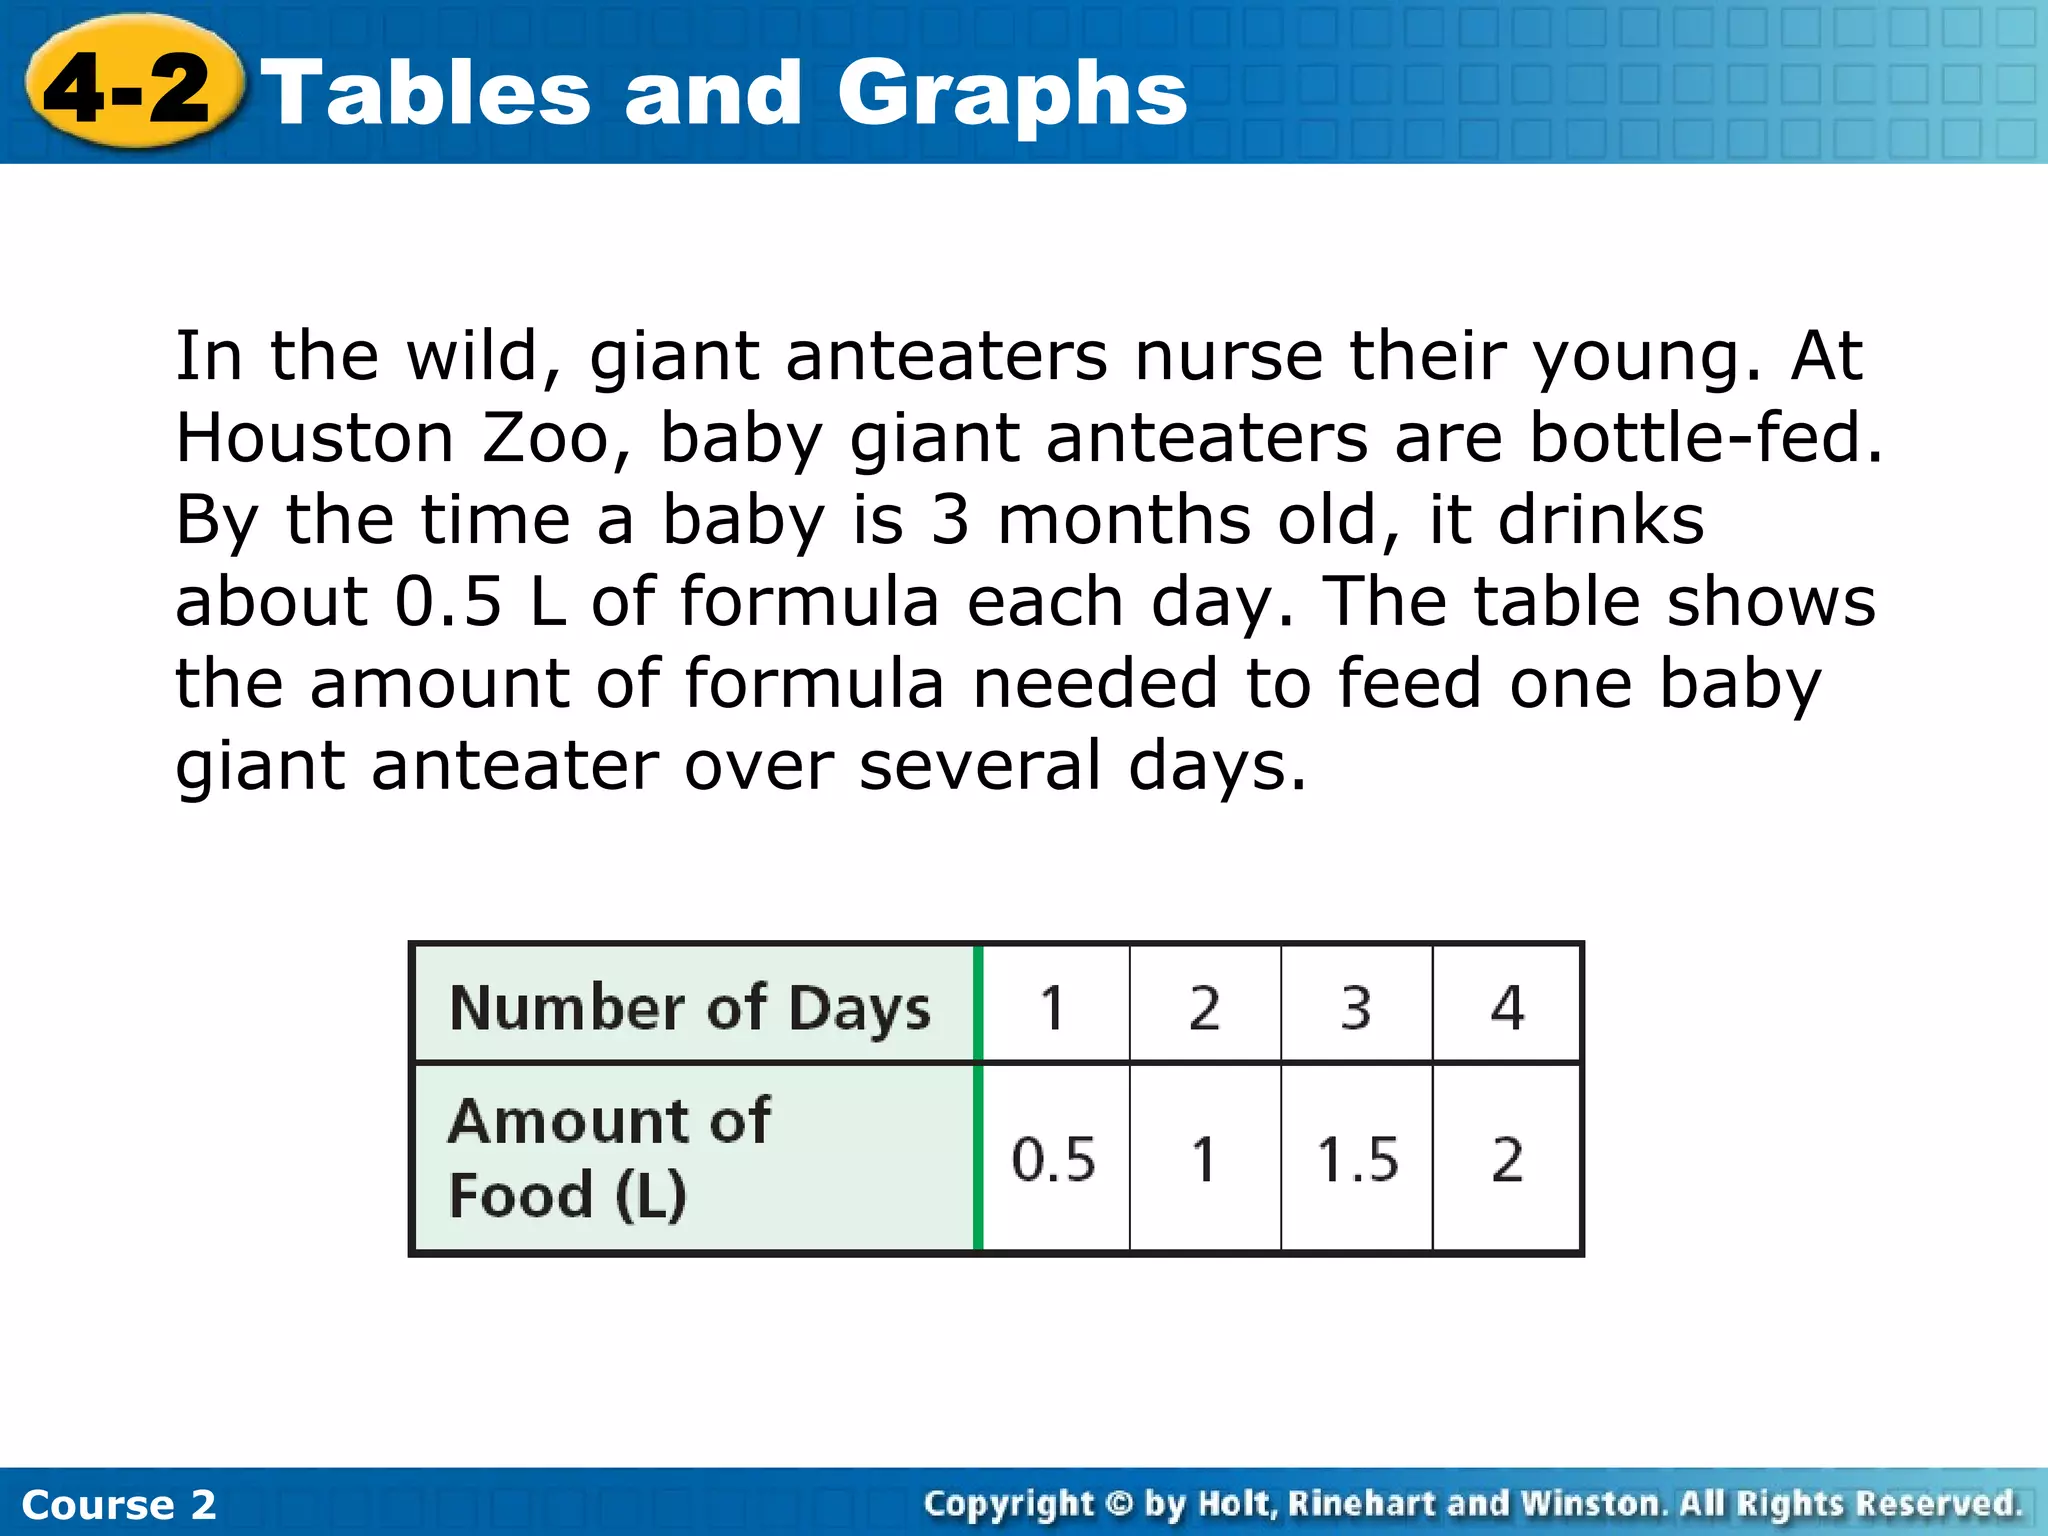
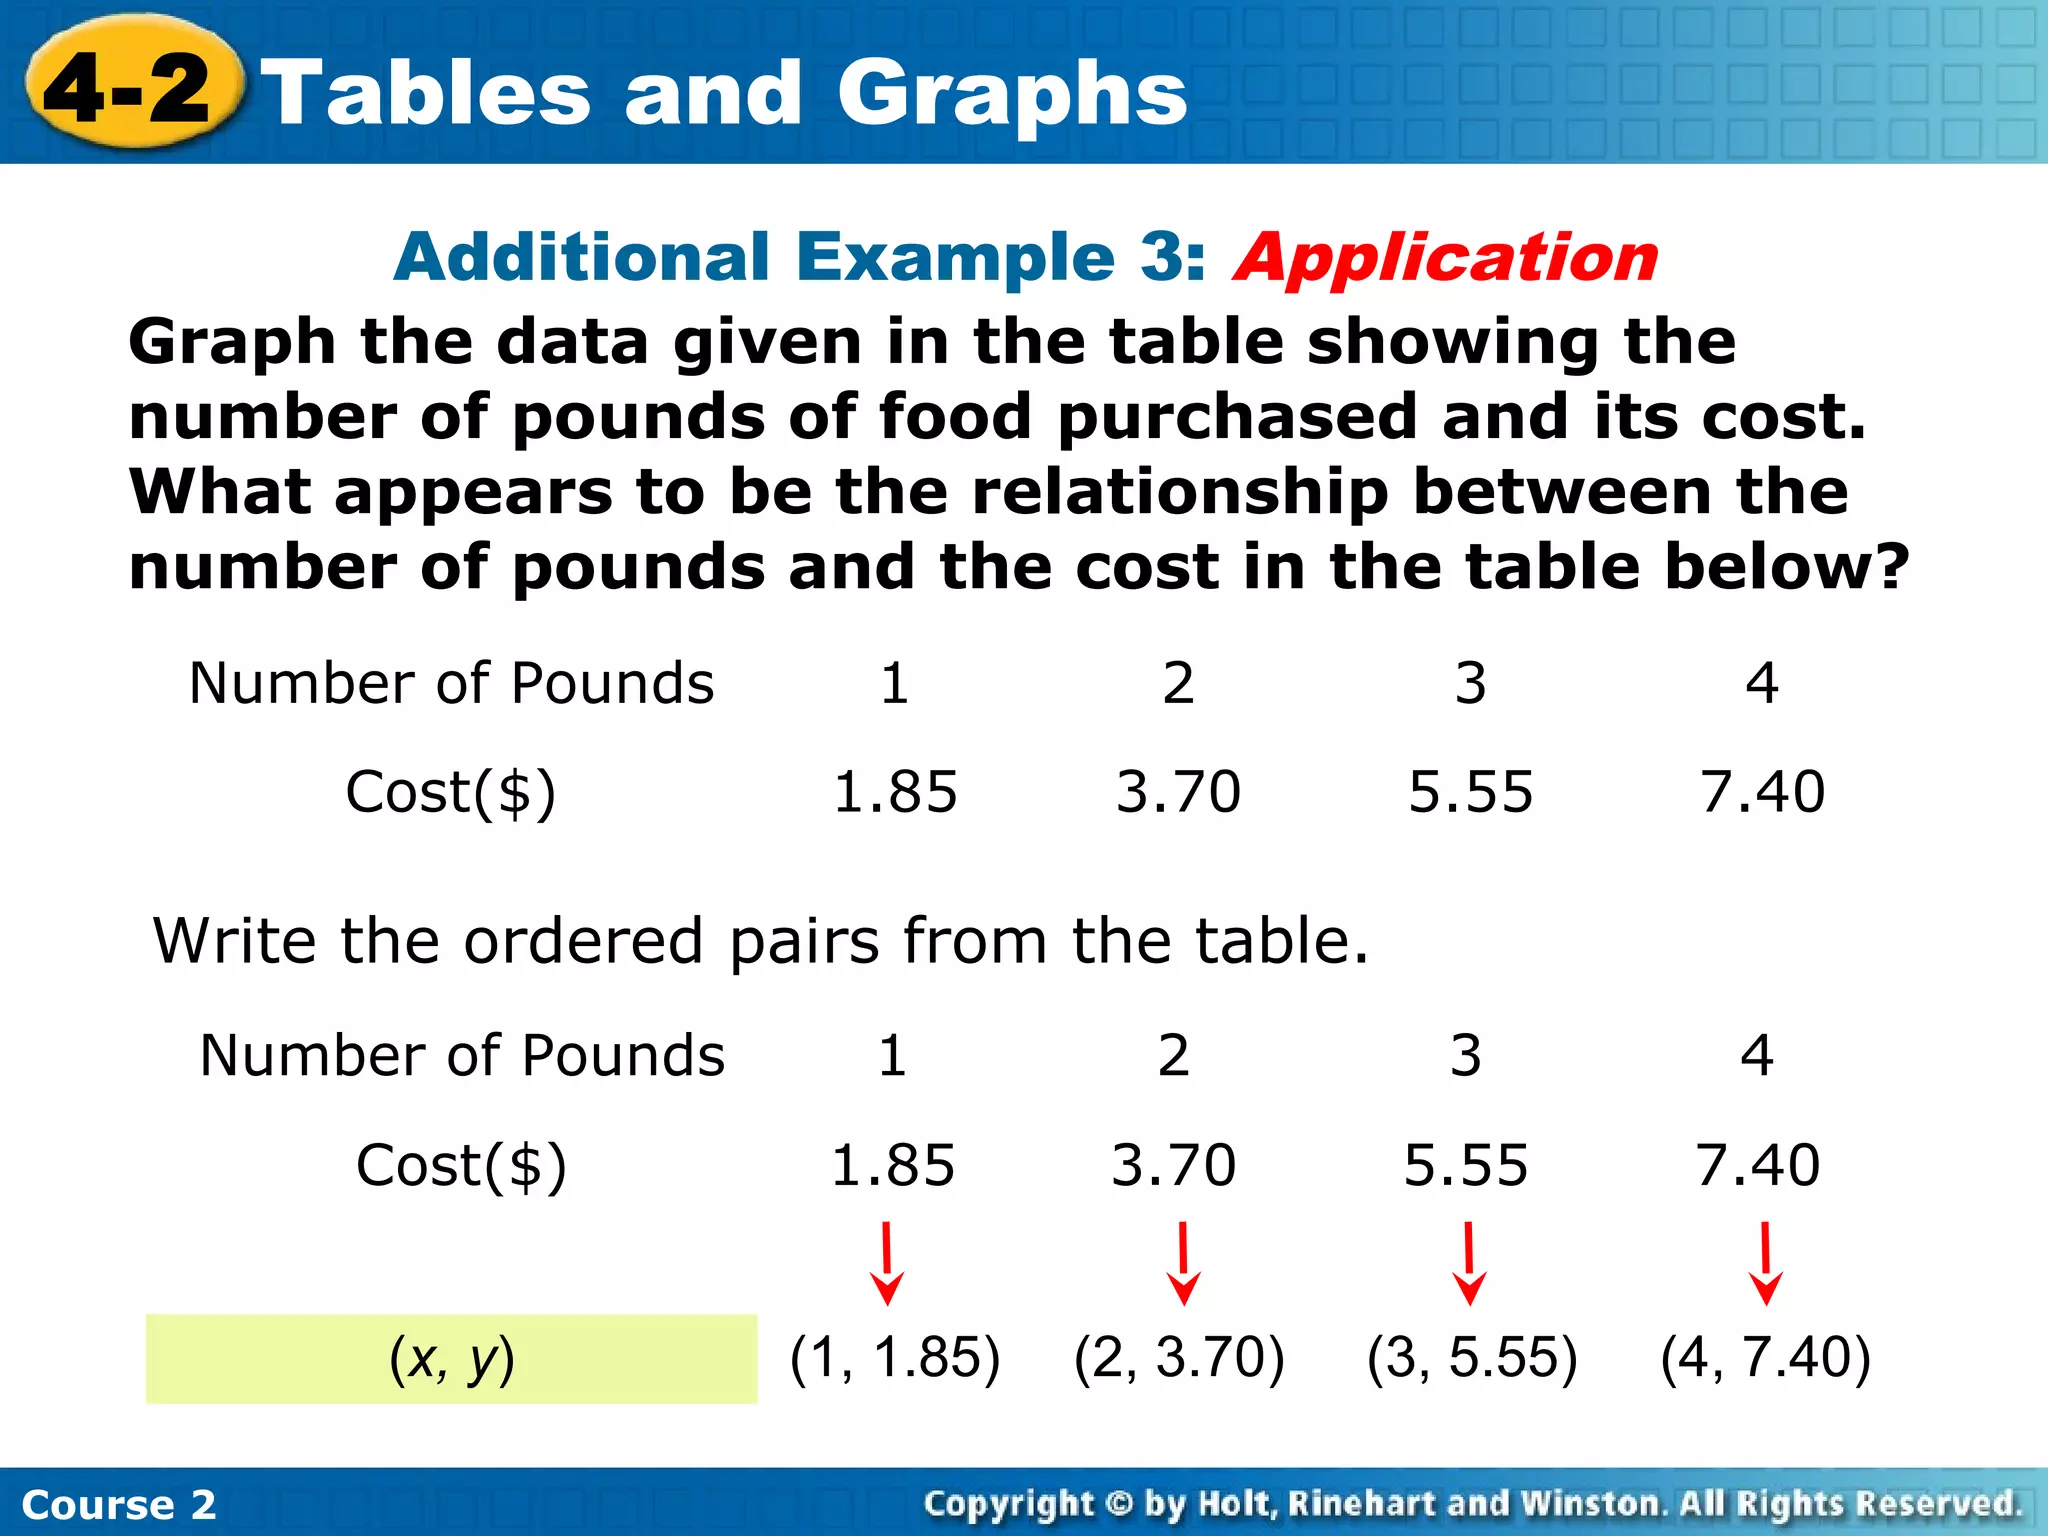
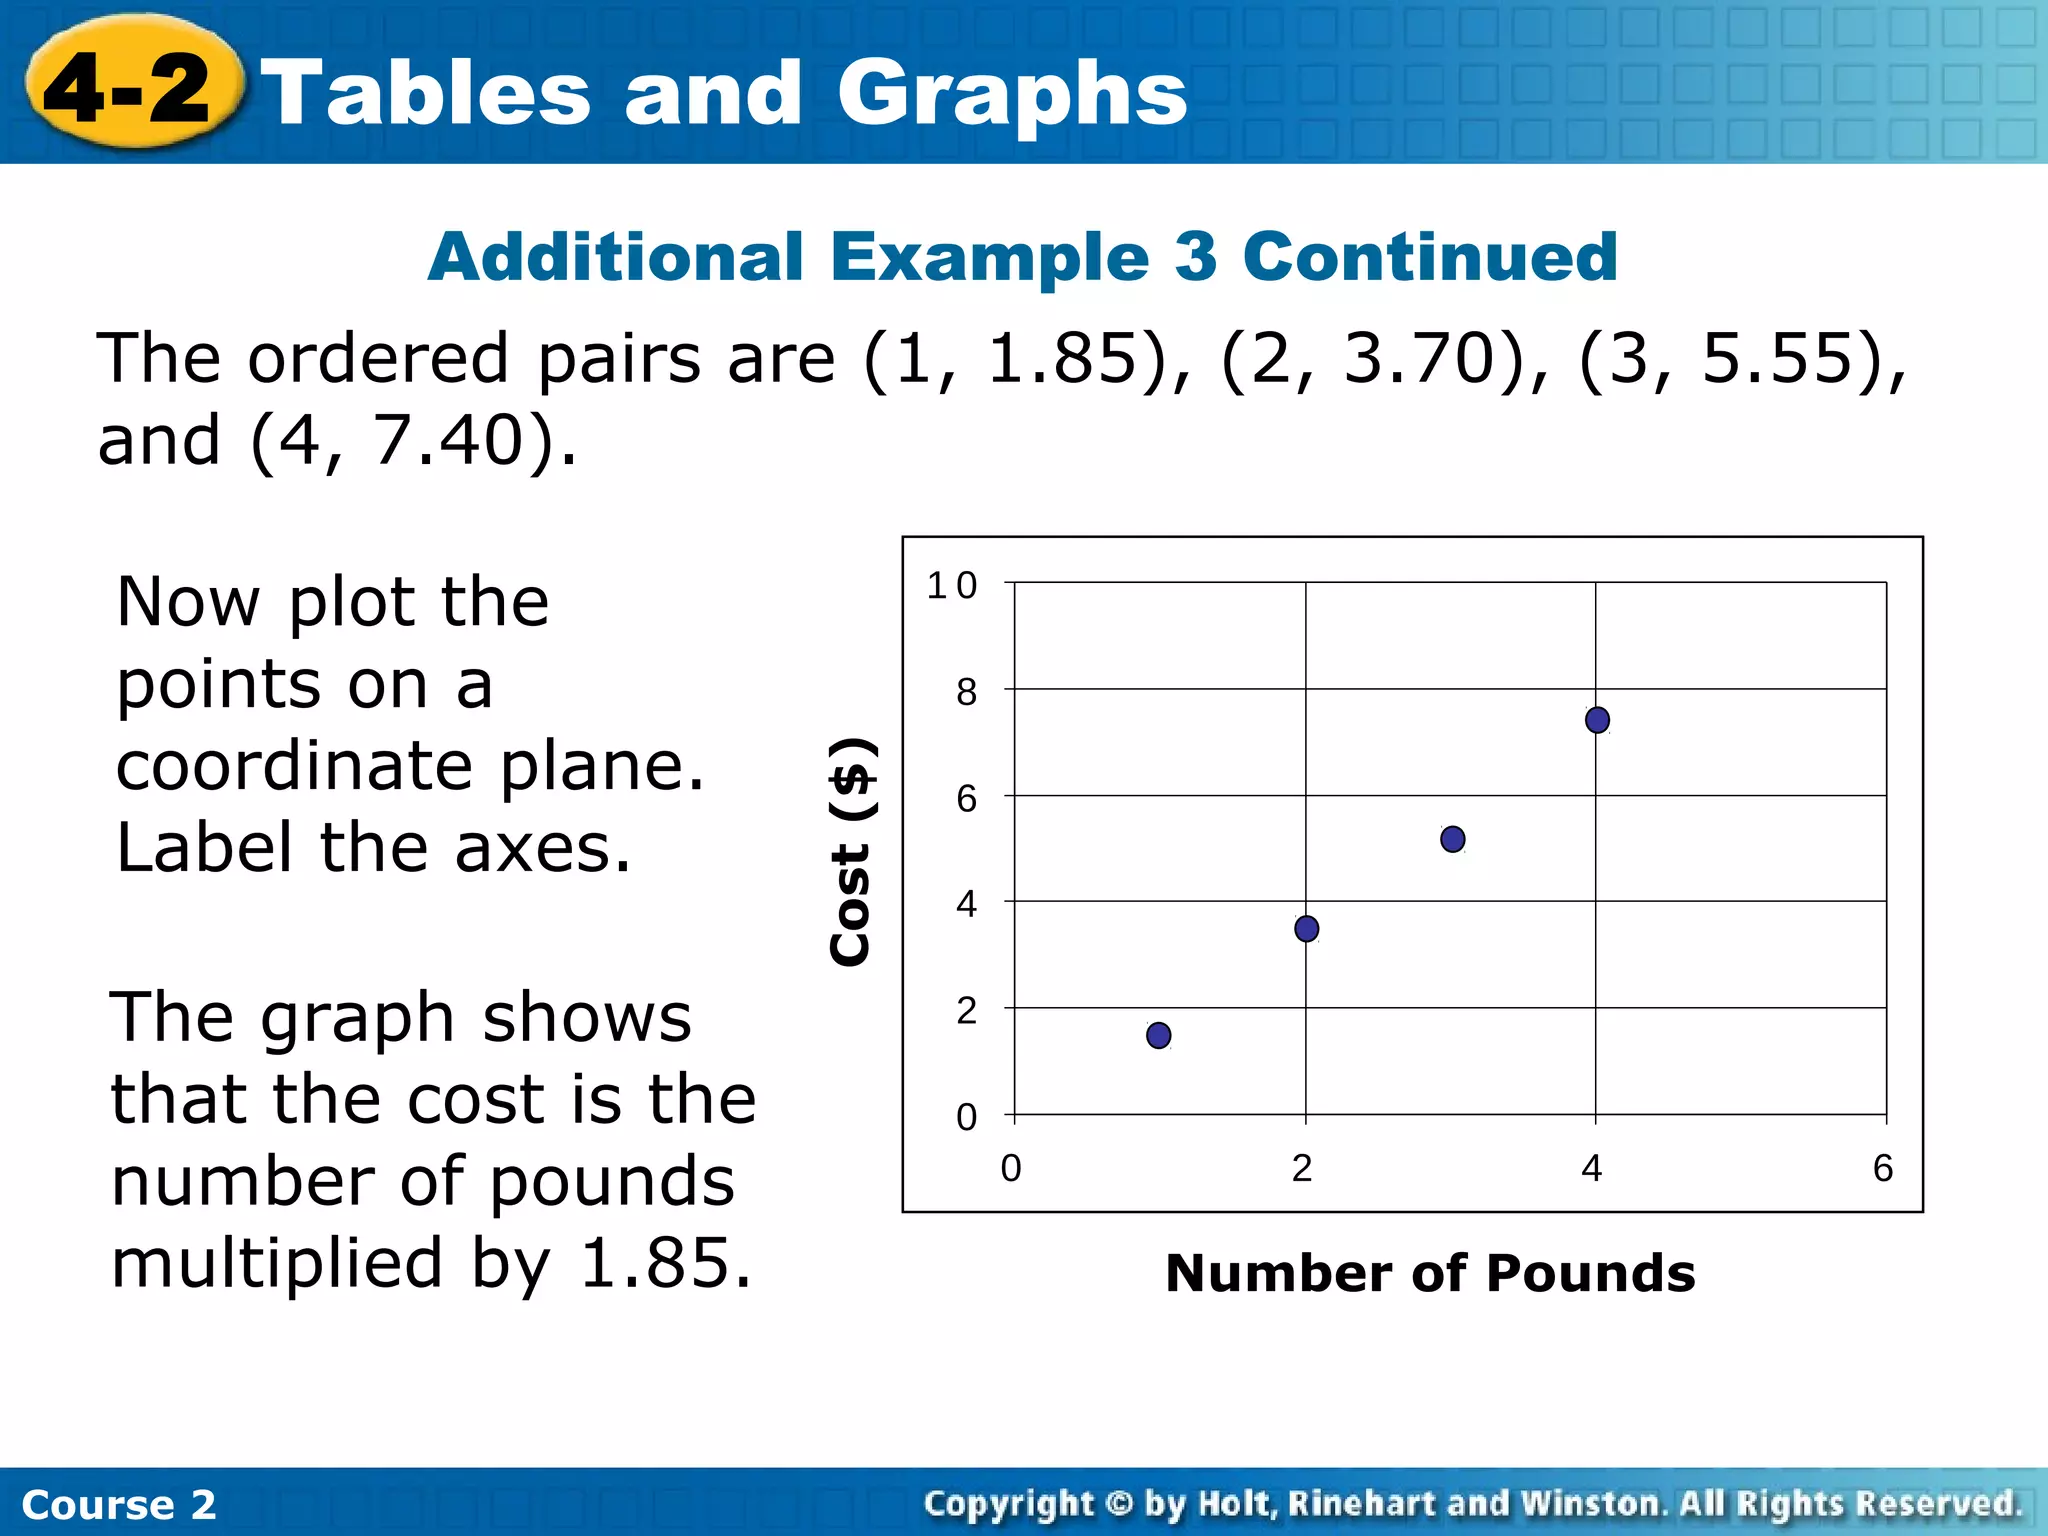
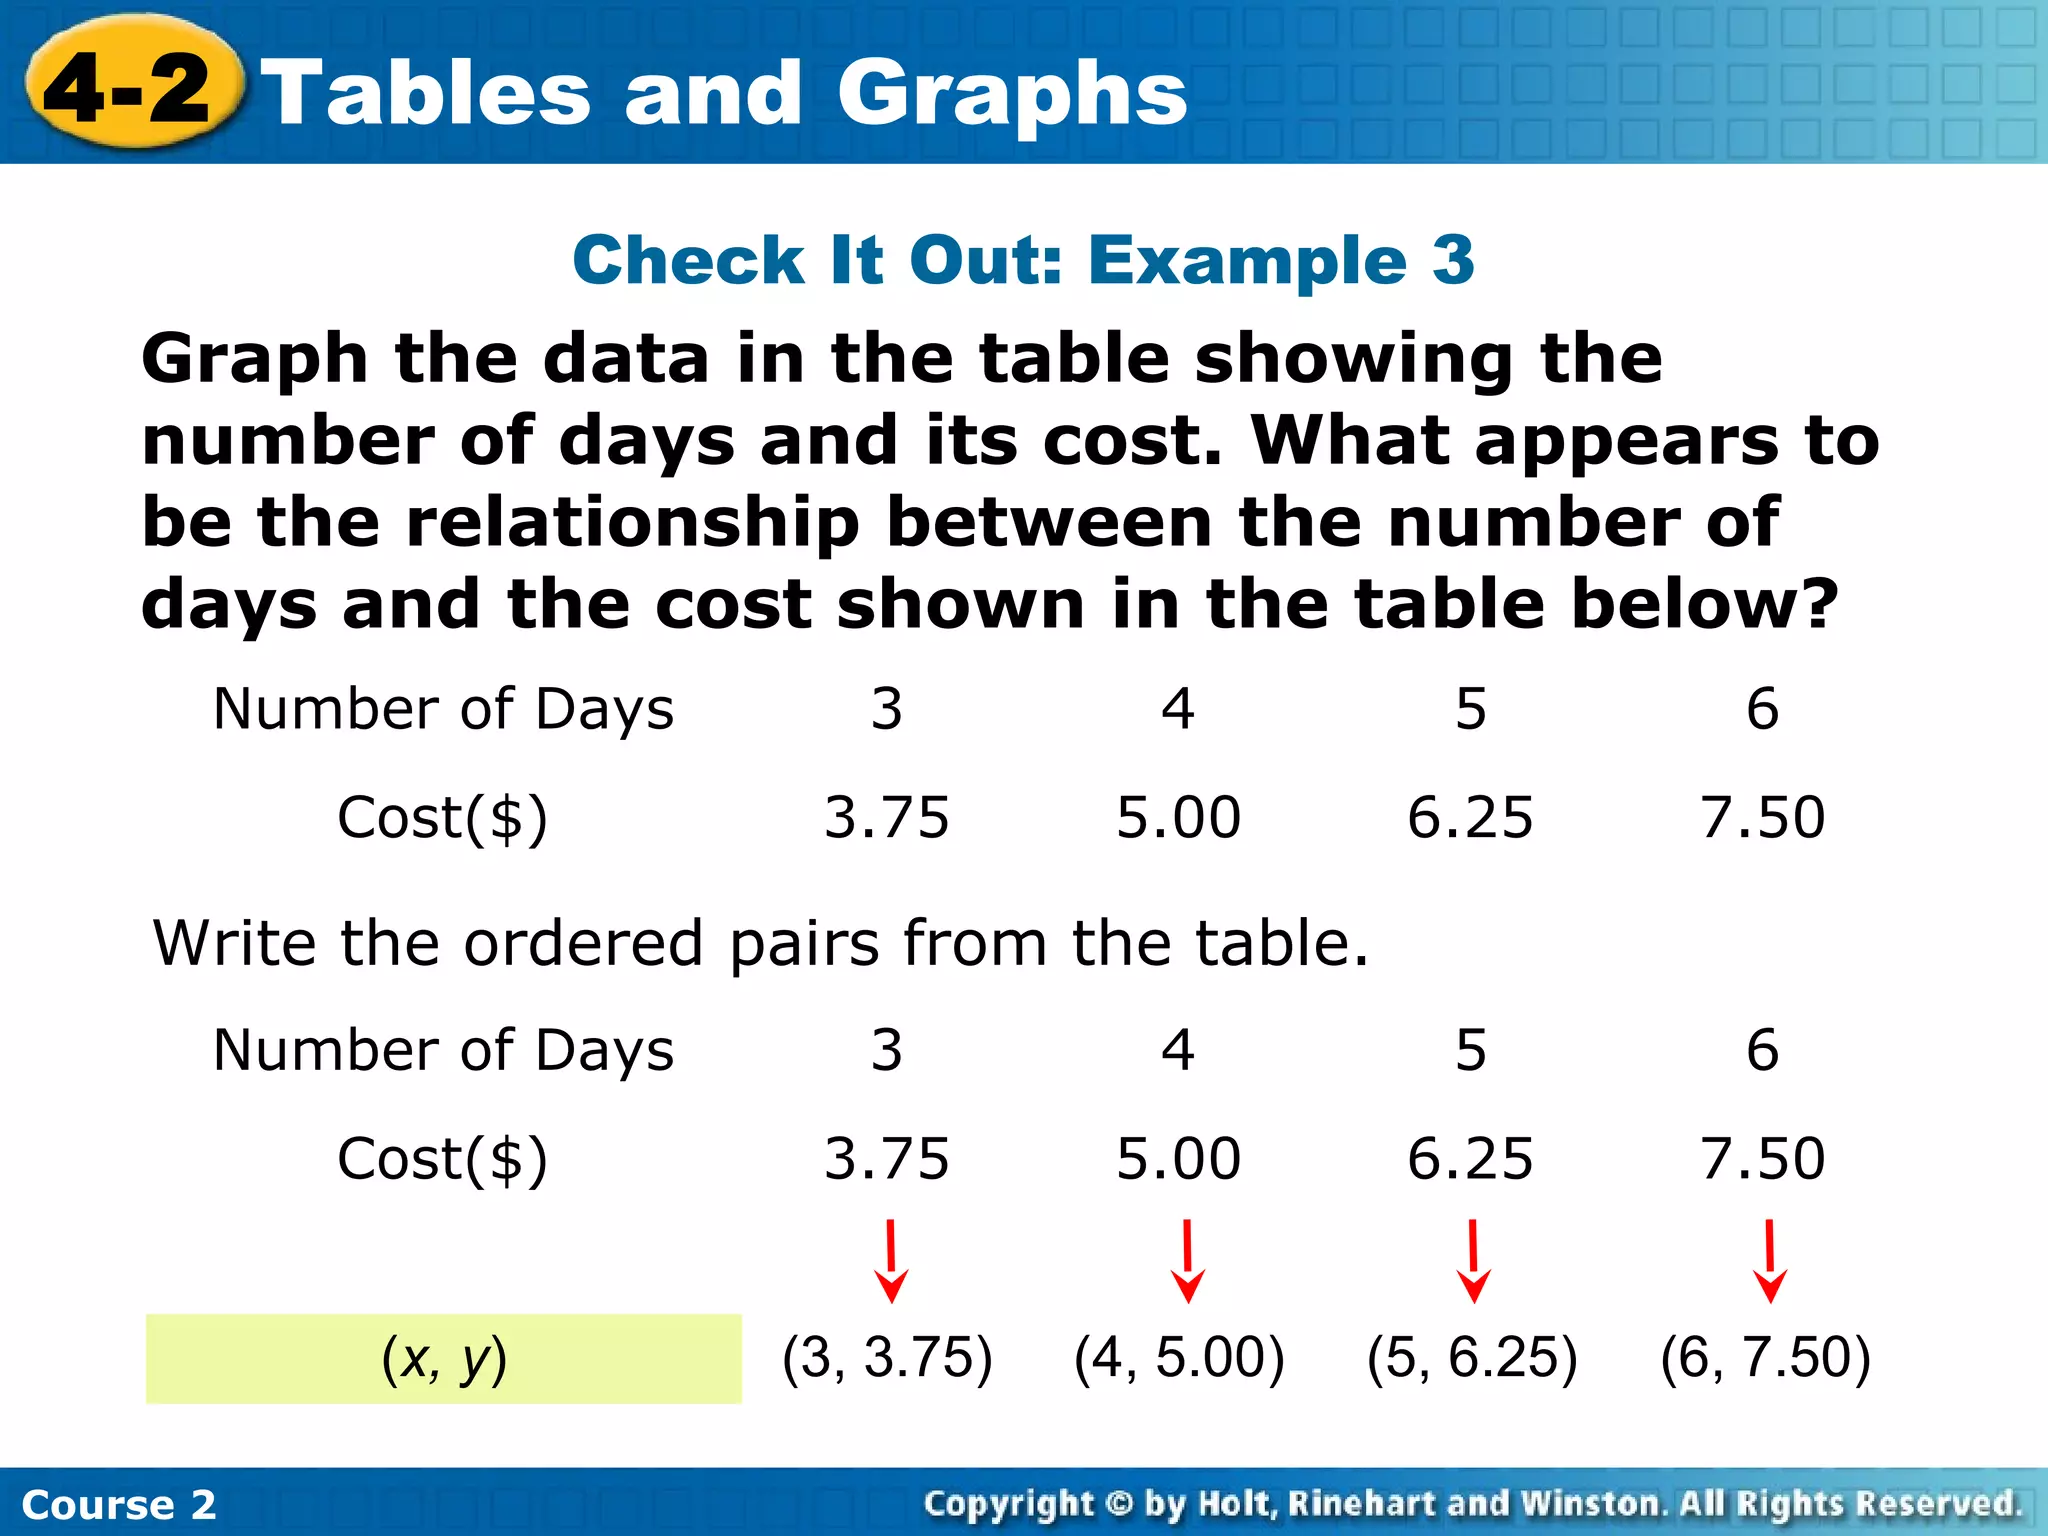
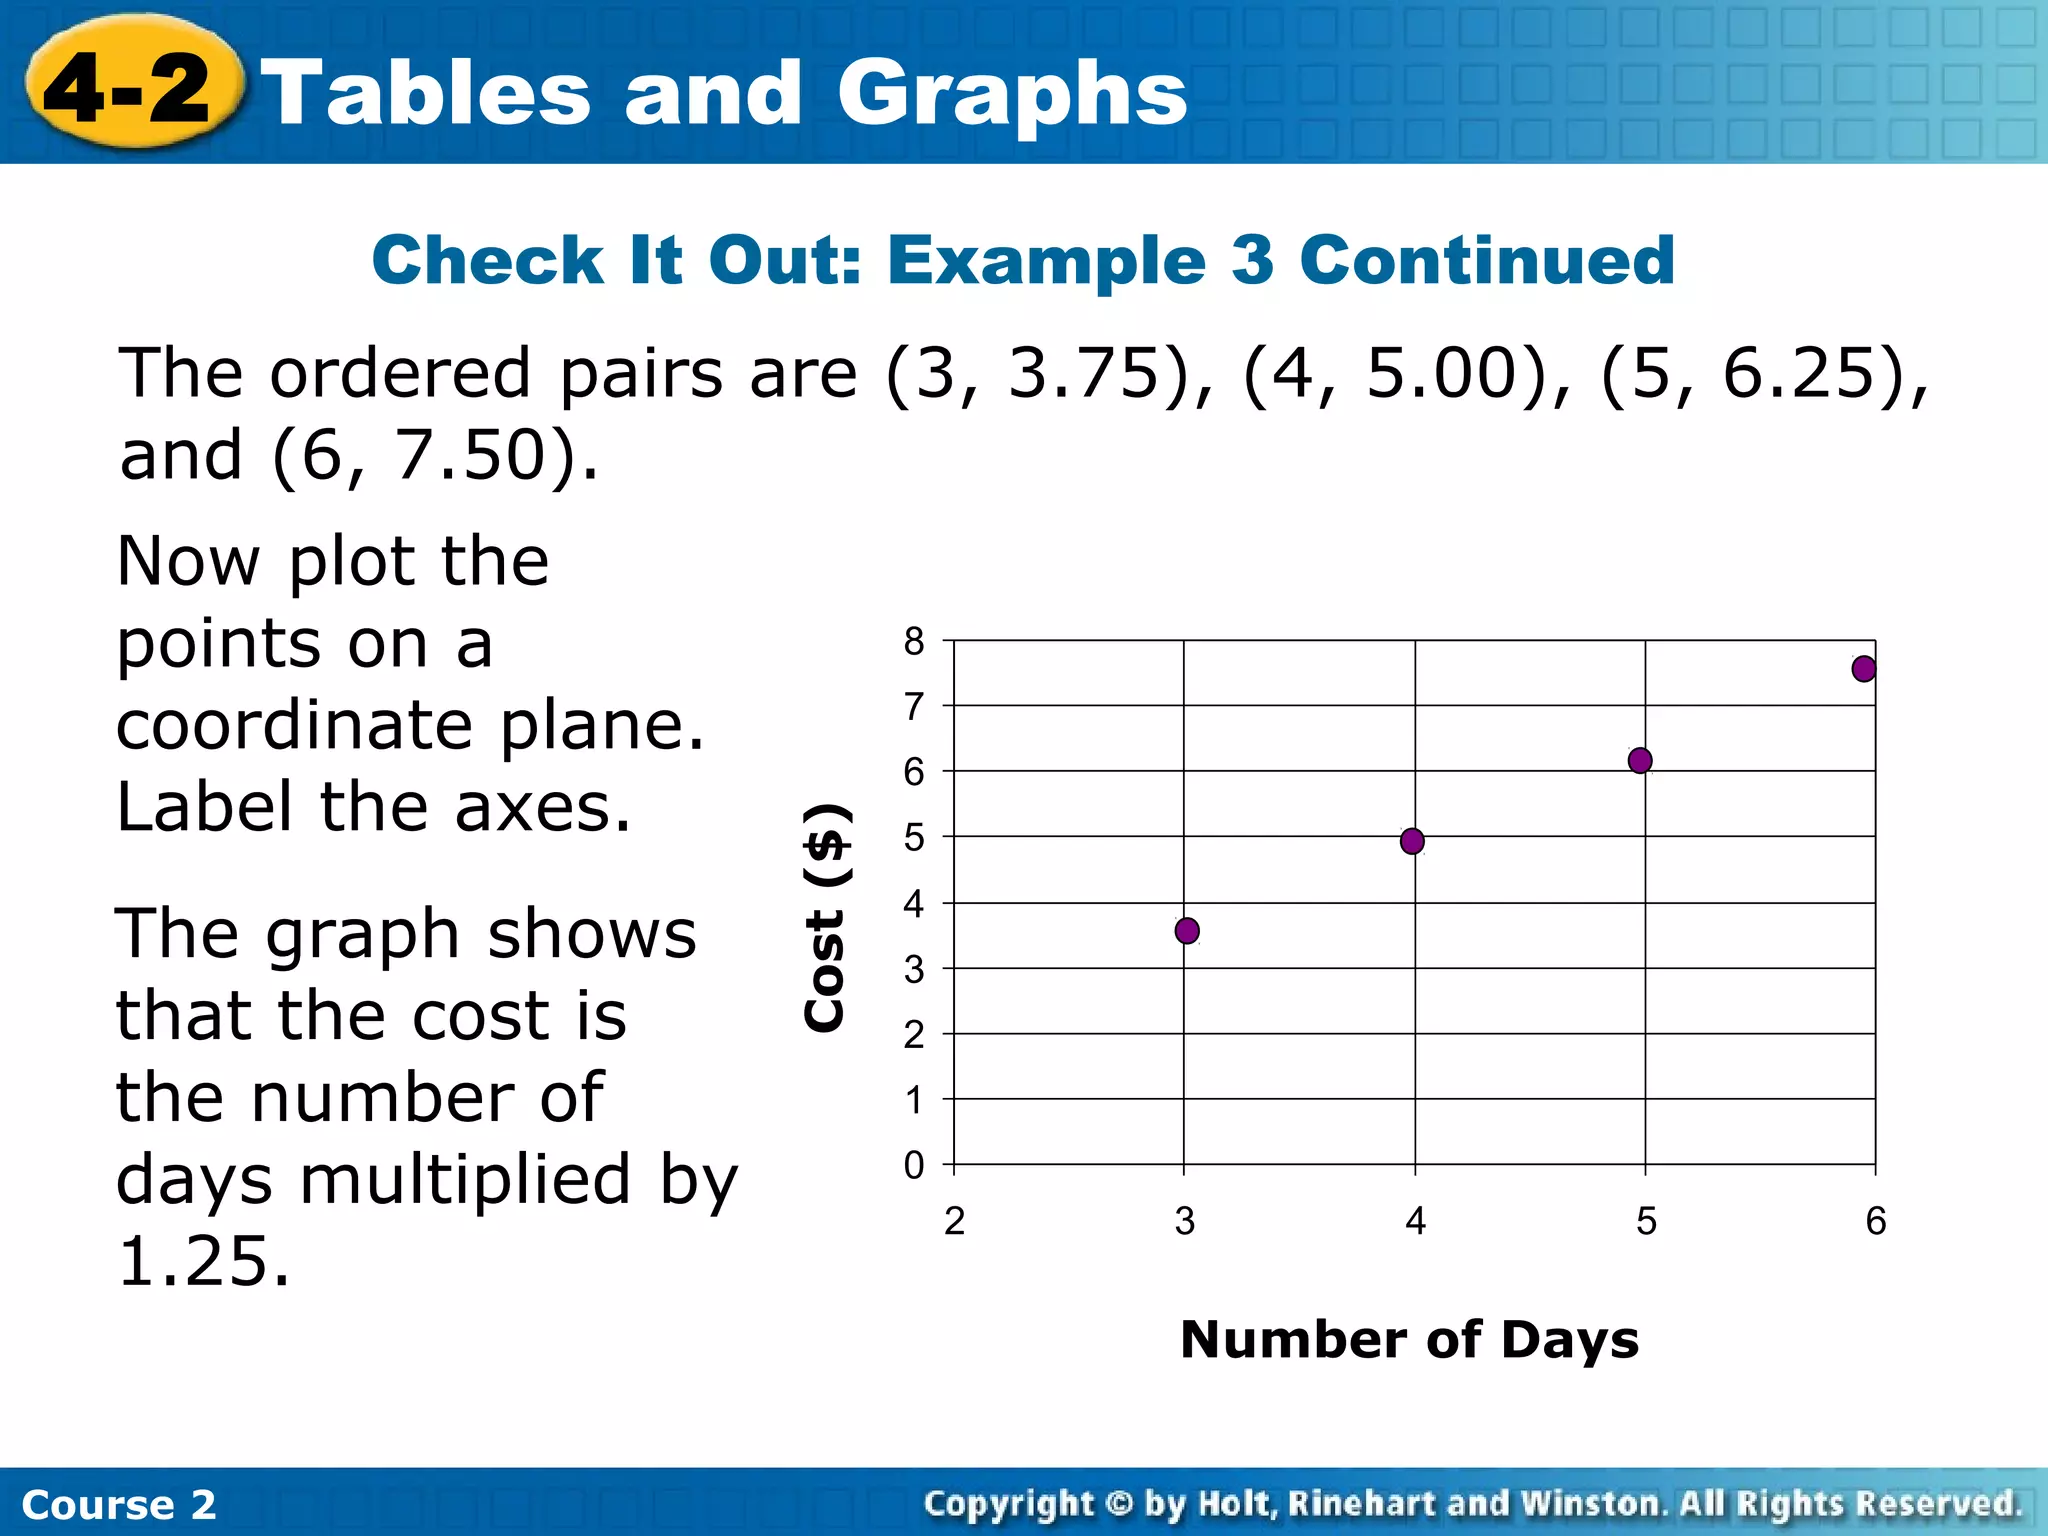
- An example application showing pounds of food purchased and its cost, with the relationship that cost is pounds multiplied by a rate.
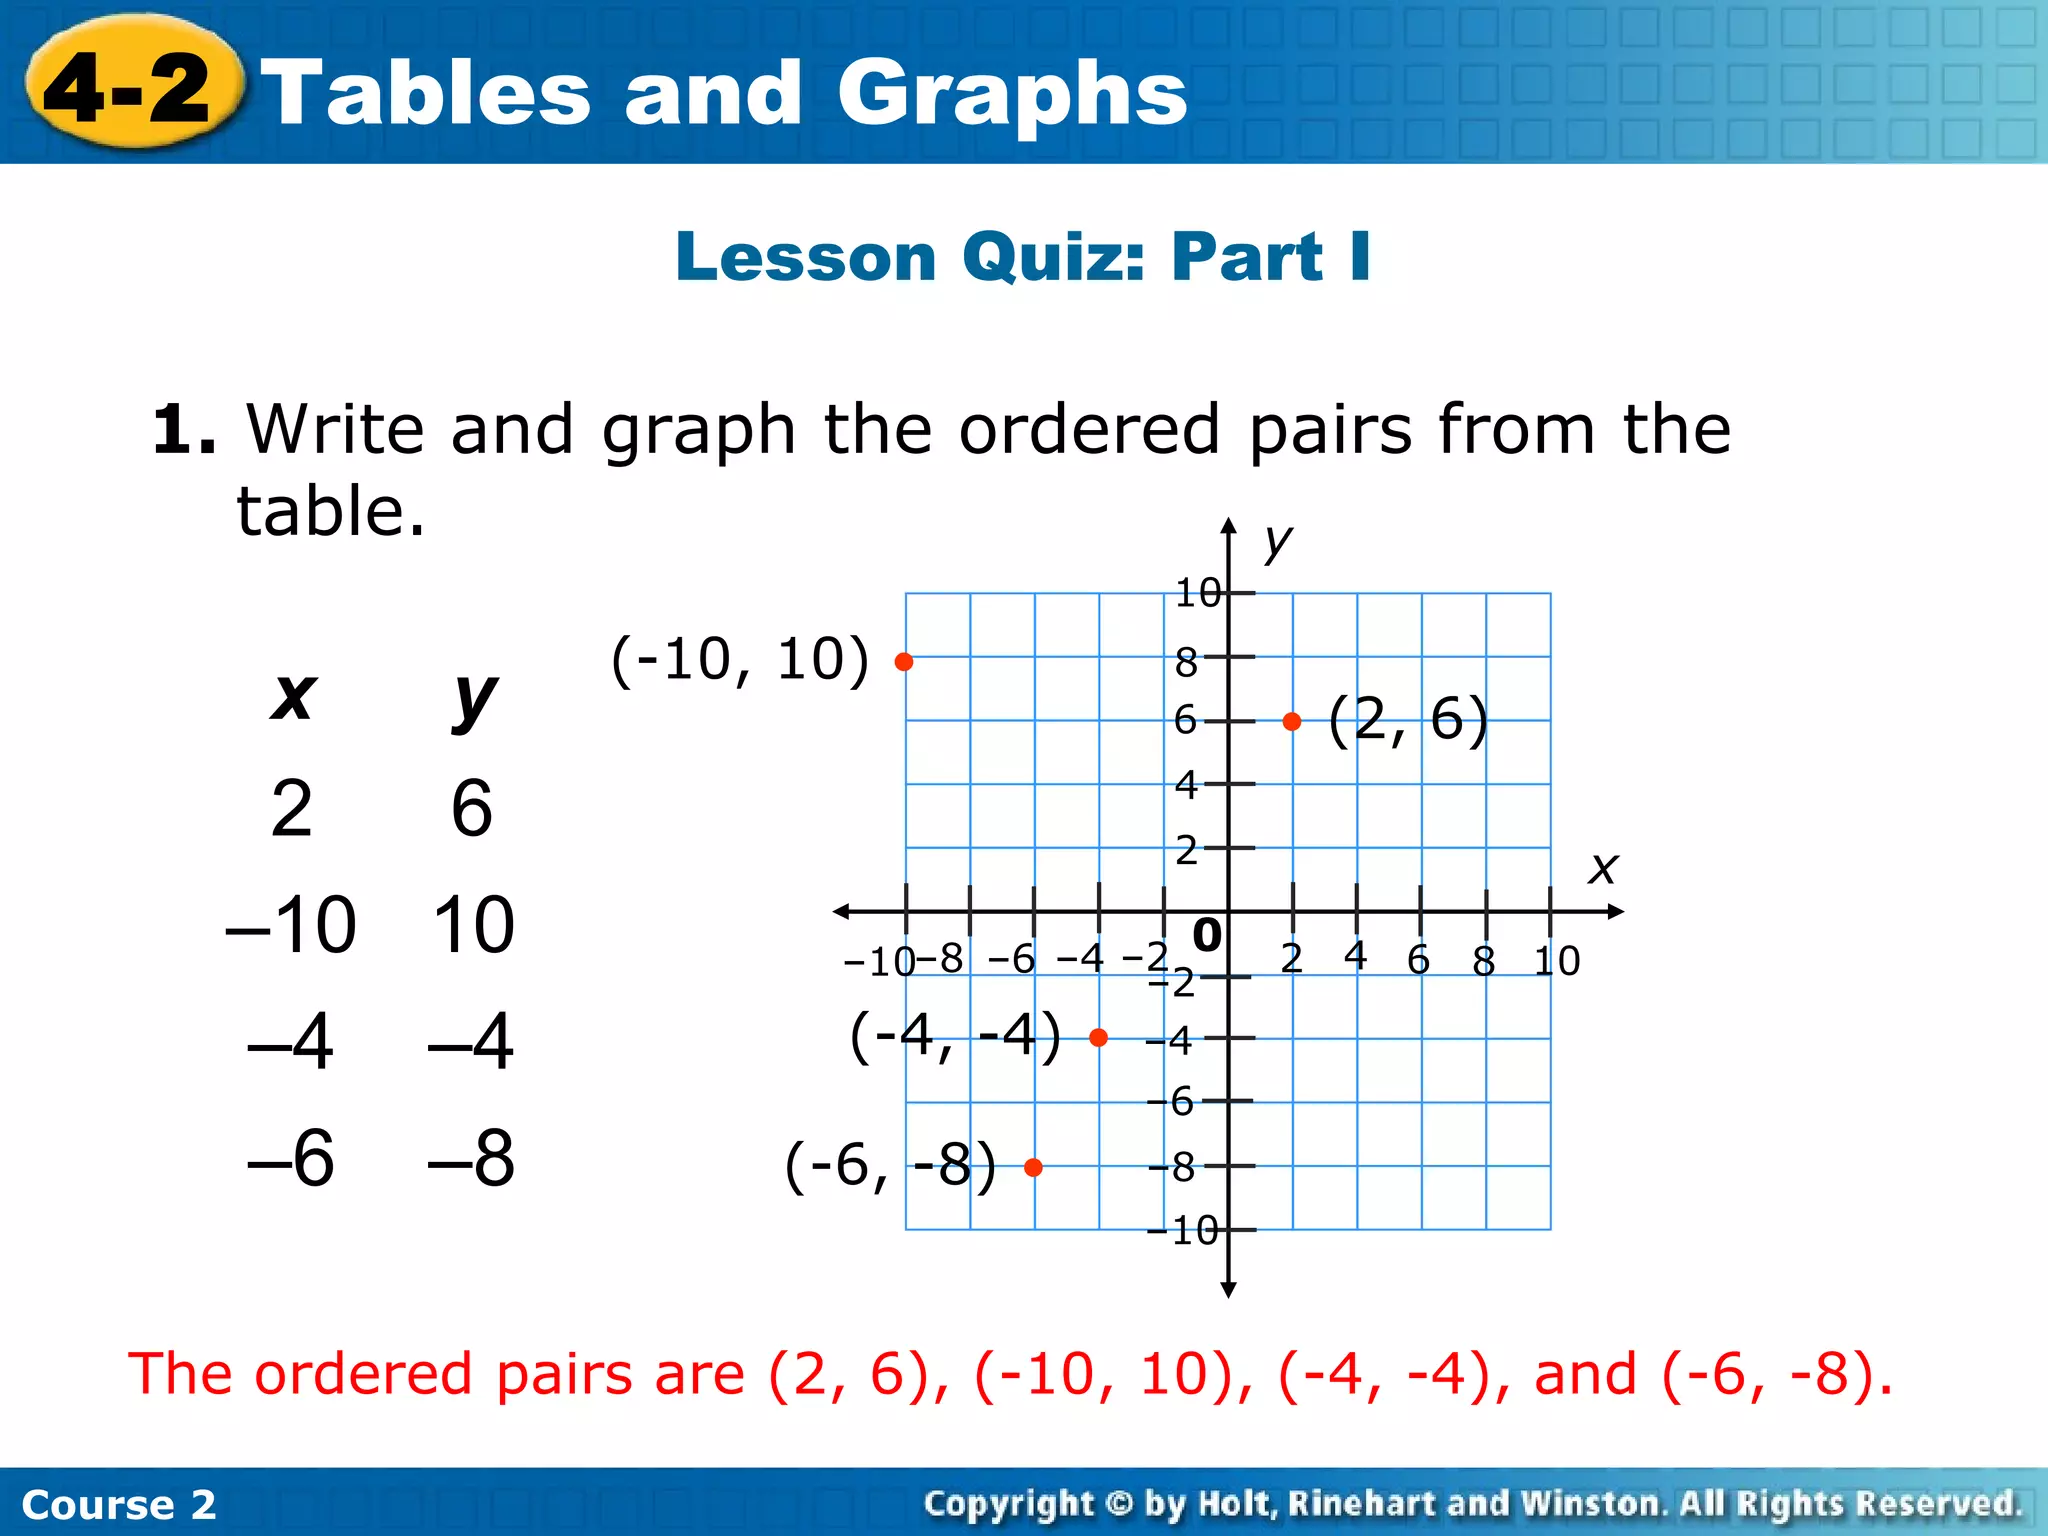
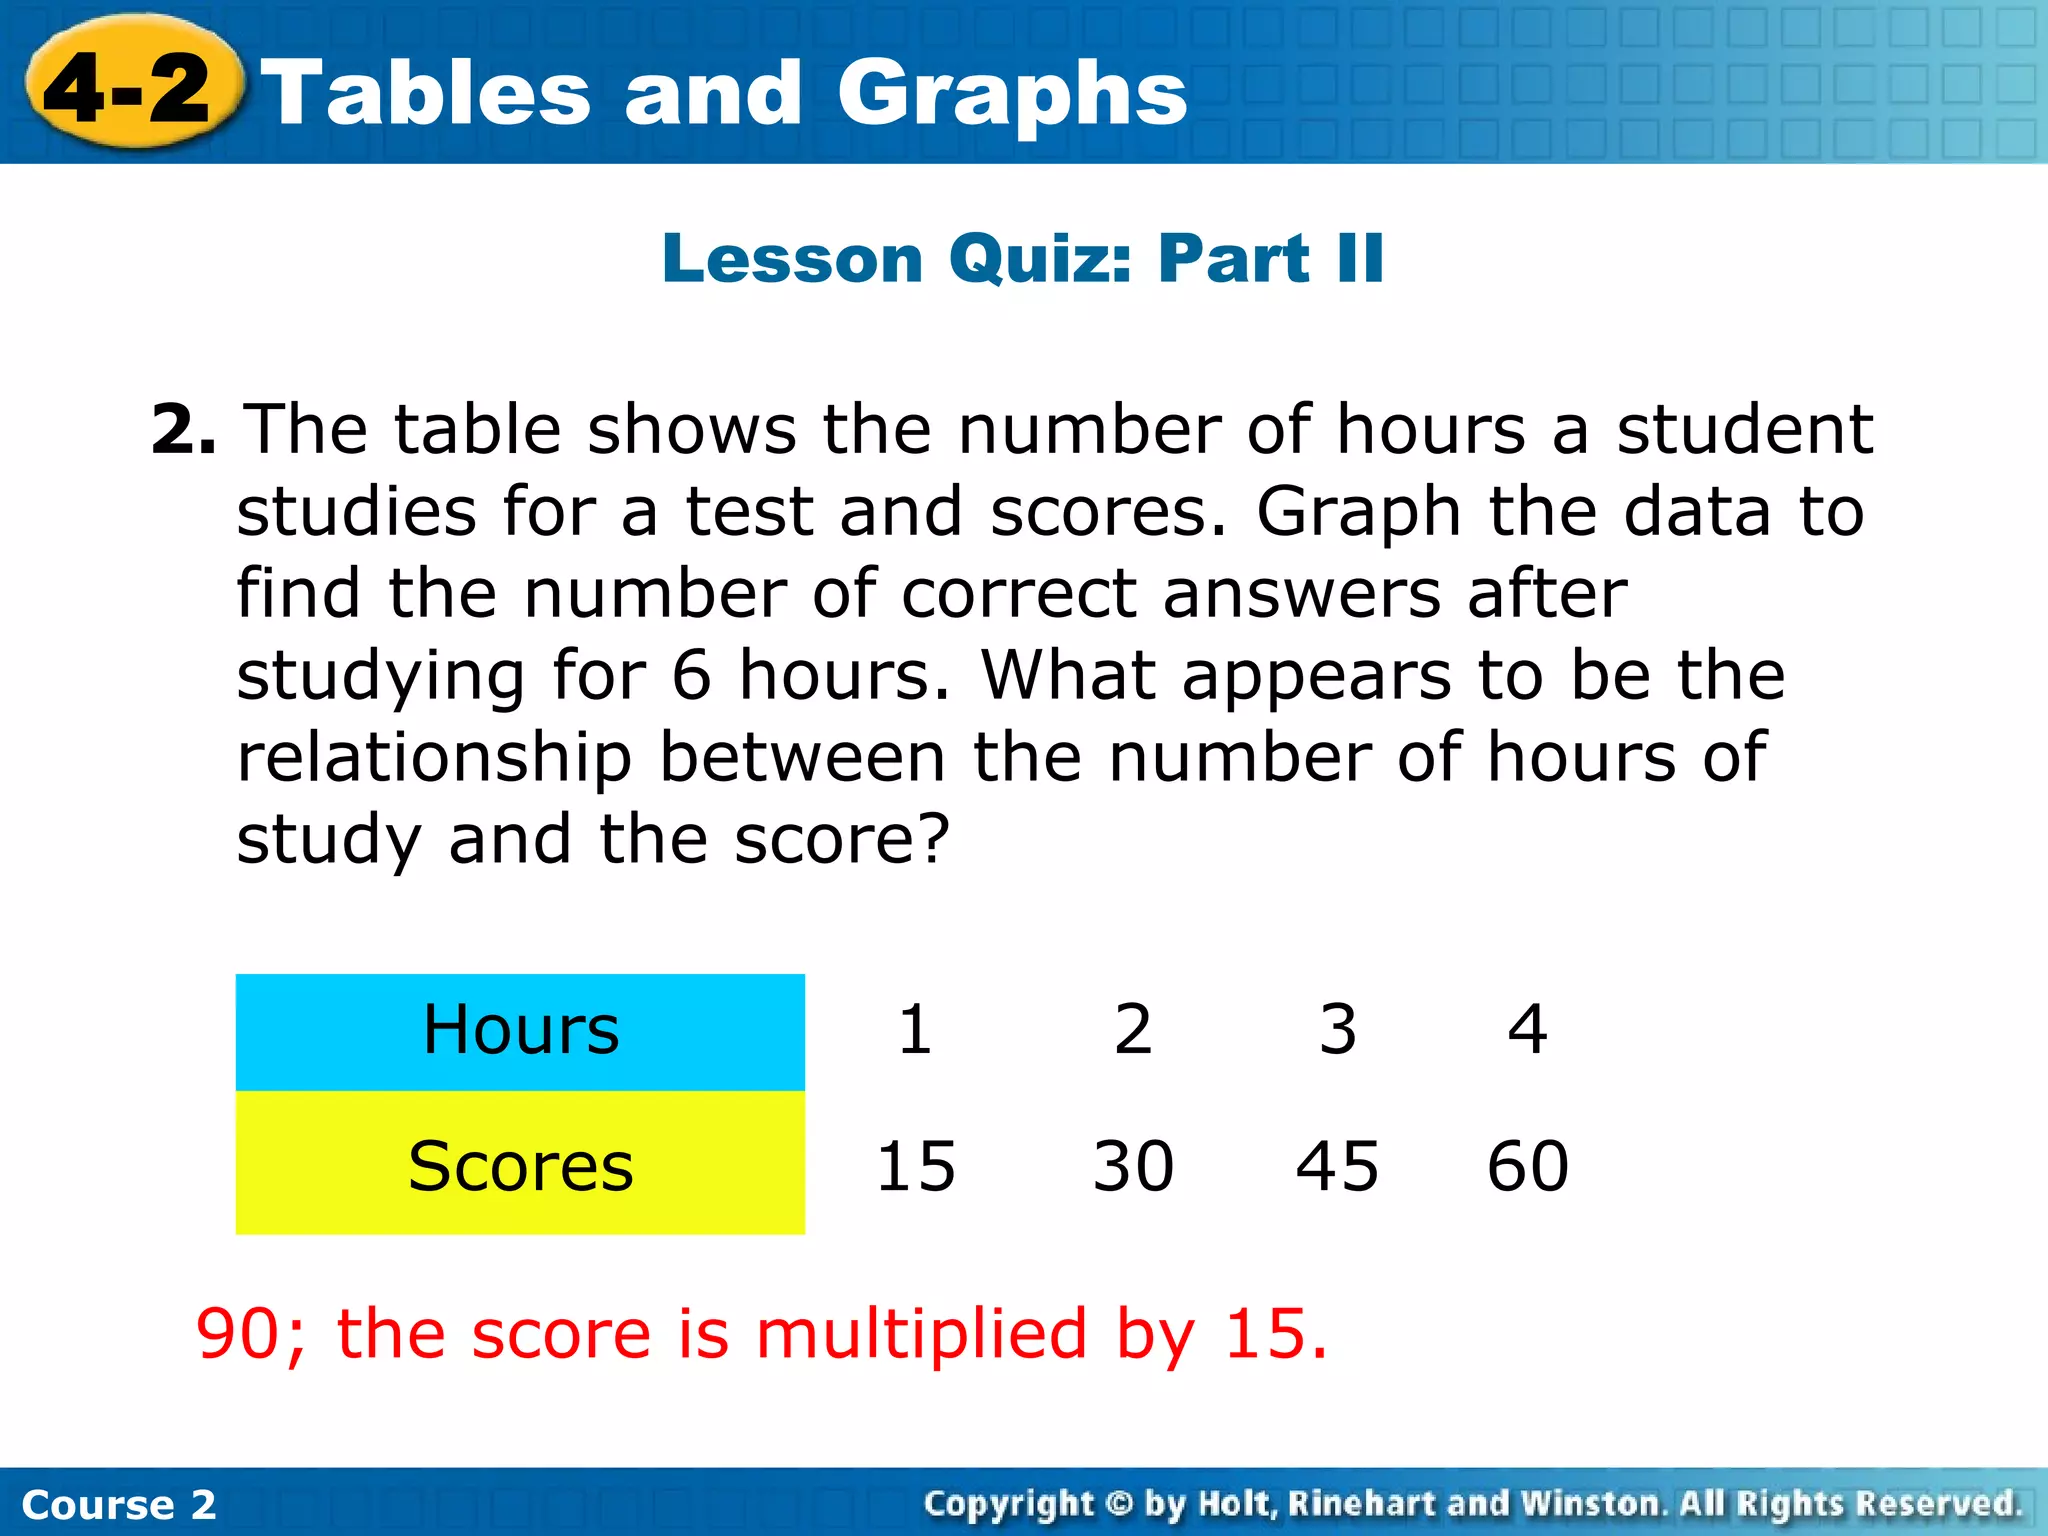
- A lesson quiz testing the skills of writing ordered pairs from a table and graphing the points.