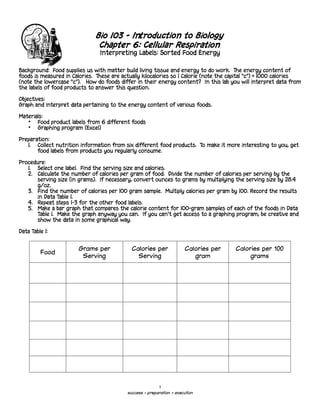
This document provides instructions for a lab on interpreting food energy content from nutrition labels. Students will collect 6 food labels, calculate calories per gram and calories per 100 grams for each food, record the results in a data table, and create a bar graph comparing calories per 100 grams for each food. The objectives are to graph and interpret data on the energy content of various foods. Analysis questions ask students to identify foods with the most/fewest calories, why standardizing to the same sample size is helpful, why calories are listed by serving size rather than 100 grams, and how to use calorie information.


![C08 Mitosis[1]](https://cdn.slidesharecdn.com/ss_thumbnails/c08-mitosis1-091010152504-phpapp02-thumbnail.jpg?width=640&height=640&fit=bounds)
![C07 Chromatography[1]](https://cdn.slidesharecdn.com/ss_thumbnails/c07-chromatography1-091010152515-phpapp01-thumbnail.jpg?width=640&height=640&fit=bounds)


