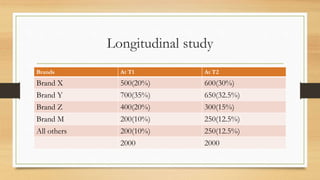
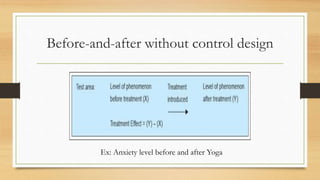
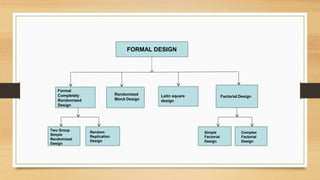
The document outlines a comprehensive business research design plan, detailing various types of research designs including exploratory, descriptive, and causal research. It emphasizes the importance of conducting literature reviews to identify research gaps, with a structured five-step process for effective execution. Additionally, it covers experimental research designs, hypothesis development, and statistical methods for analyzing research data.


![Literature
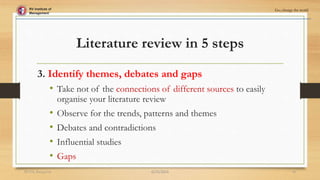
Author, Year &
Area
Title Methodology Sampling Variables Findings
Sohail Khan
(1996)
KURDISTAN,
IRAQ*
The impact of
staff training
and
development on
teachers’
research
productivity
Structured
Questionnaire 58 teachers
Expertise, Morale, Skill,
competency of
supervisors, trust
T&D to have profound
influence on teachers’
productivity, therefore
teachers need to be regularly
motivated for training
programs in to enhance their
productivity.
Morgan, Clauset
(1999)
USA*
Research
Productivity,
prominence,
and the effects
of academic
environment
Matched-pairs
experimental design
using a Survey
2,453 early-
career faculty at
all 205 PhD-
granting CSE
departments.
Work environment,
training, scholarly
impact,
Characteristics of a work
environment are more
predictive of faculty
productivity than preferential
selection or retention
Shaker, Plater
(GEORGIA
UNIVERSITY*
(2001)
The Public
Good,
Productivity
and Faculty
Work:
Individual
Effort and
Social Value
Delphi technique Secondary data
analysis
Rubrics, Service, ISR,
Societal Impact,
community service,
positive attitude.
Credentials without quality
and teaching without public
purpose lead inevitably to
the decline of American
higher education
Michael M.
Rawls (2002)
TEXAS* PUBLIC
INSTITUTES
Assessing
Research
Productivity
from an
Institutional
Effectiveness
Perspective.
Quantitative &
Qualitative Designs
–Questionnaire
62 Institutions
Priority for research,
research assistants,
collective research
goals of department,
peer productivity
Core facilities appear to be
insufficient in terms of
capacity to meet demand
and are operated without an
adequate staffing model to
provide the expertise
needed
Mariom,
McMorther
(2012)
VIRGINIA*
Understanding
the productivity
of faculty
members in
higher
education
Descriptive case
study design
293 full time
employees
[department of
biomedical
engineering]
Time, self
advancement,
reporting, workloads,
financial inducements
Administrators must look at
workload expectations for
faculty and create policies to
help manage their time
6/25/2024
RVIM, Bangalore 16](https://image.slidesharecdn.com/rm22-240625034633-9f4d72a5/85/Business-research-methods-and-sampling-method-16-320.jpg)