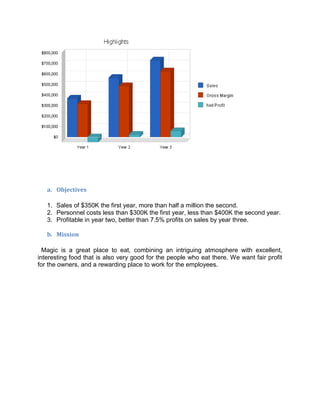
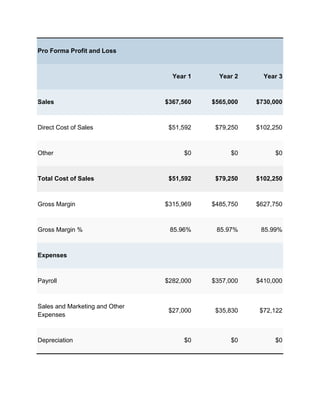
Magic is a new restaurant in Portland focusing on organic, ethnic cuisine. It aims to target four customer segments: lonely rich tech workers, young couples, rich hippies interested in organic food, and dieting women. The plan is to achieve over $350k in sales in year one, be profitable by year two, and reach over 7.5% profits on sales by year three. Magic will succeed by offering great food and an environment that attracts trendy customers through its emphasis on organic ingredients, ethnic recipes, and interior decor reflecting global influences.
This is a seminar project regarding the opening of a new restaurant and what style and information the start-up's presentation should look into for attracting investors' interest.
Foodies fries: A Business presentation on a fictitious food chain.Altaf Keshwani
Business Presentation on a Fast food company which includes:
Executive summary
Objectives
Key to success
Mission
Company summary
Company Ownership
Product description
Competitive comparison
Market analysis summary
Target market segment summary
Marketing Strategy
Personal plan
Financial plan
Projected Profit/Loss
Estimations in the project are just on assumption basis.
The major objective of this presentation is to show how to make a Business presentation.
How to do Papa John's SWOT Analysis? Strengths, Weaknesses, Opportunities and...SWOT & PESTLE.com
Check out our latest publication on Papa John's which is an American pizza restaurant franchise founded by John Schnatter. It is the fourth largest pizza delivery restaurant chain in the United States, and is headquartered in Jeffersontown, Kentucky, a suburb of Louisville.
Check out the SWOT and PESTLE analysis on Papa John's- https://www.swotandpestle.com/papa-johns/
The analysis covers the business strategy of Papa John's.
We appreciate Sushree Lasyamayee's contribution towards this research report.
Follow us @swotandpestle to know more and visit our website - https://www.swotandpestle.com/
NEED HELP WITH YOUR RESEARCH?
Apart from SWOT and PESTLE analysis we also do Value chain analysis, Porter's five forces, BCG Analysis, Segment-Target and Positioning Analysis and other models and analyses to suit customised needs. Place your inquiry here
https://www.swotandpestle.com/solutions/
#PapaJohnsPizza #SWOTAnalysisPapaJohns #PESTLEAnalysisPapaJohns #MarketResearchPapaJohns #CustomisedResearchPapaJohns #StrategyPapaJohns #BusinessCasestudyPapaJohns #BusinessStrategyPapaJohns
#SWOTandPESTLEPapaJohns #SWOT #PESTLE #ConsultingPapaJohns
Raising money for Masters Grill, Sports Bar, Live Music and get great perks like food discounts, guaranteed tables, and previews of new menu items. Foodstart is the only crowdfunding site created just for restaurants, breweries, cafes, food trucks, and other food business.
Dining out these days is more casual than the earlier times where it was treated as a luxury or as a habit of the rich people. It’s very casual to eat outside more than once a month or most probably more than once a week.
Before you start writing your food cafe business plan, spend as much time as you can to reading through some samples of food and restaurant business plans. Not only will that give you a good idea of what it is you’re aiming for, but it will also show you the different sections that different entrepreneurs include and the language they use to write about themselves and their future plans.
We have created a sample food cafe business plan example for you to get a good idea about how a perfect food cafe business plan should look like and what details you should include in your business plan.
Source: https://upmetrics.co/template/food-cafe-business-plan-example
An article for World Food Day article writing competition arranged by ESA, HSTU.
This is not a master piece, Uploading it here for you, just to get an idea about the topic.
Thank you.
(iCHEFTeam A) (DeVry Inc. MGMT 600 November.docxjoyjonna282
(
iCHEF
Team A
) (
DeVry
Inc.
|
MGMT 600
|
November 24, 2015
)
Industry Review
iCHEF is a convenient service presented to our customer through a mobile APP. We offer an array of Appetizers, Entrees and Desserts. The industry we are embarking on is the Food Service and Catering industry.Examining the food service/ catering industry, we’ve learned that this industry is on the rise. It is an industry that is expected to expand over the next five years. This industry will continue to grow and define its niche by being innovative, offering international cuisines and beverages, and using sustainable locally sourced produce. The industry has received a boost from an improving economy, as consumer spending is expected to rise at an annualized rate of 2.6% during the five years to 2020. Households, which account for over 50.0% of industry demand, are expected to bolster their demand for catering services as consumer conditions improve. Unemployment is forecast to decline over the next five years, while disposable income is expected to moderately grow. As consumer conditions improve, time-poor consumers are also expected to prefer to use catering services, rather than attempt to do it themselves.
Over the next five years, consumers will continue to demand higher-quality food, better food presentation and a wider menu selection with healthier alternatives. Many customers will also begin to seek out caterers that use organic and locally sourced foods. Menus will need to more thoroughly describe items, by methods such as listing ingredients, where they came from and how they were prepared. These new demands may force some operators to increase their purchase expenses, or choose to vertically integrate by owning and operating their own farms. Consumers will also demand more value-added services, such as decorations, floral arrangements and entertainment. Overall, the number of industry enterprises is anticipated to increase 1.2% per year on average to 11,320 households and businesses.
Industry profitability is expected to strengthen and stable over the next five years in line with rising demands of the consumers. However, profit growth will be limited by strong internal and external competition and forecast rising purchasing costs. As competition rises, it will become even more important for operators to define their niche and find a way to differentiate themselves from competitors, whether through services offered or quality of service. Food costs are forecast to increase due to strong emerging market demand and volatile weather conditions. The trend towards serving more innovative, exotic food and using locally sourced and sustainable produce will also increase purchasing costs for caterers. Wage costs are also expected to increase by 2.0% per year on average over the next five years to reach $3.0 billion, as higher-paid chefs and consultants are brought on to provide more complex fare.
Looking ahead the food service/caterers industry is in the mat ...
It is a final project we had to present to the SLITHM with regarding to final year of our Degree.this is a kind of innovative idea which we have brought forward to Sri Lanka.
Improving profitability for small businessBen Wann
In this comprehensive presentation, we will explore strategies and practical tips for enhancing profitability in small businesses. Tailored to meet the unique challenges faced by small enterprises, this session covers various aspects that directly impact the bottom line. Attendees will learn how to optimize operational efficiency, manage expenses, and increase revenue through innovative marketing and customer engagement techniques.
Buy Verified PayPal Account | Buy Google 5 Star Reviewsusawebmarket
Buy Verified PayPal Account
Looking to buy verified PayPal accounts? Discover 7 expert tips for safely purchasing a verified PayPal account in 2024. Ensure security and reliability for your transactions.
PayPal Services Features-
🟢 Email Access
🟢 Bank Added
🟢 Card Verified
🟢 Full SSN Provided
🟢 Phone Number Access
🟢 Driving License Copy
🟢 Fasted Delivery
Client Satisfaction is Our First priority. Our services is very appropriate to buy. We assume that the first-rate way to purchase our offerings is to order on the website. If you have any worry in our cooperation usually You can order us on Skype or Telegram.
24/7 Hours Reply/Please Contact
usawebmarketEmail: support@usawebmarket.com
Skype: usawebmarket
Telegram: @usawebmarket
WhatsApp: +1(218) 203-5951
USA WEB MARKET is the Best Verified PayPal, Payoneer, Cash App, Skrill, Neteller, Stripe Account and SEO, SMM Service provider.100%Satisfection granted.100% replacement Granted.
Premium MEAN Stack Development Solutions for Modern BusinessesSynapseIndia
Stay ahead of the curve with our premium MEAN Stack Development Solutions. Our expert developers utilize MongoDB, Express.js, AngularJS, and Node.js to create modern and responsive web applications. Trust us for cutting-edge solutions that drive your business growth and success.
Know more: https://www.synapseindia.com/technology/mean-stack-development-company.html
Personal Brand Statement:
As an Army veteran dedicated to lifelong learning, I bring a disciplined, strategic mindset to my pursuits. I am constantly expanding my knowledge to innovate and lead effectively. My journey is driven by a commitment to excellence, and to make a meaningful impact in the world.
What is the TDS Return Filing Due Date for FY 2024-25.pdfseoforlegalpillers
It is crucial for the taxpayers to understand about the TDS Return Filing Due Date, so that they can fulfill your TDS obligations efficiently. Taxpayers can avoid penalties by sticking to the deadlines and by accurate filing of TDS. Timely filing of TDS will make sure about the availability of tax credits. You can also seek the professional guidance of experts like Legal Pillers for timely filing of the TDS Return.
Explore our most comprehensive guide on lookback analysis at SafePaaS, covering access governance and how it can transform modern ERP audits. Browse now!
What are the main advantages of using HR recruiter services.pdfHumanResourceDimensi1
HR recruiter services offer top talents to companies according to their specific needs. They handle all recruitment tasks from job posting to onboarding and help companies concentrate on their business growth. With their expertise and years of experience, they streamline the hiring process and save time and resources for the company.
[Note: This is a partial preview. To download this presentation, visit:
https://www.oeconsulting.com.sg/training-presentations]
Sustainability has become an increasingly critical topic as the world recognizes the need to protect our planet and its resources for future generations. Sustainability means meeting our current needs without compromising the ability of future generations to meet theirs. It involves long-term planning and consideration of the consequences of our actions. The goal is to create strategies that ensure the long-term viability of People, Planet, and Profit.
Leading companies such as Nike, Toyota, and Siemens are prioritizing sustainable innovation in their business models, setting an example for others to follow. In this Sustainability training presentation, you will learn key concepts, principles, and practices of sustainability applicable across industries. This training aims to create awareness and educate employees, senior executives, consultants, and other key stakeholders, including investors, policymakers, and supply chain partners, on the importance and implementation of sustainability.
LEARNING OBJECTIVES
1. Develop a comprehensive understanding of the fundamental principles and concepts that form the foundation of sustainability within corporate environments.
2. Explore the sustainability implementation model, focusing on effective measures and reporting strategies to track and communicate sustainability efforts.
3. Identify and define best practices and critical success factors essential for achieving sustainability goals within organizations.
CONTENTS
1. Introduction and Key Concepts of Sustainability
2. Principles and Practices of Sustainability
3. Measures and Reporting in Sustainability
4. Sustainability Implementation & Best Practices
To download the complete presentation, visit: https://www.oeconsulting.com.sg/training-presentations
Falcon stands out as a top-tier P2P Invoice Discounting platform in India, bridging esteemed blue-chip companies and eager investors. Our goal is to transform the investment landscape in India by establishing a comprehensive destination for borrowers and investors with diverse profiles and needs, all while minimizing risk. What sets Falcon apart is the elimination of intermediaries such as commercial banks and depository institutions, allowing investors to enjoy higher yields.
Discover the innovative and creative projects that highlight my journey throu...dylandmeas
Discover the innovative and creative projects that highlight my journey through Full Sail University. Below, you’ll find a collection of my work showcasing my skills and expertise in digital marketing, event planning, and media production.
Business Valuation Principles for EntrepreneursBen Wann
This insightful presentation is designed to equip entrepreneurs with the essential knowledge and tools needed to accurately value their businesses. Understanding business valuation is crucial for making informed decisions, whether you're seeking investment, planning to sell, or simply want to gauge your company's worth.
The world of search engine optimization (SEO) is buzzing with discussions after Google confirmed that around 2,500 leaked internal documents related to its Search feature are indeed authentic. The revelation has sparked significant concerns within the SEO community. The leaked documents were initially reported by SEO experts Rand Fishkin and Mike King, igniting widespread analysis and discourse. For More Info:- https://news.arihantwebtech.com/search-disrupted-googles-leaked-documents-rock-the-seo-world/
Attending a job Interview for B1 and B2 Englsih learnersErika906060
It is a sample of an interview for a business english class for pre-intermediate and intermediate english students with emphasis on the speking ability.
2. Plan Outline
1. Executive Summary
a. Objectives
b. Mission
2. Company Summary
3. Services
4. Market Analysis Summary
5. Strategy and Implementation Summary
6. Management Summary
7. Financial Plan
Appendix
3. 1. Executive Summary
This restaurant business plan is for magic, a new medium-sized restaurant located in a
neighborhood of Suraj funword, Junagadh. Magic's emphasis will be on organic and
creative ethnic food. An emphasis on organic ingredients is based on magic's dedication
to sustainable development. Additionally, the restaurant procures local foods when
possible, reducing their dependence on fossil fuels used for transportation.
Services
magic offers Junagadh a trendy, fun place to have great food in a social environment.
Chef Mario Langostino has a large repertoire of ethnic ingredients and recipes. Magic
forecasts that the majority of purchases will be from the chef's recommendations. Ethnic
recipes will be used to provide the customers with a diverse, unusual menu. Chef Mario
will also be emphasizing healthy dishes, recognizing the trend within the restaurant
industry for the demand for healthy cuisine.
Customers
Magic believes that the market can be segmented into four distinct groups that it aims to
target. The first group is the lonely rich which number 40000 people. The second group
that will be targeted is young happy customers which are growing at an annual rate of
8% with 15000 potential customers. The third group is rich hippies who naturally desire
organic foods as well as ethnic cuisine. The last group which is particularly interested in
the menu's healthy offerings is dieting women which number 35000 in the Junagadh
area.
Management
Magic has assembled a strong management team. Mr.K.R.Patel will be the general
manager. Andrew has extensive management experience of organizations ranging from
six to 45 people. Jane Flap will be responsible for all of the finance and accounting
functions. Jane's financial control skills will be invaluable in keeping Magic on track and
profitable.
Most important to Magic is the financial success which will be achieved through strict
financial controls. Additionally, success will be ensured by offering a high-quality service
and extremely clean, non-greasy food with interesting twists. Magic does plan to raise
menu rates as the restaurant gets more and more crowded, and to make sure that they
are charging a premium for the feeling of being in the "in crowd."
The market and financial analyses indicate that with a start-up expenditure of
$141,000, Magic can generate over $365,000 in sales by year one $5,65,000 in sales
by the end of year two and produce net profits of over 7.5% on sales by the end of year
three. Profitability will be reached by year two.
4. a. Objectives
1. Sales of $350K the first year, more than half a million the second.
2. Personnel costs less than $300K the first year, less than $400K the second year.
3. Profitable in year two, better than 7.5% profits on sales by year three.
b. Mission
Magic is a great place to eat, combining an intriguing atmosphere with excellent,
interesting food that is also very good for the people who eat there. We want fair profit
for the owners, and a rewarding place to work for the employees.
5. 2. Company Summary
Magic is a single-unit, medium-sized restaurant. We focus on organic and creative food.
The restaurant will be located in a prime neighborhood of Portland. Most important to us
is our financial success, but we believe this will be achieved by offering high-quality
service and extremely clean, non-greasy food with interesting twists.
Company Ownership
The restaurant will start out as a simple sole proprietorship, owned by its founders.
Start-up Summary
We have found the location and secured the lease for $2,000 per month. We will be
able to set up shop in time to begin turning back a profit by the end of month eleven and
be profitable in the second year. The place is already equipped as a restaurant so we
plan to come up with a total of $40,000 in capital, plus a $100,000 SBA-guaranteed
loan, to start up the company.
6. Start-up Funding
Start-up Expenses to Fund $3,000
Start-up Assets to Fund $138,000
Total Funding Required $141,000
Assets
Non-cash Assets from Start-up $50,000
Cash Requirements from Start-up $88,000
Additional Cash Raised $0
Cash Balance on Starting Date $88,000
Total Assets $138,000
Liabilities and Capital
Liabilities
7. Current Borrowing $0
Long-term Liabilities $100,000
Accounts Payable (Outstanding Bills) $1,000
Other Current Liabilities (interest-free) $0
Total Liabilities $101,000
Capital
Planned Investment
Investor 1 $25,000
Investor 2 $15,000
Additional Investment Requirement $0
Total Planned Investment $40,000
Loss at Start-up (Start-up Expenses) ($3,000)
Total Capital $37,000
9. 3. Services
The Menu
The menu is going to be extremely simple but changing every day. We will keep a small
group of constants on the menu and then feature a chef's recommendation that we plan
to have 85% of meals ordering. This will help us to reduce waste and plan ingredients
and purchasing.
Organic Ingredients
The organic ingredient element will allow us to price to the extremely wealthy Internet
entrepreneurs who are looking to spend an exorbitant amount of money to have peace
of mind that their money is still coming back to themselves. We will be extremely
ecologically conscious as well, and spread this across our literature. Eating at Magic will
feel like having contributed to the Sierra Club and drinking fresh squeezed orange juice.
Ethnic Ingredients and Recipes
Our chef will have great latitude in designing and producing menu offerings from many
different world cultures. We will endeavor to procure all the traditional, authentic
ingredients necessary to hold true to these varied and interesting cultural recipes.
Interior Accoutrements
People need to keep life interesting, and our artwork will reflect the world influences that
are core to the attitude of the Magic chef.
10. 4. Market Analysis Summary
Because of the founders' connections within the very trendy area of Portland, we have
an excellent feel for the area and its core group of customers. They will all share
something alike, which is a feeling of being in the "in crowd" and having "gotten it" in life.
Although the crew will be different and not connect with each other in each segment,
each segment is complementary to the others. We do plan to raise menu rates as the
restaurant gets more and more crowded, and to make sure we are charging a premium
for the feeling of being in the "in crowd."
Market Segmentation
The Lonely Rich
Most of the lonely rich are tech workers these days, and most of those tech workers are
Internet workers. Their life has become their website servers and code they write, and
the people who help them to make the decisions in that world. They hang out with each
other, but desperately want to get away from it and use the money they are racking up.
Because this wealth has come fairly easily for them, it is particularly easy to separate
them from their money again - they spend the most on drinks, appetizers and tips.
Young Happy Couples
The restaurant will have an atmosphere that encourages people to bring dates and to
have couples arrive. It won't be awkward for others, and Magic does want to be a social
place where people meet each other and develop a network. These young couples are
generally very successful but balanced and won't be spending as much on drinks.
The Rich Hippies
The rich hippies in Portland are a massive group with tremendous influence over the
city's government and private enterprise. They wear tie-die but drive BMWs and crave
the feeling of being in a social circle that is changing the world - even if in different ways
than in their glory days. We will cater to their ecological ideology and contribute to
charities to help them part with more of their money.
Dieting Women
The organic food menu will always have a line of extremely delicious very low-fat meals.
Magic will have tables of women meeting like they do in shows like Sex and the City, to
discuss all types of matters while feeling good about the food they eat.
11. Market Analysis
Year 1 Year 2 Year 3 Year 4 Year 5
Potential
Growth CAGR
Customers
Lonely Rich 10% 400,000 440,000 484,000 532,400 585,640 10.00%
Young Happy
8% 150,000 162,000 174,960 188,957 204,074 8.00%
Couples
13. 5. Strategy and Implementation Summary
Our strategy is simple, we intend to succeed by giving people a combination of
great,healthy, interesting food, and an environment that attracts "trendy" people like a
magnet. Implementation isn't simple, but that's in the doing of it, not in the plan.
Competitive Edge
Our competitive edge is the menu, the chef, the environment, and the tie-in to what's
trendy.
Sales Strategy
As the table shows, we intend to deliver sales of about $350K in the first year, and to
double that by the third year of the plan.
14. Sales Forecast
Year 1 Year 2 Year 3
Unit Sales
Meals 22,822 35,000 45,000
Drinks 11,415 17,500 22,500
Other 240 500 1,000
Total Unit Sales 34,477 53,000 68,500
Unit Prices Year 1 Year 2 Year 3
Meals $15.00 $15.00 $15.00
Drinks $2.00 $2.00 $2.00
Other $10.00 $10.00 $10.00
Sales
Meals $342,330 $525,000 $675,000
15. Drinks $22,830 $35,000 $45,000
Other $2,400 $5,000 $10,000
Total Sales $367,560 $565,000 $730,000
Direct Unit Costs Year 1 Year 2 Year 3
Meals $2.00 $2.00 $2.00
Drinks $0.50 $0.50 $0.50
Other $1.00 $1.00 $1.00
Direct Cost of Sales
Meals $45,644 $70,000 $90,000
Drinks $5,708 $8,750 $11,250
Other $240 $500 $1,000
Subtotal Direct Cost of Sales $51,592 $79,250 $102,250
16. 6. Management Summary
Mr.K.R.Patel has great experience managing personnel and we are quite confident of
his ability to find the best staff possible. Our chef, Mario Langostino, is already on board
and has a published cookbook that will add prestige to the restaurant immediately. We
will be looking to find a young, ultra-hip staff to make sure we add the edge that makes
Magic so trendy.
Personnel Plan
As the personnel plan shows, we expect to invest in a good team, fairly compensated.
We think the planned staff is in good proportion to the size of the restaurant and
projected revenues.
Personnel Plan
Year 1 Year 2 Year 3
Manager $60,000 $65,000 $70,000
Hostess $42,000 $45,000 $50,000
Chef $54,000 $60,000 $65,000
Cleaning $30,000 $35,000 $40,000
Waiters $72,000 $100,000 $130,000
Other $24,000 $52,000 $55,000
17. Total People 8 10 12
Total Payroll $282,000 $357,000 $410,000
18. 7. Financial Plan
We expect to raise $40,000 of our own capital, and to borrow $100,000 guaranteed
by the SBA as a 10-year loan. This provides the bulk of the start-up financing required.
Break-even Analysis
Our break-even analysis is based on the average of the first-year numbers for total
sales by meal served, total cost of sales, and all operating expenses. These are
presented as per-unit revenue, per-unit cost, and fixed costs. We realize that this is not
really the same as fixed cost, but these conservative assumptions make for a better
estimate of real risk.
Break-even Analysis
Monthly Units Break-even 3,205
Monthly Revenue Break-even $34,171
19. Assumptions:
Average Per-Unit Revenue $10.66
Average Per-Unit Variable Cost $1.50
Estimated Monthly Fixed Cost $29,375
Projected Profit and Loss
As the profit and loss table shows, we expect to become barely profitable in the second
year of business, and to make an acceptable profit in the third year.
20. Pro Forma Profit and Loss
Year 1 Year 2 Year 3
Sales $367,560 $565,000 $730,000
Direct Cost of Sales $51,592 $79,250 $102,250
Other $0 $0 $0
Total Cost of Sales $51,592 $79,250 $102,250
Gross Margin $315,969 $485,750 $627,750
Gross Margin % 85.96% 85.97% 85.99%
Expenses
Payroll $282,000 $357,000 $410,000
Sales and Marketing and Other
$27,000 $35,830 $72,122
Expenses
Depreciation $0 $0 $0
21. Utilities $1,200 $1,260 $1,323
Payroll Taxes $42,300 $53,550 $61,500
Other $0 $0 $0
Total Operating Expenses $352,500 $447,640 $544,945
Profit Before Interest and Taxes ($36,532) $38,110 $82,806
EBITDA ($36,532) $38,110 $82,806
Interest Expense $9,673 $8,887 $7,637
Taxes Incurred $0 $7,306 $19,105
Net Profit ($46,204) $21,917 $56,063
Net Profit/Sales -12.57% 3.88% 7.68%
Projected Cash Flow
The cash flow projection shows that starting cost and provisions for ongoing expenses
are adequate to meet our needs until the business itself generates its own cash flow
sufficient to support operations.
22. Pro Forma Cash Flow
Year 1 Year 2 Year 3
Cash Received
Cash from Operations
Cash Sales $367,560 $565,000 $730,000
Subtotal Cash from Operations $367,560 $565,000 $730,000
23. Additional Cash Received
Sales Tax, VAT, HST/GST Received $0 $0 $0
New Current Borrowing $0 $0 $0
New Other Liabilities (interest-free) $0 $0 $0
New Long-term Liabilities $0 $0 $0
Sales of Other Current Assets $0 $0 $0
Sales of Long-term Assets $0 $0 $0
New Investment Received $0 $0 $0
Subtotal Cash Received $367,560 $565,000 $730,000
Expenditures Year 1 Year 2 Year 3
Expenditures from Operations
Cash Spending $282,000 $357,000 $410,000
Bill Payments $117,968 $185,584 $257,538
24. Subtotal Spent on Operations $399,968 $542,584 $667,538
Additional Cash Spent
Sales Tax, VAT, HST/GST Paid Out $0 $0 $0
Principal Repayment of Current Borrowing $0 $0 $0
Other Liabilities Principal Repayment $0 $0 $0
Long-term Liabilities Principal Repayment $6,133 $10,000 $15,000
Purchase Other Current Assets $0 $0 $0
Purchase Long-term Assets $0 $0 $0
Dividends $0 $0 $0
Subtotal Cash Spent $406,101 $552,584 $682,538
Net Cash Flow ($38,541) $12,416 $47,462
Cash Balance $49,459 $61,875 $109,337
Projected Balance Sheet
The table shows projected balance sheet for three years.
25. Pro Forma Balance Sheet
Year 1 Year 2 Year 3
Assets
Current Assets
Cash $49,459 $61,875 $109,337
Other Current Assets $50,000 $50,000 $50,000
Total Current Assets $99,459 $111,875 $159,337
Long-term Assets
Long-term Assets $0 $0 $0
Accumulated Depreciation $0 $0 $0
Total Long-term Assets $0 $0 $0
Total Assets $99,459 $111,875 $159,337
26. Liabilities and Capital Year 1 Year 2 Year 3
Current Liabilities
Accounts Payable $14,796 $15,294 $21,693
Current Borrowing $0 $0 $0
Other Current Liabilities $0 $0 $0
Subtotal Current Liabilities $14,796 $15,294 $21,693
Long-term Liabilities $93,867 $83,867 $68,867
Total Liabilities $108,663 $99,161 $90,560
Paid-in Capital $40,000 $40,000 $40,000
Retained Earnings ($3,000) ($49,204) ($27,287)
Earnings ($46,204) $21,917 $56,063
Total Capital ($9,204) $12,713 $68,776
Total Liabilities and Capital $99,459 $111,875 $159,337
27. Net Worth ($9,204) $12,713 $68,776
Business Ratios
Business ratios for the years of this plan are shown below. Industry Profile ratios based
on the Standard Industrial Classification (SIC) code 5813, Eating Places, are shown for
comparison.
Ratio Analysis
Industry
Year 1 Year 2 Year 3
Profile
Sales Growth n.a. 53.72% 29.20% 7.60%
Percent of Total Assets
Other Current Assets 50.27% 44.69% 31.38% 35.60%
Total Current Assets 100.00% 100.00% 100.00% 43.70%
Long-term Assets 0.00% 0.00% 0.00% 56.30%
Total Assets 100.00% 100.00% 100.00% 100.00%
Current Liabilities 14.88% 13.67% 13.61% 32.70%
28. Long-term Liabilities 94.38% 74.97% 43.22% 28.50%
Total Liabilities 109.25% 88.64% 56.84% 61.20%
Net Worth -9.25% 11.36% 43.16% 38.80%
Percent of Sales
Sales 100.00% 100.00% 100.00% 100.00%
Gross Margin 85.96% 85.97% 85.99% 60.50%
Selling, General & Administrative
98.90% 82.32% 78.45% 39.80%
Expenses
Advertising Expenses 0.65% 1.77% 6.16% 3.20%
Profit Before Interest and Taxes -9.94% 6.75% 11.34% 0.70%
Main Ratios
Current 6.72 7.31 7.34 0.98
Quick 6.72 7.31 7.34 0.65
29. Total Debt to Total Assets 109.25% 88.64% 56.84% 61.20%
Pre-tax Return on Net Worth 501.98% 229.87% 109.29% 1.70%
Pre-tax Return on Assets -46.46% 26.12% 47.18% 4.30%
Additional Ratios Year 1 Year 2 Year 3
Net Profit Margin -12.57% 3.88% 7.68% n.a
Return on Equity 0.00% 172.40% 81.52% n.a
Activity Ratios
Accounts Payable Turnover 8.91 12.17 12.17 n.a
Payment Days 27 30 26 n.a
Total Asset Turnover 3.70 5.05 4.58 n.a
Debt Ratios
Debt to Net Worth 0.00 7.80 1.32 n.a
Current Liab. to Liab. 0.14 0.15 0.24 n.a
30. Liquidity Ratios
Net Working Capital $84,663 $96,580 $137,643 n.a
Interest Coverage -3.78 4.29 10.84 n.a
Additional Ratios
Assets to Sales 0.27 0.20 0.22 n.a
Current Debt/Total Assets 15% 14% 14% n.a
Acid Test 6.72 7.31 7.34 n.a
Sales/Net Worth 0.00 44.44 10.61 n.a
Dividend Payout 0.00 0.00 0.00 n.a
31. Appendix
Sales Forecast
Mont Mont Mont Mont Mont Mont Mont Mont Mont Mont Mont Mont
h 1 h 2 h 3 h 4 h 5 h 6 h 7 h 8 h 9 h 10 h 11 h 12
Unit
Sales
3,83
Meals 0% 779 1,053 1,505 1,553 1,652 1,633 1,173 1,520 2,066 2,602 3,451
5
Drink 1,91
50% 390 527 753 777 826 817 587 760 1,033 1,301 1,726
s 8
Other 0% 20 20 20 20 20 20 20 20 20 20 20 20
Total
5,77
Unit 1,189 1,600 2,278 2,350 2,498 2,470 1,780 2,300 3,119 3,923 5,197
3
Sales
Unit
Mont Mont Mont Mont Mont Mont Mont Mont Mont Mont Mont Mont
Price
h 1 h 2 h 3 h 4 h 5 h 6 h 7 h 8 h 9 h 10 h 11 h 12
s
$15.0 $15.0 $15.0 $15.0 $15.0 $15.0 $15.0 $15.0 $15.0 $15.0 $15.0 $15.
Meals
0 0 0 0 0 0 0 0 0 0 0 00
32. Drink $2.0
$2.00 $2.00 $2.00 $2.00 $2.00 $2.00 $2.00 $2.00 $2.00 $2.00 $2.00
s 0
$10.0 $10.0 $10.0 $10.0 $10.0 $10.0 $10.0 $10.0 $10.0 $10.0 $10.0 $10.
Other
0 0 0 0 0 0 0 0 0 0 0 00
Sales
$11,6 $15,7 $22,5 $23,2 $24,7 $24,4 $17,5 $22,8 $30,9 $39,0 $51,7 $57,
Meals
85 95 75 95 80 95 95 00 90 30 65 525
Drink $1,05 $1,50 $1,55 $1,65 $1,63 $1,17 $1,52 $2,06 $2,60 $3,45 $3,8
$780
s 4 6 4 2 4 4 0 6 2 2 36
Other $200 $200 $200 $200 $200 $200 $200 $200 $200 $200 $200 $200
Total $12,6 $17,0 $24,2 $25,0 $26,6 $26,3 $18,9 $24,5 $33,2 $41,8 $55,4 $61,
Sales 65 49 81 49 32 29 69 20 56 32 17 561
Direc
t Unit Mont Mont Mont Mont Mont Mont Mont Mont Mont Mont Mont Mont
Cost h 1 h 2 h 3 h 4 h 5 h 6 h 7 h 8 h 9 h 10 h 11 h 12
s
0.00 $2.0
Meals $2.00 $2.00 $2.00 $2.00 $2.00 $2.00 $2.00 $2.00 $2.00 $2.00 $2.00
% 0
$0.50 $0.50 $0.50 $0.50 $0.50 $0.50 $0.50 $0.50 $0.50 $0.50 $0.50
Drink 0.00 $0.5
33. s % 0
0.00 $1.0
Other $1.00 $1.00 $1.00 $1.00 $1.00 $1.00 $1.00 $1.00 $1.00 $1.00 $1.00
% 0
Direc
t
Cost
of
Sales
$1,55 $2,10 $3,01 $3,10 $3,30 $3,26 $2,34 $3,04 $4,13 $5,20 $6,90 $7,6
Meals
8 6 0 6 4 6 6 0 2 4 2 70
Drink
$195 $264 $377 $389 $413 $409 $294 $380 $517 $651 $863 $959
s
Other $20 $20 $20 $20 $20 $20 $20 $20 $20 $20 $20 $20
Subt
otal
Direc
$1,77 $2,39 $3,40 $3,51 $3,73 $3,69 $2,66 $3,44 $4,66 $5,87 $7,78 $8,6
t
3 0 7 5 7 5 0 0 9 5 5 49
Cost
of
Sales
Personnel Plan
Mont Mont Mont Mont Mont Mont Mont Mont Mont Mont Mont Mont
35. General Assumptions
Mont Mont Mont Mont Mont Mont Mont Mont Mont Mont Mont Mont
h1 h2 h3 h4 h5 h6 h7 h8 h 9 h 10 h 11 h 12
Plan
Mont 1 2 3 4 5 6 7 8 9 10 11 12
h
Curre
nt
10.00 10.00 10.00 10.00 10.00 10.00 10.00 10.00 10.00 10.00 10.00 10.00
Intere
% % % % % % % % % % % %
st
Rate
Long-
term
10.00 10.00 10.00 10.00 10.00 10.00 10.00 10.00 10.00 10.00 10.00 10.00
Intere
% % % % % % % % % % % %
st
Rate
Tax 30.00 25.00 25.00 25.00 25.00 25.00 25.00 25.00 25.00 25.00 25.00 25.00
Rate % % % % % % % % % % % %
Other 0 0 0 0 0 0 0 0 0 0 0 0
Pro Forma Profit and Loss
Mont Mont Mont Mont Mont Mont Mont Mont Mont Mont Mont Mont
42. g
Other
Liabilitie
s
$0 $0 $0 $0 $0 $0 $0 $0 $0 $0 $0 $0
Principal
Repaym
ent
Long-
term
Liabilitie
s $488 $492 $496 $500 $505 $509 $513 $517 $522 $526 $530 $535
Principal
Repaym
ent
Purchas
e Other
$0 $0 $0 $0 $0 $0 $0 $0 $0 $0 $0 $0
Current
Assets
Purchas
e Long-
$0 $0 $0 $0 $0 $0 $0 $0 $0 $0 $0 $0
term
Assets
Dividend
$0 $0 $0 $0 $0 $0 $0 $0 $0 $0 $0 $0
s
Subtotal
$25,2 $32,4 $33, $34, $34, $34, $34,3 $33, $34, $35, $36, $38,
Cash
71 90 119 106 219 432 56 382 178 405 634 510
Spent
43. Net
($12, ($15, ($8,8 ($9,0 ($7,5 ($8,1 ($15, ($8,8 ($92 $6,4 $18, $23,
Cash
606) 441) 38) 57) 87) 03) 387) 62) 2) 27 783 051
Flow
Cash $75,3 $59,9 $51, $42, $34, $26, $10,9 $2,1 $1,1 $7,6 $26, $49,
Balance 94 54 115 058 472 369 81 20 98 25 408 459
Pro Forma Balance Sheet
Mont Mont Mont Mont Mont Mont Mont Mont Mont Mont Mont Mont
h 1 h 2 h 3 h 4 h 5 h 6 h 7 h 8 h 9 h 10 h 11 h 12
Start
ing
Assets
Bala
nces
Current
Assets
$88,0 $75, $59, $51, $42, $34, $26, $10, $2,1 $1,1 $7,6 $26, $49,
Cash
00 394 954 115 058 472 369 981 20 98 25 408 459
Other
$50,0 $50, $50, $50, $50, $50, $50, $50, $50, $50, $50, $50, $50,
Current
00 000 000 000 000 000 000 000 000 000 000 000 000
Assets
Total $138, $125 $109 $101 $92, $84, $76, $60, $52, $51, $57, $76, $99,
44. Curren 000 ,394 ,954 ,115 058 472 369 981 120 198 625 408 459
t
Assets
Long-
term
Assets
Long-
term $0 $0 $0 $0 $0 $0 $0 $0 $0 $0 $0 $0 $0
Assets
Accum
ulated
$0 $0 $0 $0 $0 $0 $0 $0 $0 $0 $0 $0 $0
Deprec
iation
Total
Long-
$0 $0 $0 $0 $0 $0 $0 $0 $0 $0 $0 $0 $0
term
Assets
Total $138, $125 $109 $101 $92, $84, $76, $60, $52, $51, $57, $76, $99,
Assets 000 ,394 ,954 ,115 058 472 369 981 120 198 625 408 459
Liabilit
ies Mont Mont Mont Mont Mont Mont Mont Mont Mont Mont Mont Mont
and h 1 h 2 h 3 h 4 h 5 h 6 h 7 h 8 h 9 h 10 h 11 h 12
Capital
Current
Liabiliti
es
Accoun $1,00 $8,1 $8,7 $9,7 $9,8 $10, $10, $9,0 $9,7 $10, $12, $13, $14,